In this article I will walk you through a problem we recently experienced with AWS Elastic Load Balancer (ELB). After quickly describing the architecture of our application and putting the issue in the proper context, I’ll jump right into the troubleshooting process.
Troubleshooting this issue was definitely interesting as I used a variety of good tools (including wireshark and sysdig) to achieve my goal and adopted a strictly top-down approach, starting from monitoring metrics at a high level and drilling down into the details just when necessary for proving (or invalidating) my assumptions.
Our architecture
Our main application, Sysdig Monitor, is a container monitoring tool consisting of a centralized backend and several agents. These agents establish a persistent TCP connection to our service, and they send metrics every few seconds using a binary protocol.
The component that first ingests these metrics is called “collector”, and it’s essentially a Java application that reads data coming from the agents, does some processing on it (e.g. license check, data sanitization, …), and queues the metrics in our internal pipeline. At the end of the pipeline, the data is persistently stored in our database, ready to be consumed by our users.
Each agent sends a few KB per second of data, and we have many thousands agents reporting to Sysdig Monitor at the same time. As a result of this high load, the collector is a distributed and horizontally scaled component, and the agent connections are evenly spread across multiple collector instances. In front of the collectors, given that our SaaS application runs on AWS, we naturally opted for ELB as our load balancer.
ELB has tons of advantages, namely its tight integration with EC2 Autoscaling, SSL offloading, the ability to be provisioned via CloudFormation, and ultimately the peace of mind that comes with not having yet another piece of infrastructure to manually maintain.
The collector is not only horizontally scaled, but it’s also reasonably optimized for vertical scaling: by writing lean code with asynchronous I/O handling, each collector can easily handle persistent connections from thousands of agents, making that part of the system very efficient.
Rolling deployment process gone wrong
Things start to get a bit more complicated when we introduce deployments into the picture. In order to minimize downtime, we adopt a rolling deployment model, where we update one collector at a time and we wait until that instance is healthy before moving on to the next one. This way, there is always a quorum of collectors up and running at any given time. The process looks like this:
- We detach the collector instance that is going to be re-deployed from the ELB
- We update the code on the instance
- After checking that the application is up and running on the instance, we reattach it to the ELB
- Rinse and repeat with another collector
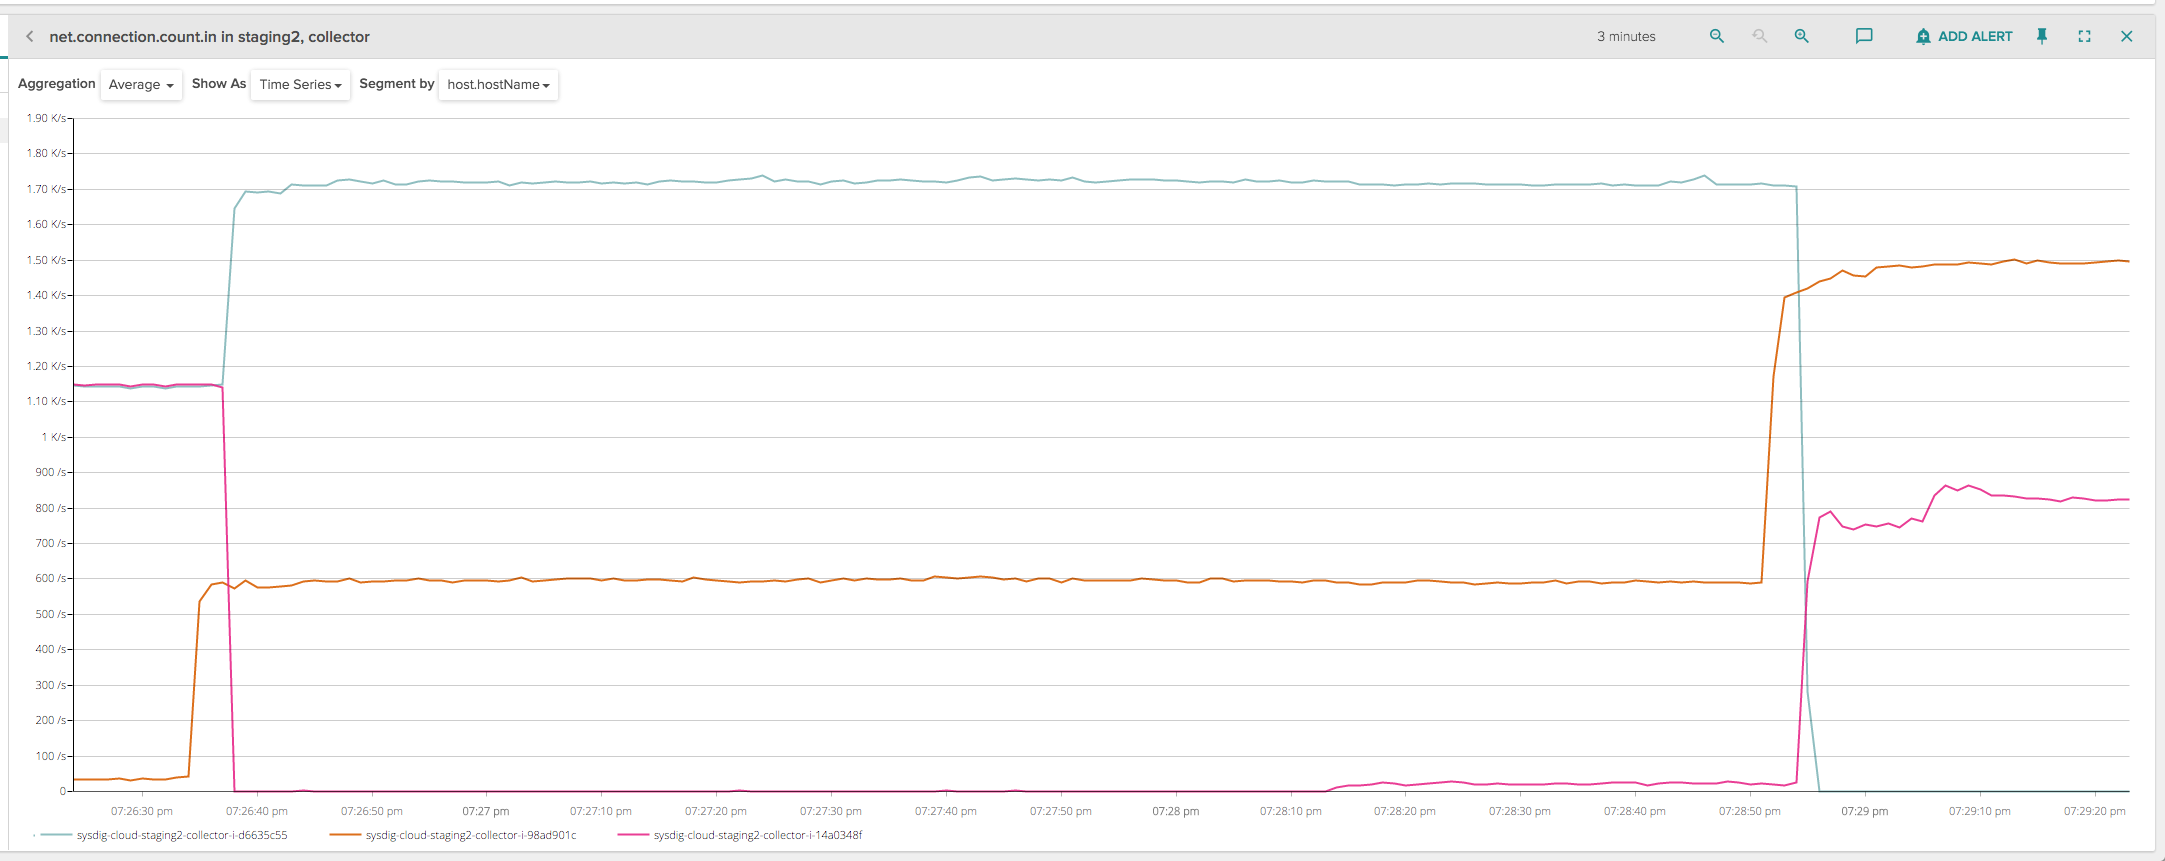
At step 1, ELB immediately drops all the currently active connections on that collector instance. The clients then instantly try to reconnect, and the ELB just forwards them to a different healthy instance. The behavior can be seen by charting the number of inbound network connections to a collector instance that is going to be deployed.
For these kind of charts, I like to use Sysdig Monitor – our commercial product – as it has some very powerful real-time charting capabilities and strong support for system metrics:
This chart shows a rolling deployment of 2 collectors (2300 connected clients) on a test infrastructure with 3 collectors. When the deployment happens on the first instance (purple line) at 7:26:35, all the connections are instantly dropped. Same thing with the second instance (green line) at 7:28:55. Unfortunately, this creates a spike of activity in our infrastructure, because all those clients reconnect immediately and we have an increased burst of load on the other collectors, as it can be seen in the picture.
The spike happens because the first few seconds of client activity upon reconnection are computationally the most expensive, since some extra authentication and accounting code needs to run and generate a considerable amount of activity towards various databases. Eventually this spike goes away because at runtime the ingestion pipeline is very efficient, but if we find ourselves doing many deployments a day on many collectors, which we love doing, this problem adds up and starts causing latency issues and alarms going on and off.
A relatively simple solution was to slightly change our deployment process and introduce a manual connection draining process: essentially, we could leverage a feature of ELB called connection draining that allows ELB to keep client connections open for a certain amount of time even after the instance has been detached from the ELB, and instead of letting it close all the client connections at once, we slowly close them from within the collector code, at a limited rate (e.g. 50 disconnections per second). This way, we don’t cause abrupt spikes in our infrastructure, at the cost of having our production deployments take a bit longer.
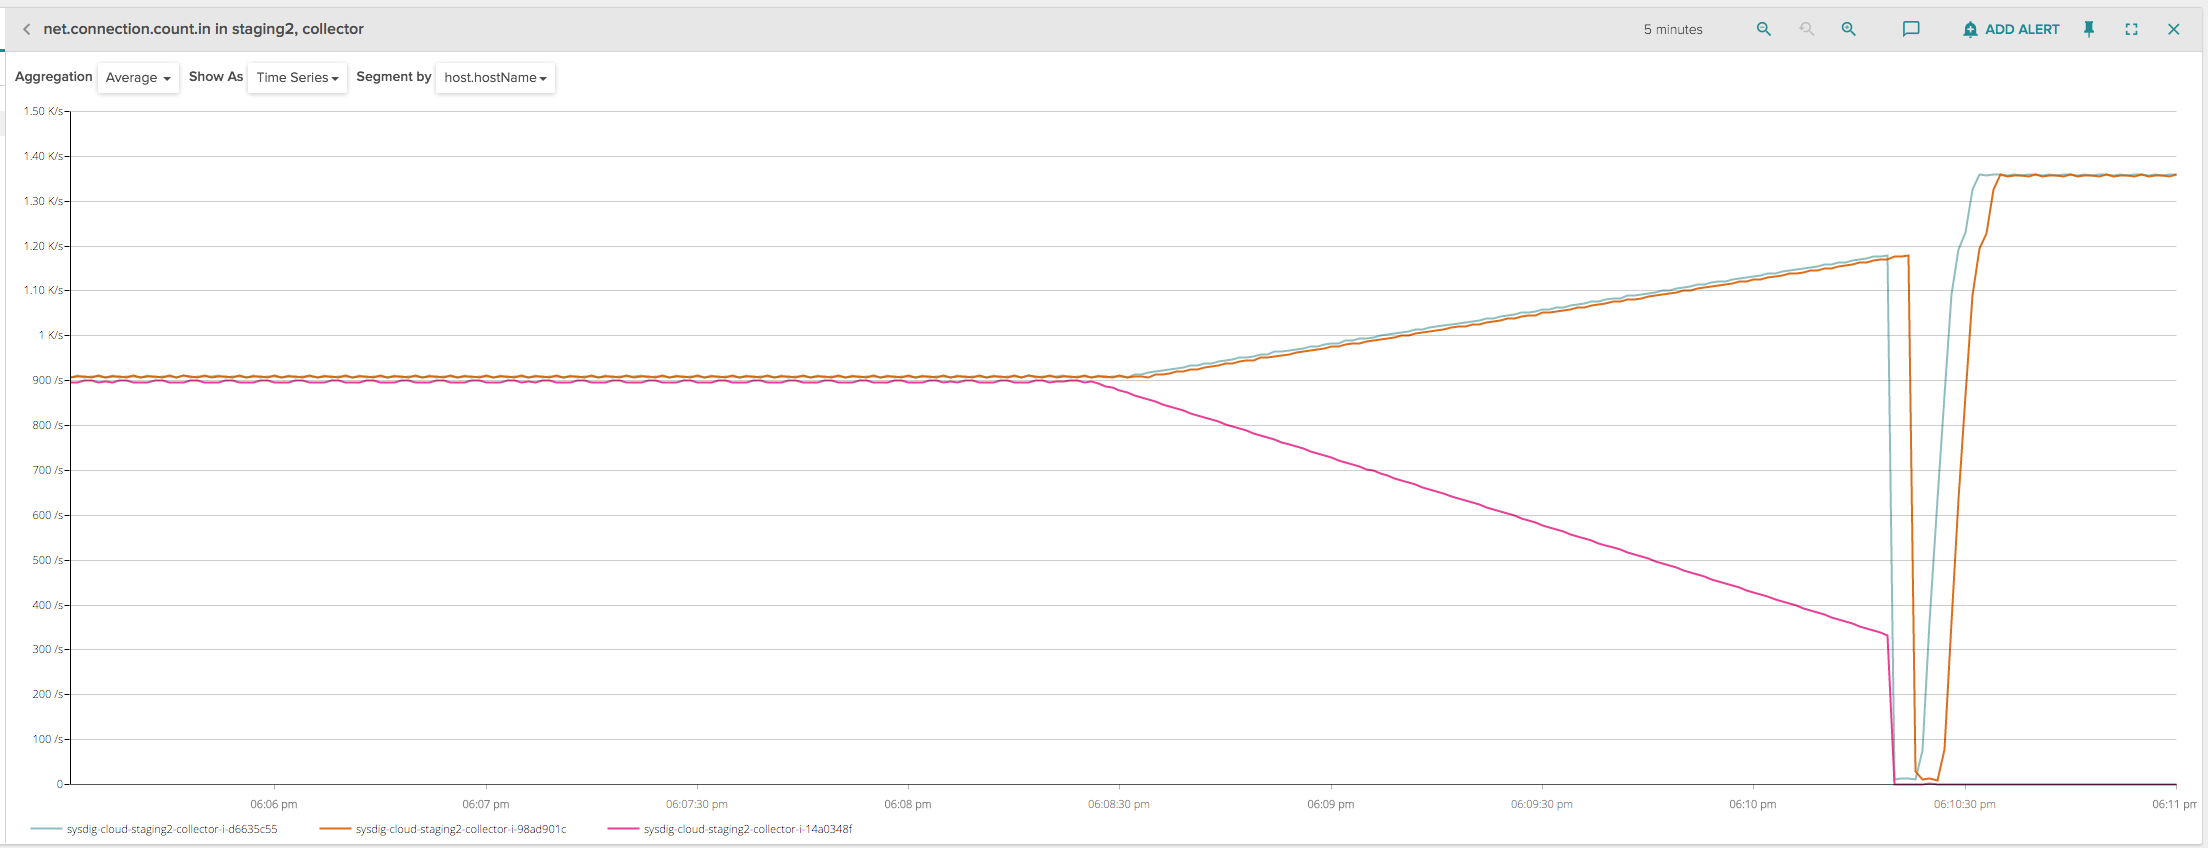
This process was quickly implemented. We initially tried it on a staging environment where we have close to 3000 clients, an ELB with a connection draining timeout set to 600 seconds and 3 collector instances. The deployment looked like this, when analyzed in terms of incoming connections per backend instance:
Lots of spikes, so not exactly what we expected! Let’s dig into what happened: in the left part of the chart, the three instances were correctly handling about 1000 connections each. At about 6:08:30, I started the deployment for one of the instances (purple line), deregistering it from the ELB (so that no new client connections would be routed to this specific instance that was being decommissioned) and enabling, from our application code, the draining process that would disconnect 5 clients per second.
At the same time, the other two remaining collector instances started picking up the disconnected clients that were trying to reconnect, and we can see they increased at a rate of 2.5 per second each. This is exactly what our new code was supposed to do, a very peaceful deployment that doesn’t cause any spike.
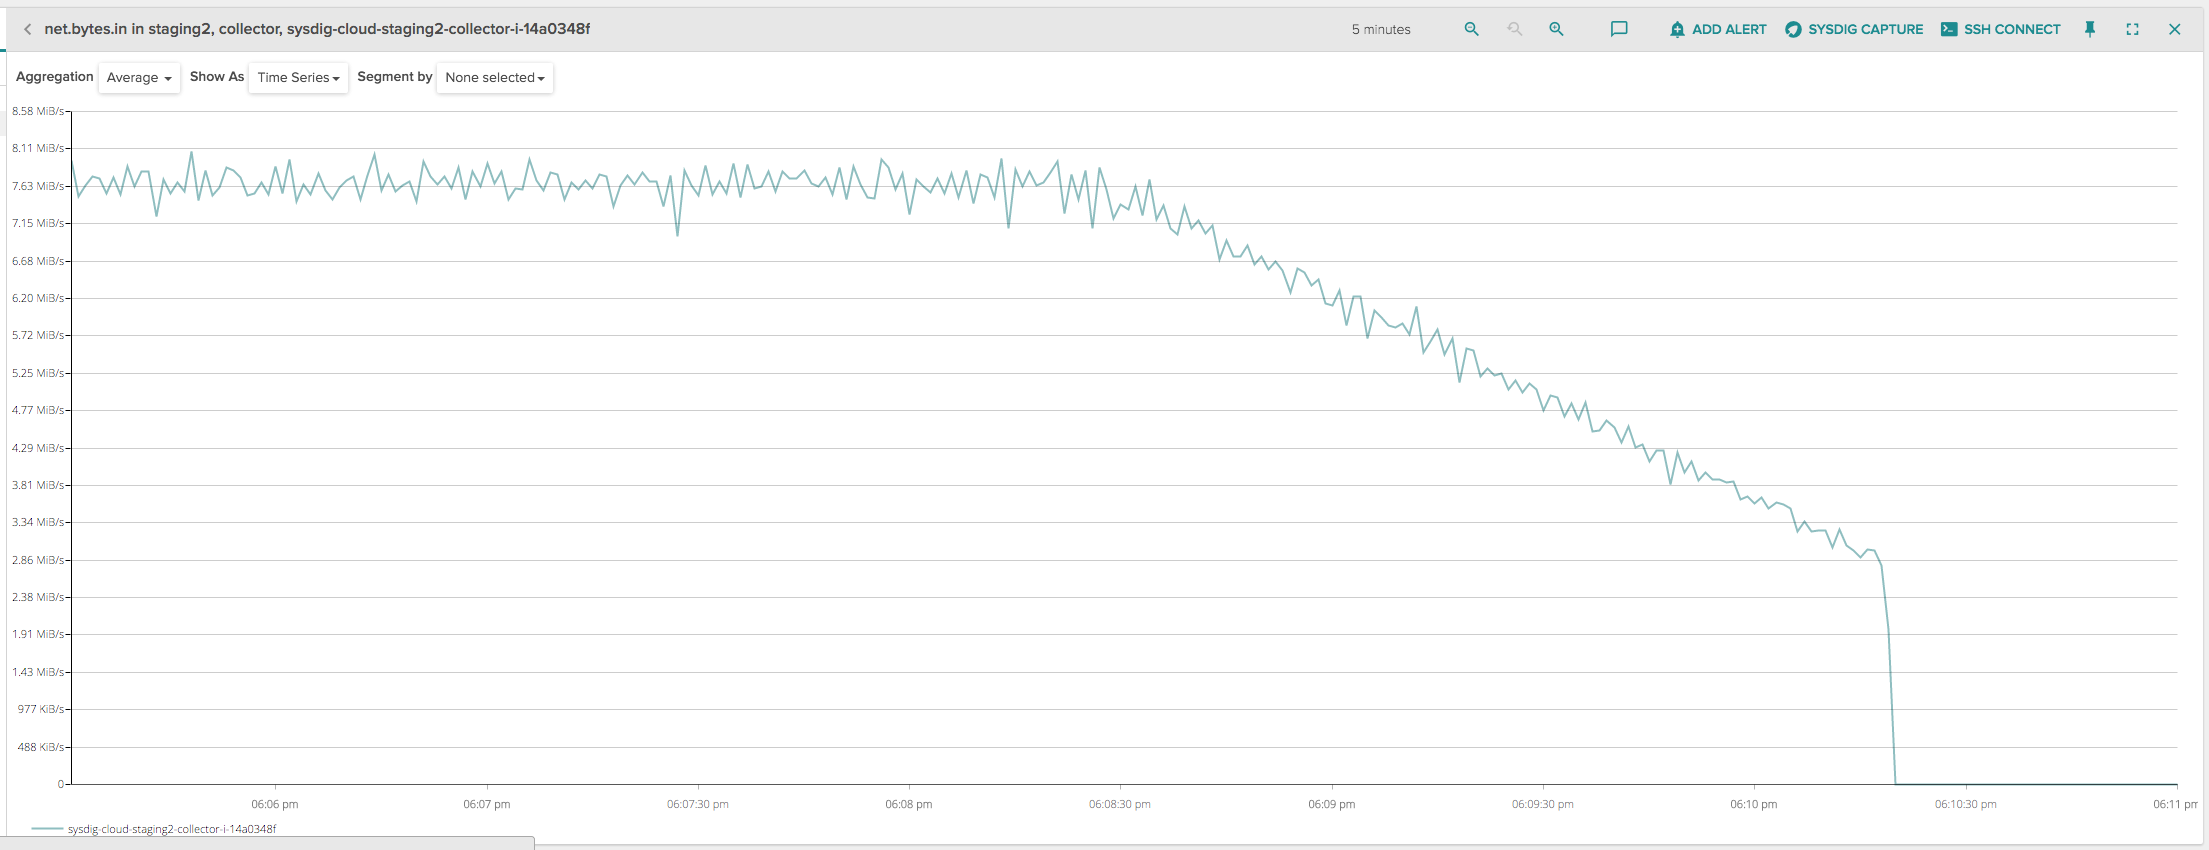
However, at about 6:10:30, the ELB seemed to abruptly drop all the remaining client connections, causing yet another spike that was hard to explain, because the ELB was in draining mode and should have kept the client connections open. Since the disconnections seemed to happen roughly 2 minutes after deregistering the instance, I initially thought that maybe this was a problem of idle connections being prematurely closed by ELB, so I charted the amount of inbound network bytes on the instance being deployed:
My connections seemed all but idle, there was a very decent amount of constant traffic up until the moment ELB terminates them.
After playing around with the various options in the ELB configuration and not finding anything, I started assuming that the problem could be in my code, so I tried to disable the connection draining from our application and did a traditional deployment, with connection draining enabled just on the ELB side (like in the original scenario): to my surprise, the behavior changed and no client connections were closed within the first 2 minutes of deployment, and ELB properly waited the whole draining timeout (600 seconds) before closing all of them.
Was it a problem in my code then? A quick look at the sources didn’t reveal anything, the code seemed so straightforward that it was hard to not get right. Or was it an ELB issue? I could have opened a support ticket with AWS, but admittedly my case was not strong enough, especially because all the clues pointed to my application being somehow at fault, considering that the wrong behavior stopped if I disabled my manual draining. To get more answers, it was time for some serious troubleshooting!
In-depth troubleshooting of Amazon ELB bug with open source sysdig
I decided to take a deeper look with the command line sysdig, a natural choice for the troubleshooting workflow started with Sysdig Monitor. I took a trace file on the instance being deployed and started analyzing it, looking for clues. In particular, I wanted to study the behavior of the network connections during the draining process, as opposed to when they were abruptly closed.
Let’s start by picking an interval of 2 seconds (from 6:09:01 to 6:09:02) while the collector was in the draining process. What I’m looking for is the list of connections that were terminated during this specific interval, so I can just use a sysdig filter on the time range, including close() calls on network connections:
$ sysdig -r trace.scap "evt.rawtime.s >= 1459534141 and evt.rawtime.s <= 1459534142 and fd.type=ipv4 and evt.type=close and evt.dir=>"
36724048 18:09:01.006251319 1 java (12583) > close fd=1122(<4t>10.2.3.74:41329->10.2.2.170:6666)
36724242 18:09:01.006540360 1 java (12537) > close fd=1480(<4t>10.2.3.74:42404->10.2.2.170:6666)
36725001 18:09:01.010982953 1 java (12342) > close fd=1394(<4t>10.2.3.74:42146->10.2.2.170:6666)
36725719 18:09:01.013094686 0 java (12423) > close fd=1301(<4t>10.2.3.74:41866->10.2.2.170:6666)
36725858 18:09:01.013230480 1 java (12489) > close fd=1585(<4t>10.2.3.74:42721->10.2.2.170:6666)
36799359 18:09:02.002792042 1 java (12545) > close fd=1611(<4t>10.2.3.74:42799->10.2.2.170:6666)
36799961 18:09:02.006753813 0 java (12565) > close fd=1113(<4t>10.2.3.74:41302->10.2.2.170:6666)
36800347 18:09:02.007930225 0 java (12595) > close fd=1382(<4t>10.2.3.74:42110->10.2.2.170:6666)
36800948 18:09:02.010518022 1 java (12541) > close fd=1733(<4t>10.2.3.74:43166->10.2.2.170:6666)
36802082 18:09:02.014709068 0 java (12561) > close fd=1619(<4t>10.2.3.74:42823->10.2.2.170:6666)
Here I can see the connections closed during this 2 seconds interval. They are all from 10.2.3.74 (one of the IP addresses of the ELB) to 10.2.2.170 (my collector instance) on port 6666, where my Java application listens for incoming connections. Notice how there are exactly 5 per second, matching the draining rate set in my code and visible in the chart. Let’s focus on one and let’s study its evolution over time. I’m going to pick the connection 10.2.3.74:42110->10.2.2.170:6666, and analyze its events:
$ sysdig -r trace.scap "fd.port=42110"
...
36712412 18:09:00.881506163 1 java (12595) > read fd=1382(<4t>10.2.3.74:42110->10.2.2.170:6666) size=32768
36712413 18:09:00.881511356 1 java (12595) < read res=10732 data=..)..............}.|.....$...I.... .b(...vW........c;.s...{..-K.Kr......$...l.WJ
36799705 18:09:02.004217776 0 java (12595) > read fd=1382(<4t>10.2.3.74:42110->10.2.2.170:6666) size=32768
36799706 18:09:02.004222203 0 java (12595) < read res=4344 data=..'..............}.x....G.myl.EI.E.....d...F..5..$V...y.o....V,K.$;q...54K...)P.
36800347 18:09:02.007930225 0 java (12595) > close fd=1382(<4t>10.2.3.74:42110->10.2.2.170:6666)
36800349 18:09:02.007931045 0 java (12595) < close res=0
Here I can see my Java application periodically reading a constant stream of data that the ELB is sending on behalf of the client. Then, at 6:09:02 the backend decides to gracefully close it because it is in draining mode, and it simply does it with a close() event. Overall, a pretty uneventful connection, and there’s everything I was already expecting: my Java process was closing network connections at a controlled rate, hence the gentle curve in the chart.
Now, let’s do the same by focusing on the interval where the connections were abruptly terminated. In the chart, it seems to be happening starting from 6:10:20, so I can use the same filter as before, changing the time:
$ sysdig -r trace.scap "evt.rawtime.s >= 1459534220 and fd.type=ipv4 and evt.type=close and evt.dir=>"
41807067 18:10:20.919093433 1 java (12441) > close fd=1434(<4t>10.2.3.74:42266->10.2.2.170:6666)
41807075 18:10:20.919097290 1 java (12441) > close fd=1687(<4t>10.2.3.74:43028->10.2.2.170:6666)
41807202 18:10:20.919172265 0 java (12326) > close fd=1388(<4t>10.2.3.74:42127->10.2.2.170:6666)
41807212 18:10:20.919176173 0 java (12326) > close fd=1642(<4t>10.2.3.74:42892->10.2.2.170:6666)
41807294 18:10:20.919254145 0 java (12336) > close fd=1391(<4t>10.2.3.74:42137->10.2.2.170:6666)
41807298 18:10:20.919257078 0 java (12336) > close fd=1645(<4t>10.2.3.74:42901->10.2.2.170:6666)
41807348 18:10:20.919342001 0 java (12401) > close fd=1542(<4t>10.2.3.74:42590->10.2.2.170:6666)
41807352 18:10:20.919344824 0 java (12401) > close fd=1290(<4t>10.2.3.74:41833->10.2.2.170:6666)
41807430 18:10:20.919442575 0 java (12403) > close fd=1415(<4t>10.2.3.74:42209->10.2.2.170:6666)
41807434 18:10:20.919445783 0 java (12403) > close fd=1291(<4t>10.2.3.74:41836->10.2.2.170:6666)
41807515 18:10:20.919538091 0 java (12477) > close fd=1199(<4t>10.2.3.74:41560->10.2.2.170:6666)
...
Tons of connections being closed within few microseconds, so these are definitely part of the dip I’m interested in analyzing. Let’s pick one, 10.2.3.74:41833->10.2.2.170:6666, and let’s analyze it thoroughly:
$ sysdig -r trace.scap "fd.port=41833"
...
41694910 18:10:19.369680049 0 java (12401) > read fd=1290(<4t>10.2.3.74:41833->10.2.2.170:6666) size=16384
41694916 18:10:19.369685017 0 java (12401) < read res=11281 data=..,..............}.|....7I.t.B.....ZPbu..<7.V..<"..-......n..6.MR....."..../.ED
41744806 18:10:20.550291594 1 java (12401) > read fd=1290(<4t>10.2.3.74:41833->10.2.2.170:6666) size=16384
41744808 18:10:20.550295939 1 java (12401) < read res=1448 data=..*..............}.|...xo..tZ ....8.-..d&.e..~v.,.)R.......I_......*.....X7D.T..
41773710 18:10:20.840430741 1 java (12401) > read fd=1290(<4t>10.2.3.74:41833->10.2.2.170:6666) size=16384
41773711 18:10:20.840432849 1 java (12401) < read res=0 data=
41807352 18:10:20.919344824 0 java (12401) > close fd=1290(<4t>10.2.3.74:41833->10.2.2.170:6666)
41807353 18:10:20.919345100 0 java (12401) < close res=0
The connection seems to behave exactly the same as the previous one: it has a considerable amount of traffic until it is terminated, and it is closed by our application. This would seem to reinforce the theory that my code is to blame for this weird behavior.
However, if you look carefully, you’ll see an interesting detail: the last read() call done right before closing the connection (event #41773711) returns zero, and that didn’t happen in the previous analyzed connection. The man page of the read() system call states: “On success, the number of bytes read is returned (zero indicates end of file)”. So, the backend closed the connection because it received an end-of-file from the kernel, which essentially means that the connection was closed from our peer, the ELB, even if it shouldn’t have because the draining period was not expired yet!
There was still one possibility to rule out: could it be possible that my clients somehow were the initiators of this connection termination, and the ELB was merely closing the connections on behalf of my agents? It seemed strange, but I did the exact same analysis above on a bunch of clients (omitted here for brevity) and I could clearly see that ELB was the one to terminate the connections in both directions. How we found a bug in Amazon #AWS #ELB Click to tweet
Correlating system and network activity with Wireshark
All these observations were already a pretty solid proof that our collector was behaving as expected and that ELB was deliberately closing the network connections when it shouldn’t have, not respecting the draining protocol described in the documentation. However, to further reinforce my case, I decided to take a look at the same behavior, but from a network traffic protocol point of view, and then correlate the two different angles.
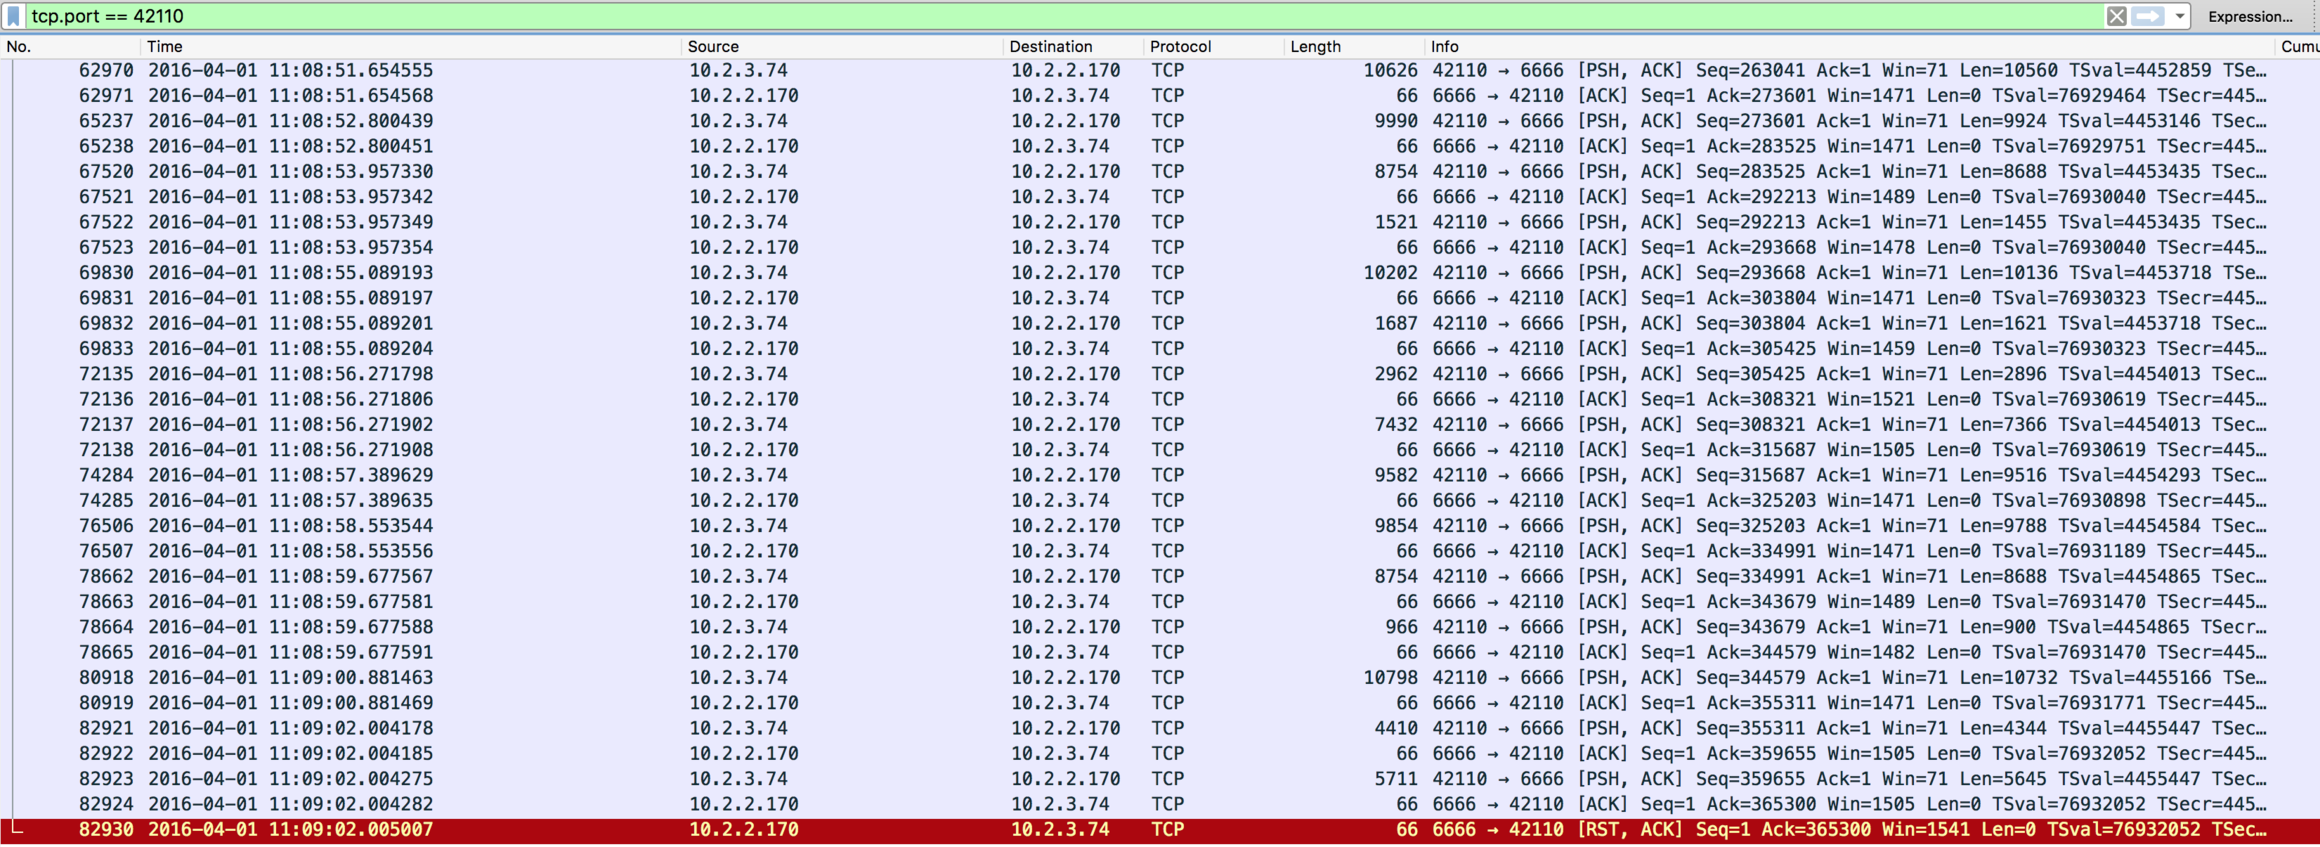
To make this possible, during the deployment I not only took a sysdig capture, but also a tcpdump trace file, which I then explored with Wireshark. This is how the first of the two analyzed connections (the one on port 42110) looks like:
Notice how all the read() calls that I was seeing in sysdig are matched by TCP packets carrying data (length column) flowing from 10.2.3.74 (ELB) to 10.2.2.170 (my instance), whereas packets in the other direction are empty and are just acknowledgements that my host is sending to the peer to confirm data was received.
What is very interesting here is how the close() system call shows up in this trace file: it is translated in a TCP RST packet (#82930) sent from my application, which essentially means the collector decided to reset, and thus close, the connection. Again, nothing I didn’t really know already since the connection was being actively drained by my application, but it’s quite interesting, when doing troubleshooting, to know how a specific system behavior translates into a particular network activity pattern.
Let’s see what happened with the other connection:
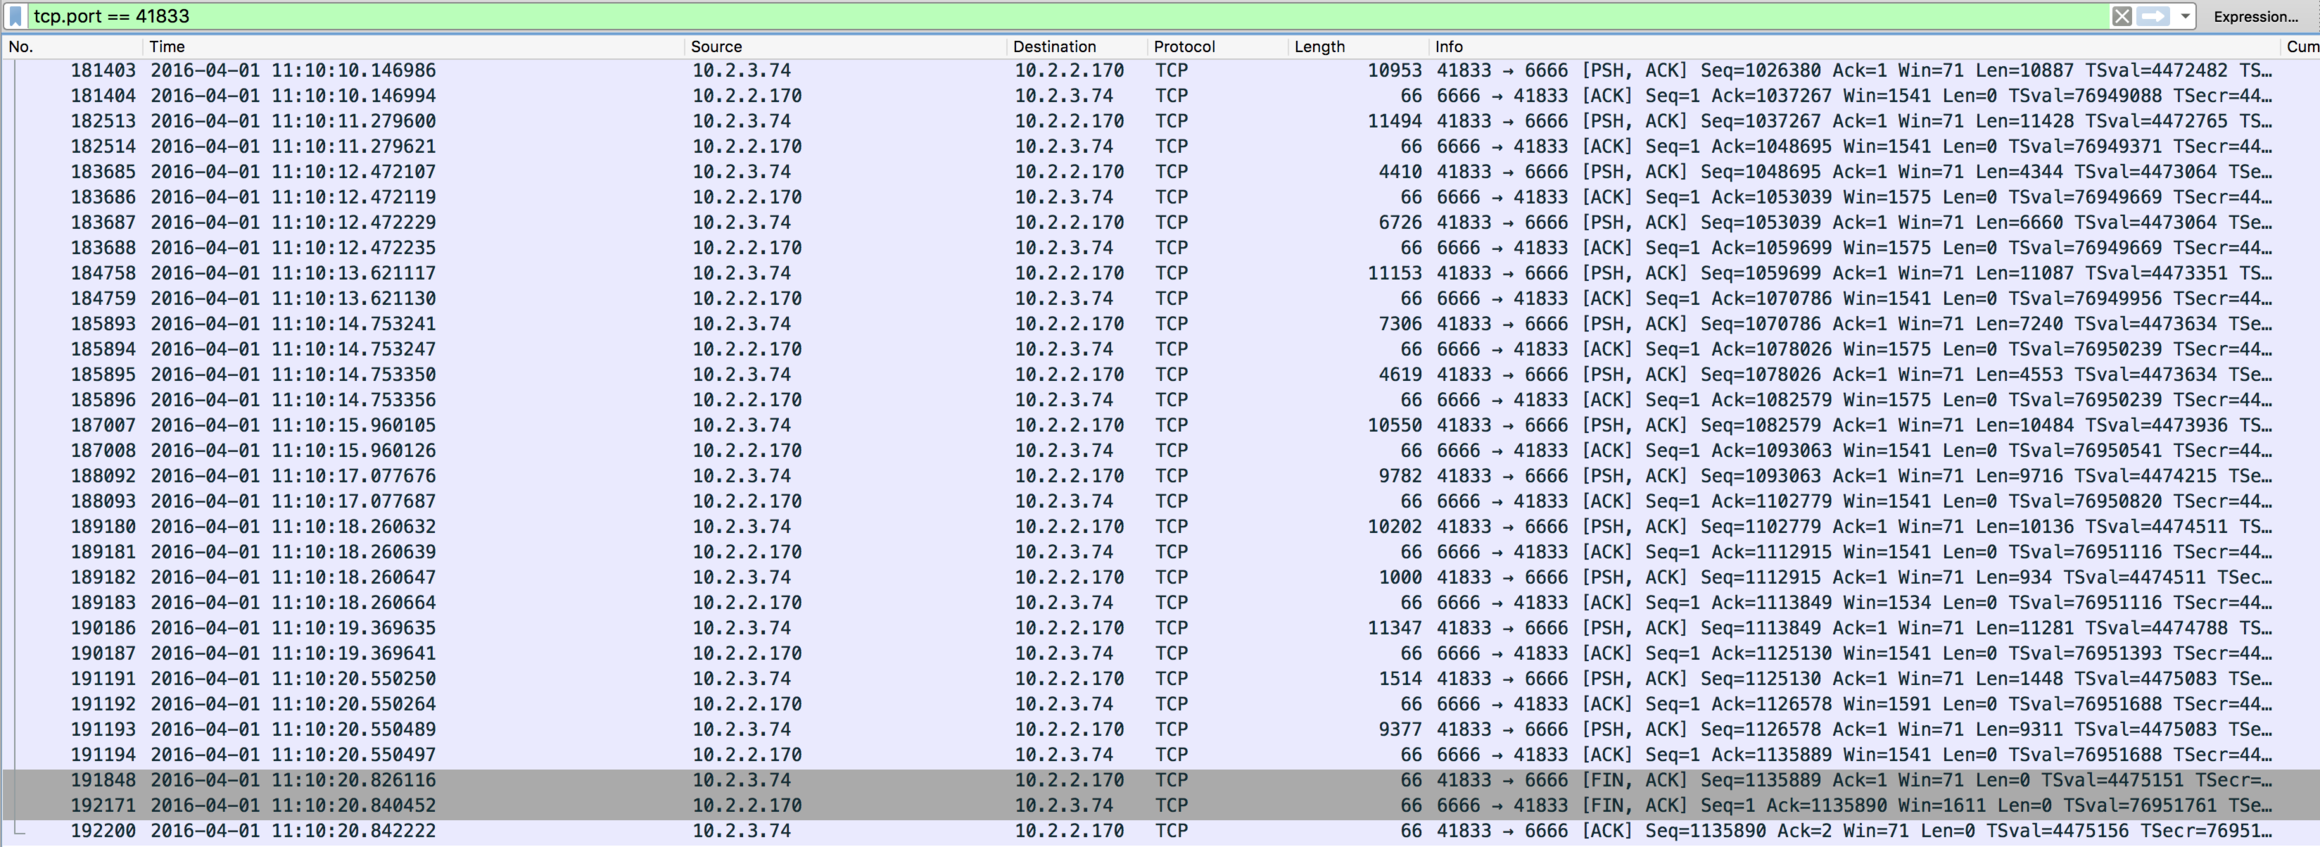
This time, things look different. Notice how, with packet #191848, the ELB is sending a TCP FIN packet to my instance, cleanly terminating the connection from its side. Immediately after, my application follows up by sending a FIN packet itself in order to close the connection from its side as well, but what’s important is that the ELB sent the first FIN, thus starting the termination.
How does this translate to the sysdig events in the trace file we’ve seen before? The first FIN packet shows up as the read() system call returning zero, which is the way through which the kernel, handling the TCP connection, informs my application that the peer closed it (end of file). The second FIN packet, instead, is generated right after my application calls the close() on the connection. Notice also how, up until the very last moment, there’s data flowing on the connection, so that rules out every possibility of my connection being terminated by ELB because of idle timeout.
Overall, the sequence of TCP packets completely matched the behavior I was able to reconstruct by looking at the Sysdig Monitor charts and the sysdig trace file.
Conclusions
With all this rich set of troubleshooting data at hand, I reached out to the AWS support with confidence, and after some brief email exchange it was confirmed to be a glitch in ELB and I was given more details about this wrong behavior. In my test environment I had 3 instances registered to the ELB, and each instance was in a separate availability zone.
When using ELB with backend instances in different zones, ELB physically allocates at least one “internal ELB node” in each zone where there is an active backend instance, and every ELB node in a specific zone is responsible for forwarding a portion of the incoming traffic to all the backend instances in that zone. All the IP addresses of these ELB nodes are then registered in a single user-facing DNS name that clients will use.
The problem occurs when one backend instance is de-registered, and that instance is the only remaining instance in its availability zone (like in my case): in this situation, upon de-registration ELB also removes the ELB node that belongs to that availability zone, since there are no more backend instances to connect to.
In theory, the removal should happen smoothly in order to allow all the client connections to be closed according to the draining timeout, but this doesn’t seem to work well when there is a long connection draining timeout and a high number of client connections: in such case, the removal of the internal ELB node happens abruptly, causing all the connections in that zone to be instantly dropped.
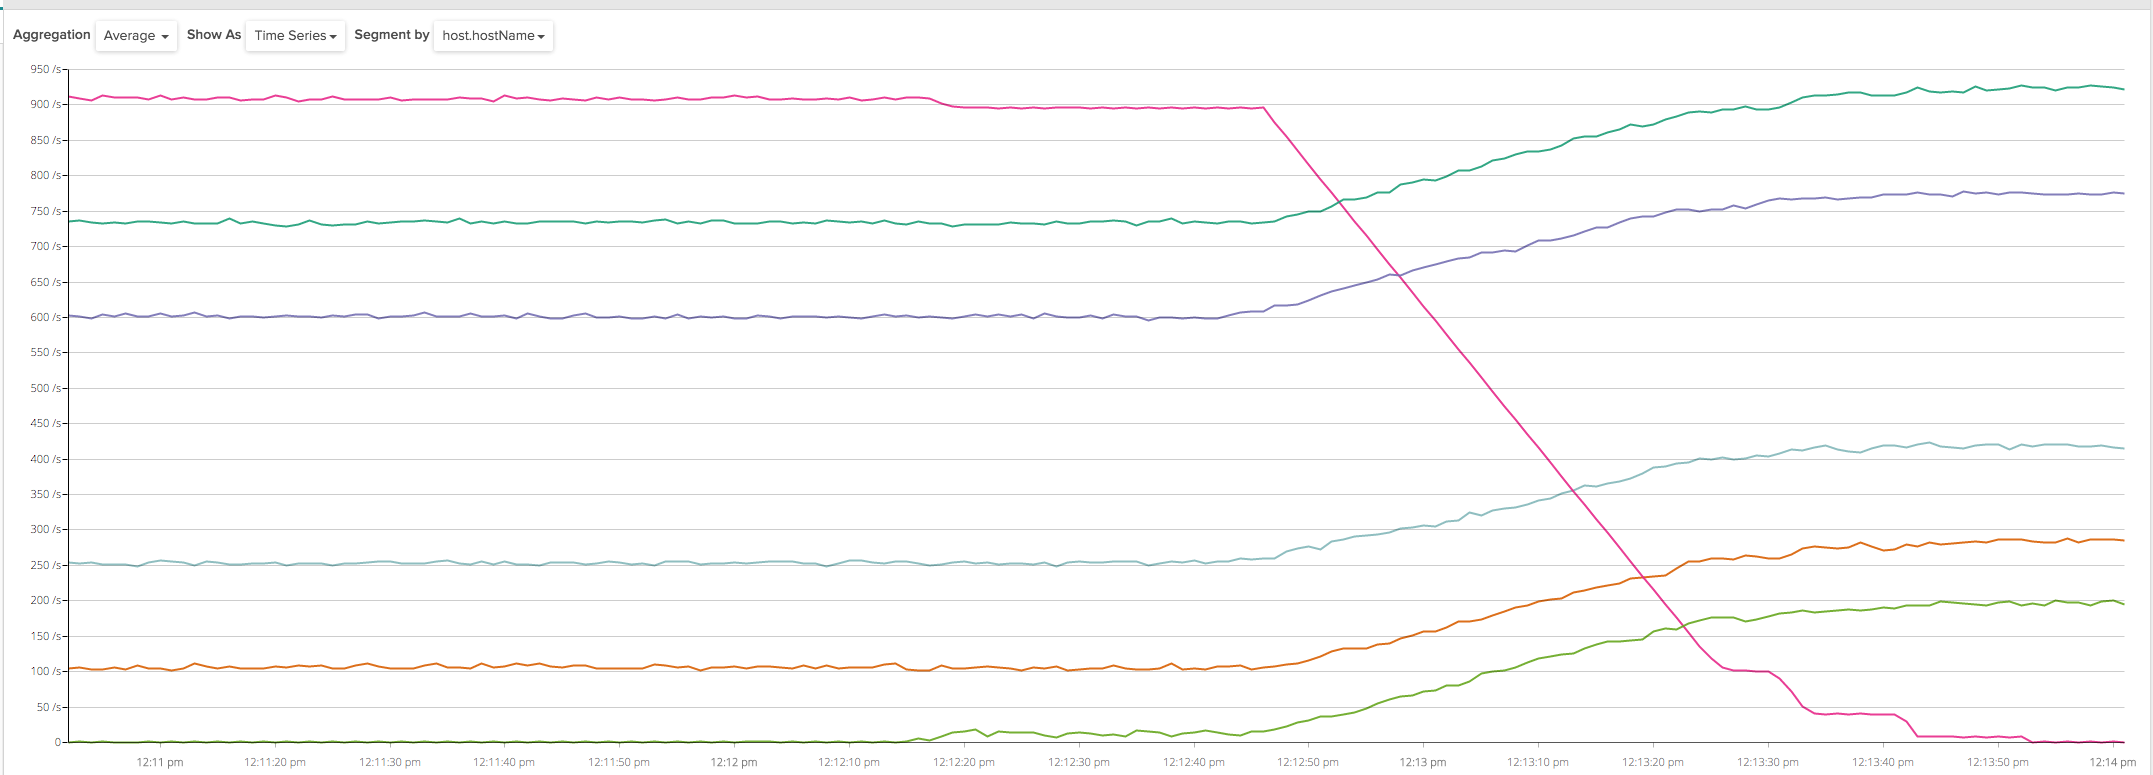
AWS support confirmed they are working on fixing the issue, but after this explanation, a simple workaround consisted in making sure there were always at least 2 backend instances per availability zone pointed by ELB, and by deploying a total of 6 instances evenly spread across my 3 zones I was indeed finally able to get a smooth collector rollout in my test environment:
Other lessons learned? As usual, having a deep knowledge of your application and its surrounding components is going to be incredibly important, and the right way to gain such knowledge is by constantly monitoring all the pieces of your infrastructure. The observation of the entire system must be done at different levels: there are times when slightly glancing at the statsd metrics pushed by your application will be enough, and there are other times, like today, where you are going to need some solid troubleshooting at a low level.


