

On Wall Street and Containers
As Gordon Gekko famously said in the movie Wall Street, “Greed is Good.” In fact you could say the same thing applies in containerized environments – containers want their fair share and then some! (You kinda want to see that Wall Street clip again, don’t you? Here ya go – be on the lookout for a very young Charlie Sheen as well!)
In Part 1 of Monitoring Greedy Containers, we showed you how Docker sets resource utilization limits for containers, as well as how soft limits (shares) vs hard limits (quotas) work for CPU utilization.
In this post, we’re going to take that information and apply it to troubleshooting a Kubernetes environment. Let’s use a web application as the basis for the example, and we’ll use Sysdig Cloud to visualize the data.
Example: Allocating resources with Kubernetes in traffic spikes
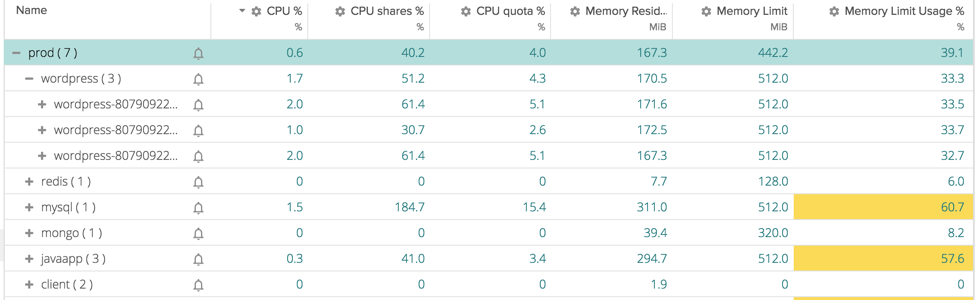
Below, you can see an application running on Kubernetes composed of several services. Applications are grouped by namespace, replication controller, and pod in a hierarchy. In steady state, every service has an appropriate level of CPU and Memory allocated and they are running fine.
In a peak of traffic instead, we see something going wrong. Our users are experiencing slow loads of our website and the cause is clear if we go again in the previous table:
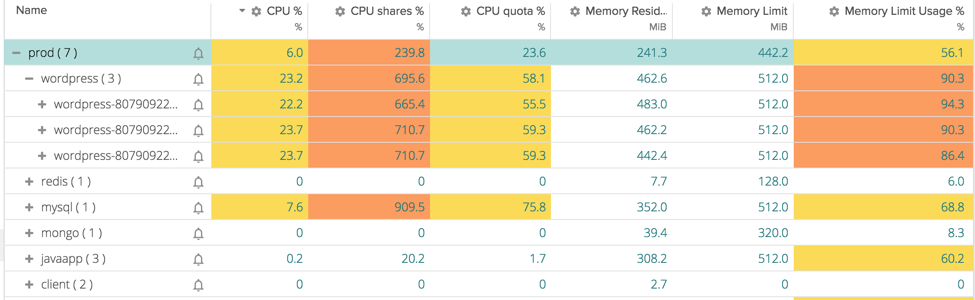
WordPress pods are using 6x the shares assigned to them (because other processes are not using them) and they are also filling up their assigned memory limit. Looks like we need to spawn new pods of our wordpress application to be able to handle the traffic.
Example: Troubleshooting an overallocated host
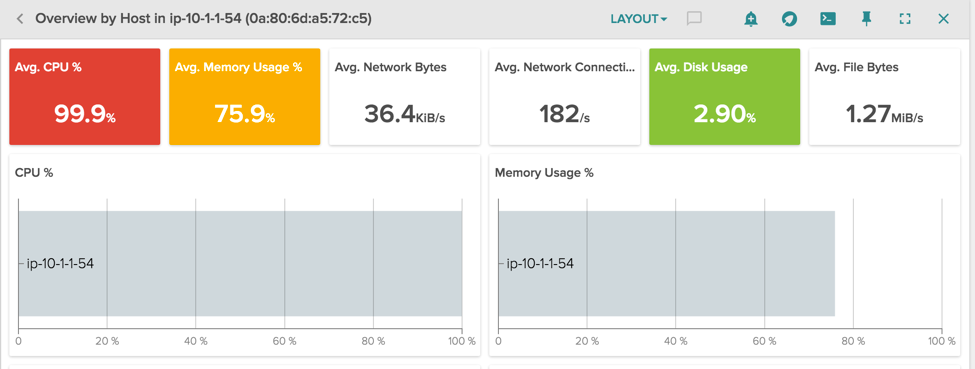
Here instead we have another odd situation, our host is using 100% of the cpu and almost all the memory available:
With the correct segmentation of the resource usage it’s easy to spot the problem. Let’s look at the pre-built view Container Resources in Sysdig Cloud:
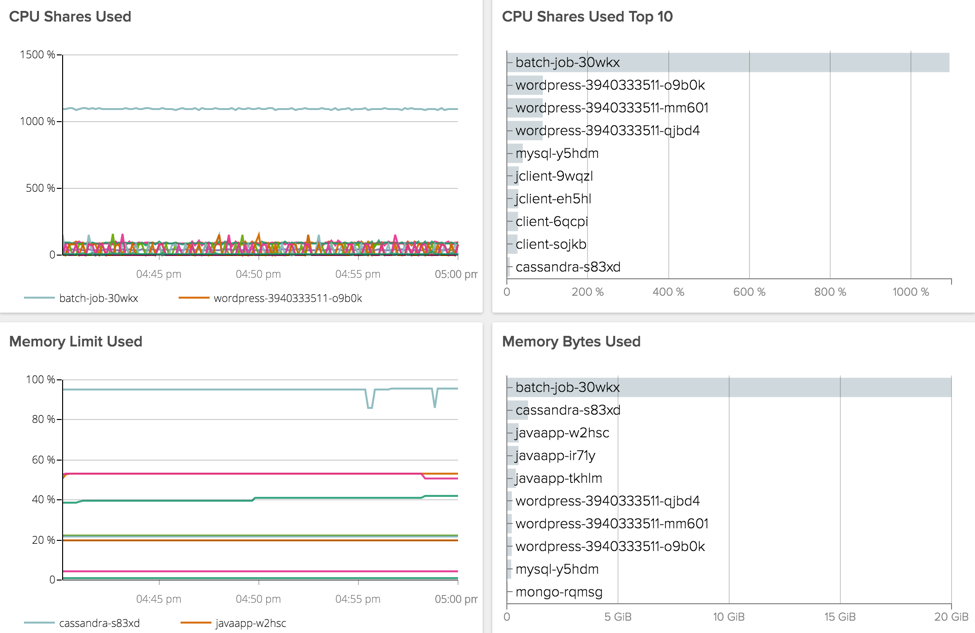
Clearly there is a batch job that is using all the cpu available because we’ve not assigned limits to it. (Note that because Sysdig Cloud provides process-level visibility, it can see resource consumers that might not actually be in your containers. That’s particularly useful for rogue processes or compromised environments.) The batch job also has no memory limit: it’s using 20GB and may grow further, leading the host to a crash.
A safe cap to our pods is important in a Kubernetes cluster, because they share resources with other applications. A noisy neighbour can make damage to other applications running on the same host.
Conclusion
The flexibility and power of containers requires you to fine-tune your monitoring and troubleshooting skills to keep pace. With Sysdig’s ability to measure resource utilization per container, analyze share and quota limits, and alert on over-allocation, we’ll keep you on top of your environment no matter how dynamic it is.
Give it a try and let us know what do you think!