
Today we are opensourcing a python library to easy emit sysdig tracers. This allows you to quickly instrument python code and keep an eye on what your code does and how it performs.
Sysdig Tracers
Recently we have introduced in sysdig a new compelling feature: tracers. They allow you to trace everything with sysdig: method calls, API requests, specific pieces of code (spans), you name it!
To emit a tracer you need just to write a string to /dev/null with a pre-defined syntax and that’s it. It works for any kind of programming language, even from your bash/zsh shell :).
For more details check-out Introducing Sysdig Tracers: open source transaction tracing meets htop and strace.
Tracer Libraries for Node, Go, and Python
To make your life even simpler, we now have a few libraries to wrap up tracers. Two of these were created by TJ Holowaychuk (@tjholowaychuk): node-trace and go-trace. Our eternal thanks for his support and contributions. You need to follow TJ on GitHub too. Do it now!
Sysdig has also released a python library: tracers-py. Let’s have a look to a few little examples that shows off the library, and also what you can do with tracers.
Tracers-py Our design goal is to make tracers as simple to use as possible. Besides writing something to a file is pretty easy, you need to know the exact syntax, do some lifting and so on. Our library is a simple wrapper to make tracers an integrated pythonic experience, they will be just one line of code away.
Let’s see a little snippet of code to understand how it works:
And you’ll see on sysdig:
# sysdig evt.type = tracer
115464 18:04:21.950697998 1 python (13735) > tracer id=13735 tags=hello_world args=
115468 18:04:21.950773788 1 python (13735) < tracer id=13735 tags=hello_world args=
115756 18:04:22.451915898 1 python (13735) > tracer id=13735 tags=hello_world args=
115760 18:04:22.451971114 1 python (13735) < tracer id=13735 tags=hello_world args=
116033 18:04:22.953642790 1 python (13735) > tracer id=13735 tags=hello_world args=
But you can leverage them to track just the system events related to that piece of code for example:
# sysdig evtin.span.tags = hello_world
689 18:07:56.870876714 1 python (13737) > write fd=1(<f>/dev/pts/0) size=12
690 18:07:56.870886666 1 python (13737) > switch next=12200 pgft_maj=0 pgft_min=1048 vm_size=25320 vm_rss=7560 vm_swap=0
692 18:07:56.870894988 1 python (13737) < write res=12 data=Hello World.
693 18:07:56.870895614 1 python (13737) > switch next=12200 pgft_maj=0 pgft_min=1048 vm_size=25320 vm_rss=7560 vm_swap=0
696 18:07:56.870902672 1 python (13737) < tracer id=13737 tags=hello_world args=
</f>
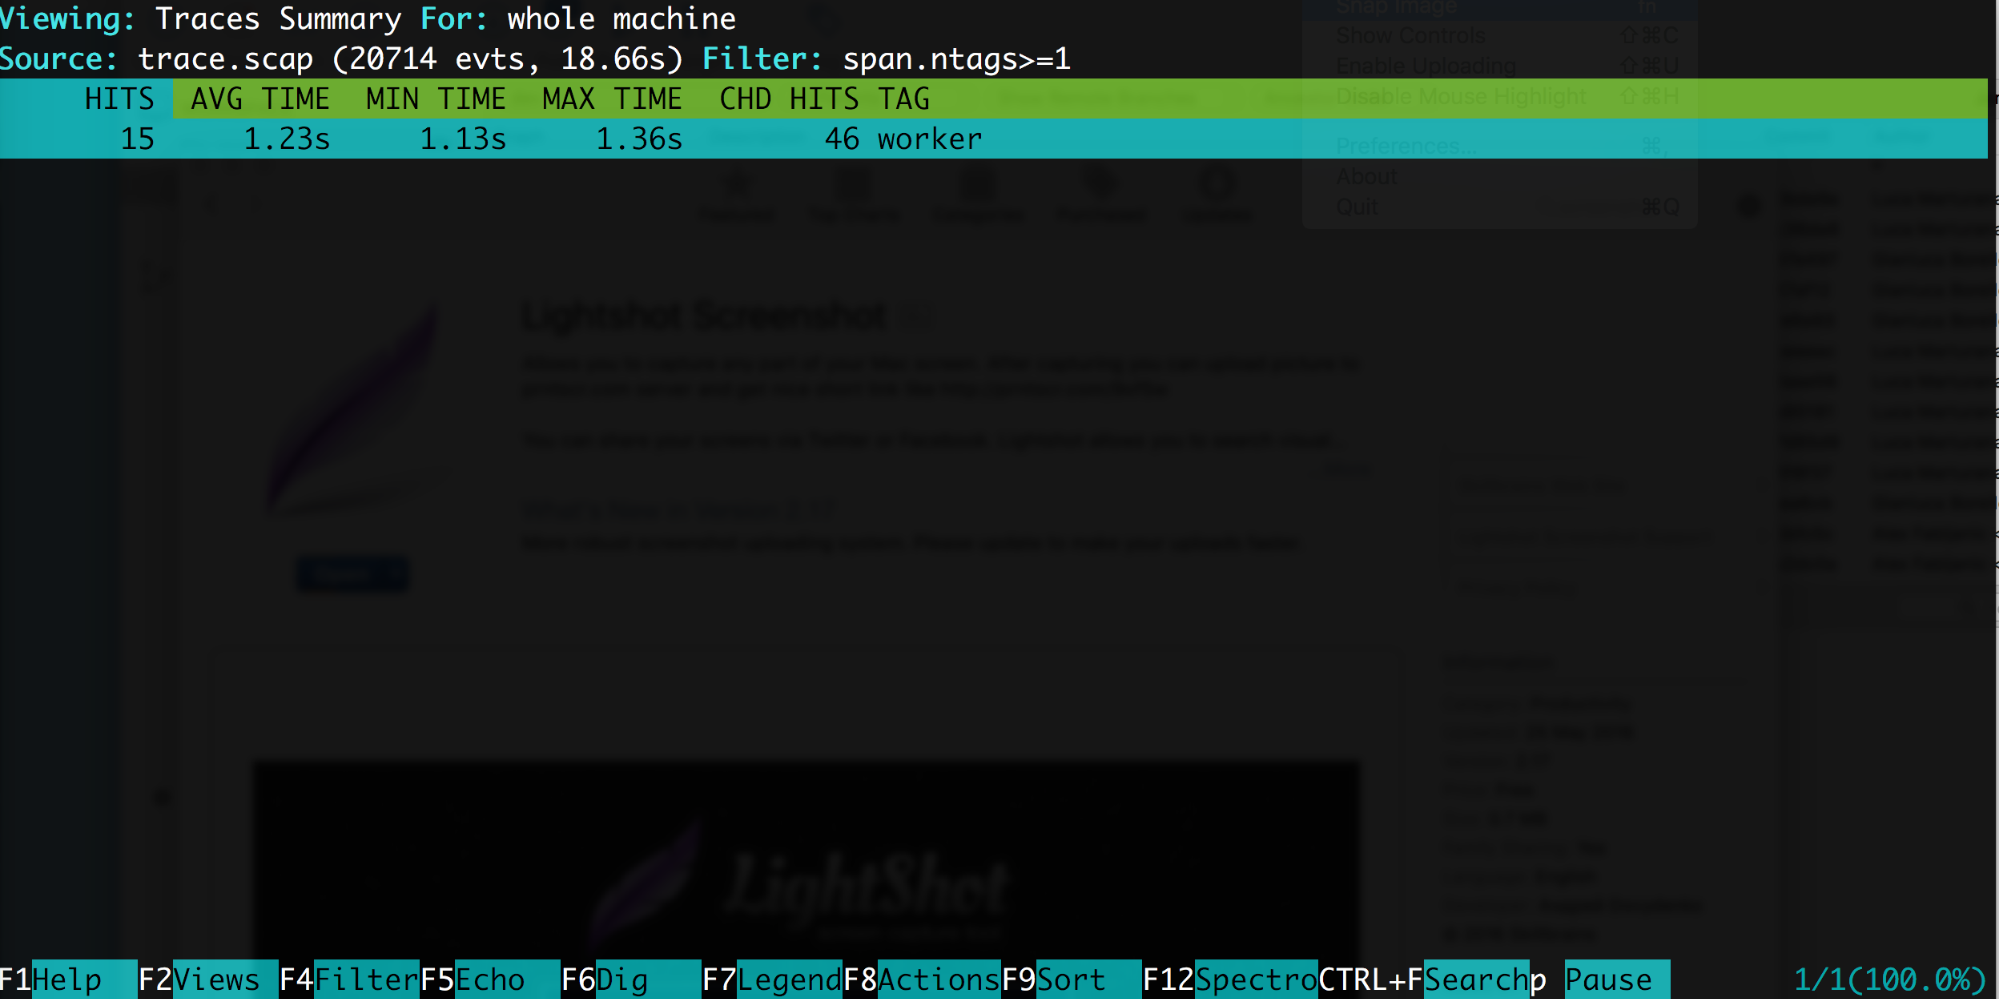
Remember you can use also csysdig, as another example here we are tracing a sample worker function:
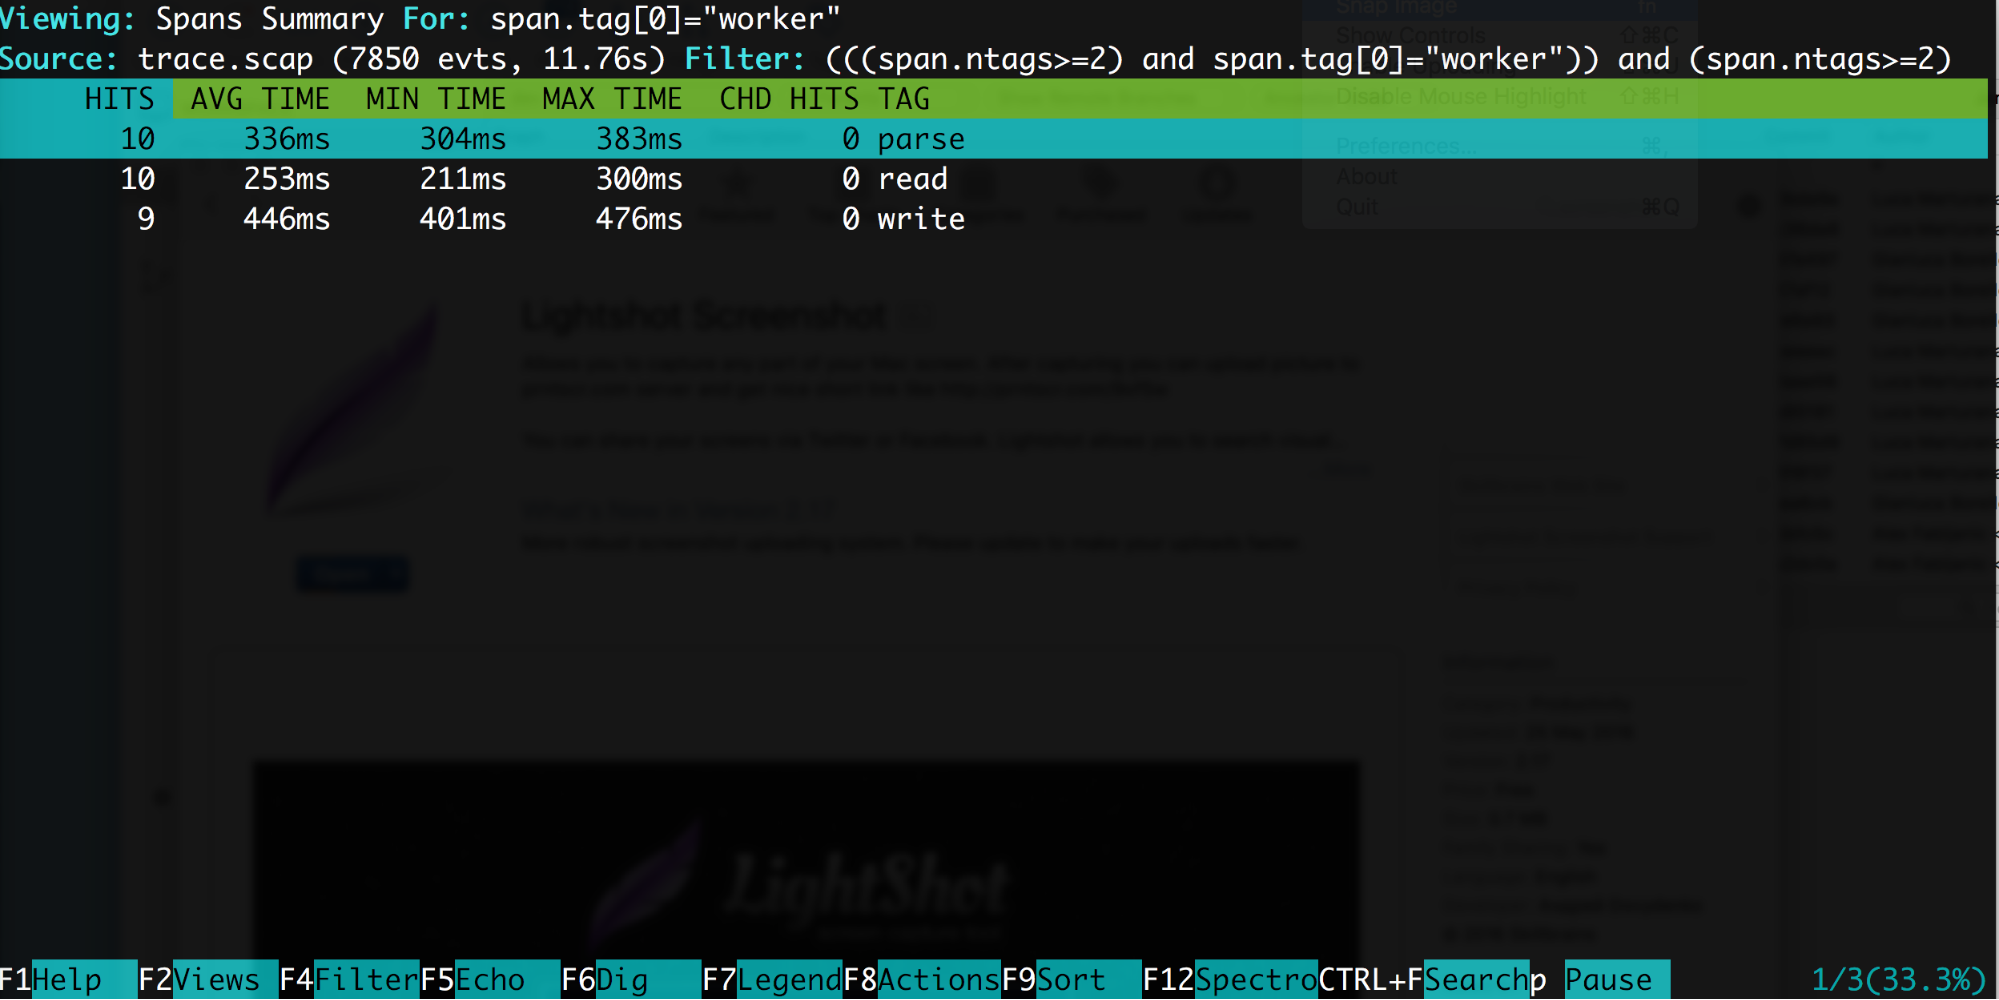
And we can also use drill down feature to see where the time is spent within it:
Advanced usage
The API is simple but can be used in many other ways, for example you can add custom arguments:
Or use it as a function decorator:
You can also trace function arguments and return values, create nested spans and many other things. Check out our examples directory for more.
Recap
Our new python library makes easy to emit tracers and troubleshooting your code with sysdig. Go to our repository, try it out and let us now what do you think! Happy tracing!