
In this article we are going to show how to monitor Nginx on Kubernetes, describing different use cases, peculiarities of running on this platform, relevant metrics and dashboards. We covered Nginx alerting in a second part: Nginx metrics alerts.
Why Nginx?
Nginx is a web server often deployed as a reverse proxy, load balancer and web cache. Designed for high loads of concurrent connections , it is famous for being fast, versatile, reliable and yet very light on resources.
Nginx is a commonplace building block in containerized / cloud deployments. Actually, it is the top containerized application according to our last Docker usage report with a sample size of 45,000 containers.
You can use it as a classical web application server, as the gateway and balancer for a set of microservices or even as the Internet-facing entrypoint (like in a Ingress controller on Kubernetes). When used as a load balancer, other common alternatives to Nginx are: HAProxy, the new and popular Linkerd , a public cloud service like AWS ELB or dedicated load-balancing devices.
Nginx stub_status configuration on Kubernetes
In order to have Nginx expose its internal performance metrics and connection status metrics we need to enable the stub_status module. The commercial version, Nginx Plus, provides some additional monitoring metrics, more fine grained connection status reporting or HTTP return code counters via the status module in addition to other features, but we will see later how Sysdig can give you some of that information as well.
The Nginx official Docker image and the binary packages for the most popular Linux distributions already include this module by default.
To confirm that the module is available for the Nginx version you chose just run nginx -V and look for the --with-http_stub_status_module flag:
$ docker exec -ti nginx nginx -V
nginx version: nginx/1.11.13
built by gcc 4.9.2 (Debian 4.9.2-10)
built with OpenSSL 1.0.1t  3 May 2016
TLS SNI support enabled
configure arguments: --prefix=/etc/nginx --sbin-path=/usr/sbin/nginx
...
<b>--with-http_stub_status_module</b>
...
Code language: HTML, XML (xml)
In order to apply the changes required to enable the module you can import the external configuration to the container using a Kubernetes ConfigMap. If you require several customizations you might consider creating your own custom Nginx image too.
Here, we have taken the default nginx.conf file, enabled the module stub_status under /nginx_status and we are also proxying the connections to a wordpress Kubernetes service, this is pretty much what we added:
server {
        server_name _;

        location /nginx_status {
          stub_status on;
          access_log  on;
          allow all;  # REPLACE with your access policy
        }

        location / {
            proxy_pass http://wordpress:5000; # REPLACE with your service name and port
            proxy_set_header Host  $host;
            proxy_set_header X-Real-IP $remote_addr;
            proxy_redirect off;
        }
}
Code language: PHP (php)
(see here the complete nginx.conf file )
To expose this configuration, save it to a file and create the ConfigMap:
$ kubectl create configmap nginxconfig --from-file nginx.conf
Code language: JavaScript (javascript)
You can then launch your Nginx containers in Kubernetes using a Deployment , ReplicaSet or ReplicationController and make them available through a Service :
$ kubectl create -f nginxrc.yaml
(see here the complete nginxrc.yaml file )
Check Nginx status
If you send a request to the configured URL, using curl for example, you should get an output like this:
$ curl nginx-wordpress/nginx_status
Active connections: 6
server accepts handled requests
100956 100956 101022
Reading: 0 Writing: 4 Waiting: 2
It’s a start, but most probably you want more advanced monitoring: historical data, graphs, dashboards, alerts…
Now imagine that you could leverage Kubernetes metadata and labels when you configure all that monitoring. And then, imagine you could get application layer metrics like “Average request time per service” or some information typically found in processed logs like “top HTTP requests” or “slowest HTTP requests”. All together with the Nginx status module metrics. This is where Sysdig Monitor can help.
You can start a Sysdig Monitor free trial and this is how to install the agent using a Kubernetes DaemonSet as explained here. Now let’s see what metrics we can find, how to design graphs using Kubernetes metadata and also how to create the corresponding alerts.
Monitoring Nginx metrics
We are going to review here which metrics are exposed by Nginx, what do they mean and some other related parameters required to understand and monitor Nginx behaviour and performance.
Nginx connections
Nginx provides metrics for the TCP connections that it receives from the clients. HTTP requests and responses go through these TCP connections. In HTTP/1 each request needs one connection but with HTTP/2 it is possible to make multiple requests in one single connection. In order to accelerate requests, these connections are sometimes kept open waiting for further requests from the same client, this is known as Keepalive .
- Network connectivity
nginx.can_connect: Binary value checking the availability of the Nginx service. - Current connections
nginx.net.connections: Total number of active connections. - New connections per second
nginx.net.conn_opened_per_s: Rate of new connections opened per second. Comparing this value with thenginx.net.connectionsabove you can gauge the effective throughput. - Dropped connections per second
nginx.net.conn_dropped_per_s: Rate of connections dropped by the Nginx server. Dropped connections may be caused by invalid client requests, rate limits or other Nginx configuration rules.
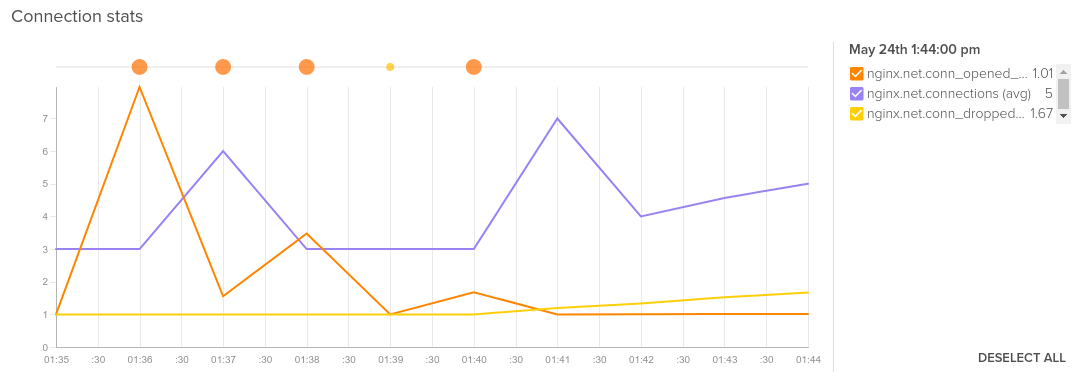
Average of nginx.net.conn_opened_per_s, nginx.net.connections and nginx.net.conn_dropped_per_s.
Nginx request status
Nginx provides a metric that shows the number of HTTP requests performed, therefore we can also get the number of requests per second. Each request goes through different states that you can get displayed as a rate.
- Requests per second
nginx.net.requests_per_s: Rate of processed requests. - Requests in reading state
nginx.net.reading: Nginx is reading the client request (headers). - Requests in waiting state
nginx.net.waiting: Nginx is waiting/idle, may be waiting for the backends to process the response or for the client to close the connection. - Requests in writing state
nginx.net.writing: Nginx is writing the response back to the client.

Average of nginx.net.reading, nginx.net.waiting and nginx.net.writing.
Nginx HTTP application metrics
Nginx+ provides some visibility on HTTP response codes but if we want to further monitor Nginx metrics like request time, we need to enable $request_time in the log module and then calculate that metric through a logging system.
Sysdig Monitor makes this way easier. There is no need to configure a complex setup to calculate metrics from logs. It is done automatically, just by decoding the HTTP protocol extracted from the payloads of read() and write() system calls of file descriptor sockets opened by Nginx. This way, Sysdig can provide you some interesting HTTP protocol application layer information without any kind of code instrumentation:
- Top URLs
net.request.count|net.http.request.countsegmented bynet.http.url: Rate of hits per HTTP URL. Useful to monitor user behaviour, popular resources and to detect anomalous connections. - Slowest URLs
net.http.urlsegmented bynet.http.request.time: URLs that take the most time to complete, on average. These are possible bottlenecks that you need to optimize to gain overall responsiveness. - HTTP response codes
net.http.statusCode: HTTP response codes provide a lot of meaningful information about your backends health, will be further detailed in this section. - Service request time, both average (
net.request.time|net.http.request.timesegmented bykubernetes.service.name).
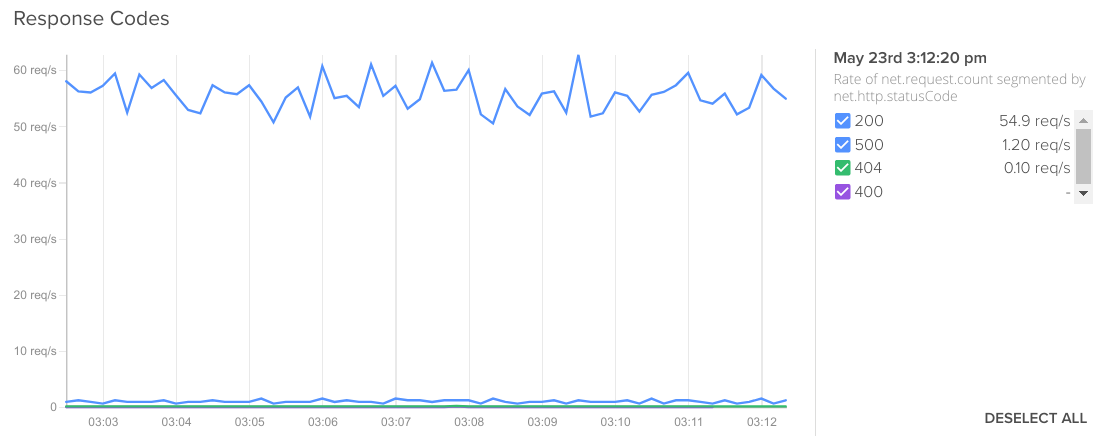
Rate of net.request.count segmented by net.http.statusCode.
This table summarizes the metrics and where they come from:
| Source | |||
|---|---|---|---|
| Metric | Nginx stub_status module | Nginx+ status module | Logs / APM / Sysdig visibility |
| accepts | ✔ | ✔ (accepted) | ✔ |
| handled | ✔ | ✔ | ✔ |
| dropped | ✔ (calculated) | ✔ | ✔ |
| active | ✔ (includes waiting) | ✔ (excludes waiting) | ✔ |
| waiting | ✔ | ✔ (idle) | ✔ |
| reading | ✔ | ✔ | ✔ |
| writing | ✔ | ✔ | ✔ |
| requests | ✔ | ✔ (total) | ✔ |
| 4xx codes | ✔ | ✔ | |
| 5xx codes | ✔ | ✔ | |
| request time | ✔ |
System and resource metrics for Nginx
In addition, we shouldn’t forget about monitoring the system resources that Nginx needs to perform properly:
- Percentage of used CPU
cpu.used.percent. - Load average,
load.average.percpu.1m, 5m, 15mmatching the usual load measurement periods. - Memory used both in absolute terms
memory.bytes.used(although it is named ‘bytes’ the graph will adjust to the best human readable scale like Mega or Giga) or percentagememory.used.percent. - IOPS total
file.iops.total. For example, if you are using a local content cache. - Network bytes activity
net.bytes.total,net.bytes.in,net.bytes.out, useful to know when are you going to reach net limits and need to scale up. - Net error count
net.error.countconnectivity problems, not to be confused with the HTTP-level error codes.
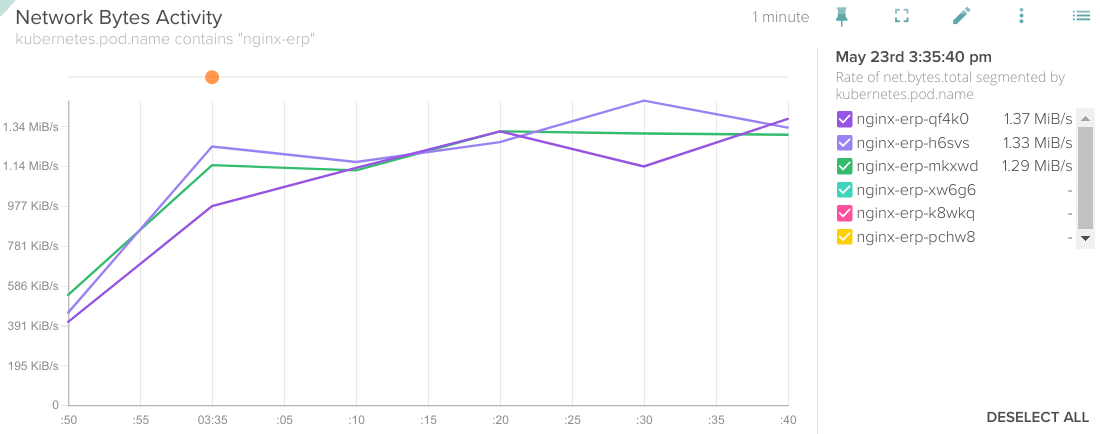
Rate of net.bytes.total segmented by kubernetes.pod.name.
OK, so now that we have discussed the most important metrics, let’s see how you can visualize and work with them. How to monitor #Nginx, bringing service and application metrics without code instrumentation Click to tweet
Nginx Dashboards
You can create an Nginx dashboard on the Dashboards tab, ADD DASHBOARD and scroll down or search for ‘nginx’ template. Using Scope you can limit the visualization to any Kubernetes entity like a node, a namespace, a Service or a Deployment, even something like an AWS region, that’s possible too!
Once the dashboard has been created you can customize it: add or remove graphs, change the scope or segmentation of each graph, see events on the graphs, resize them, etc.
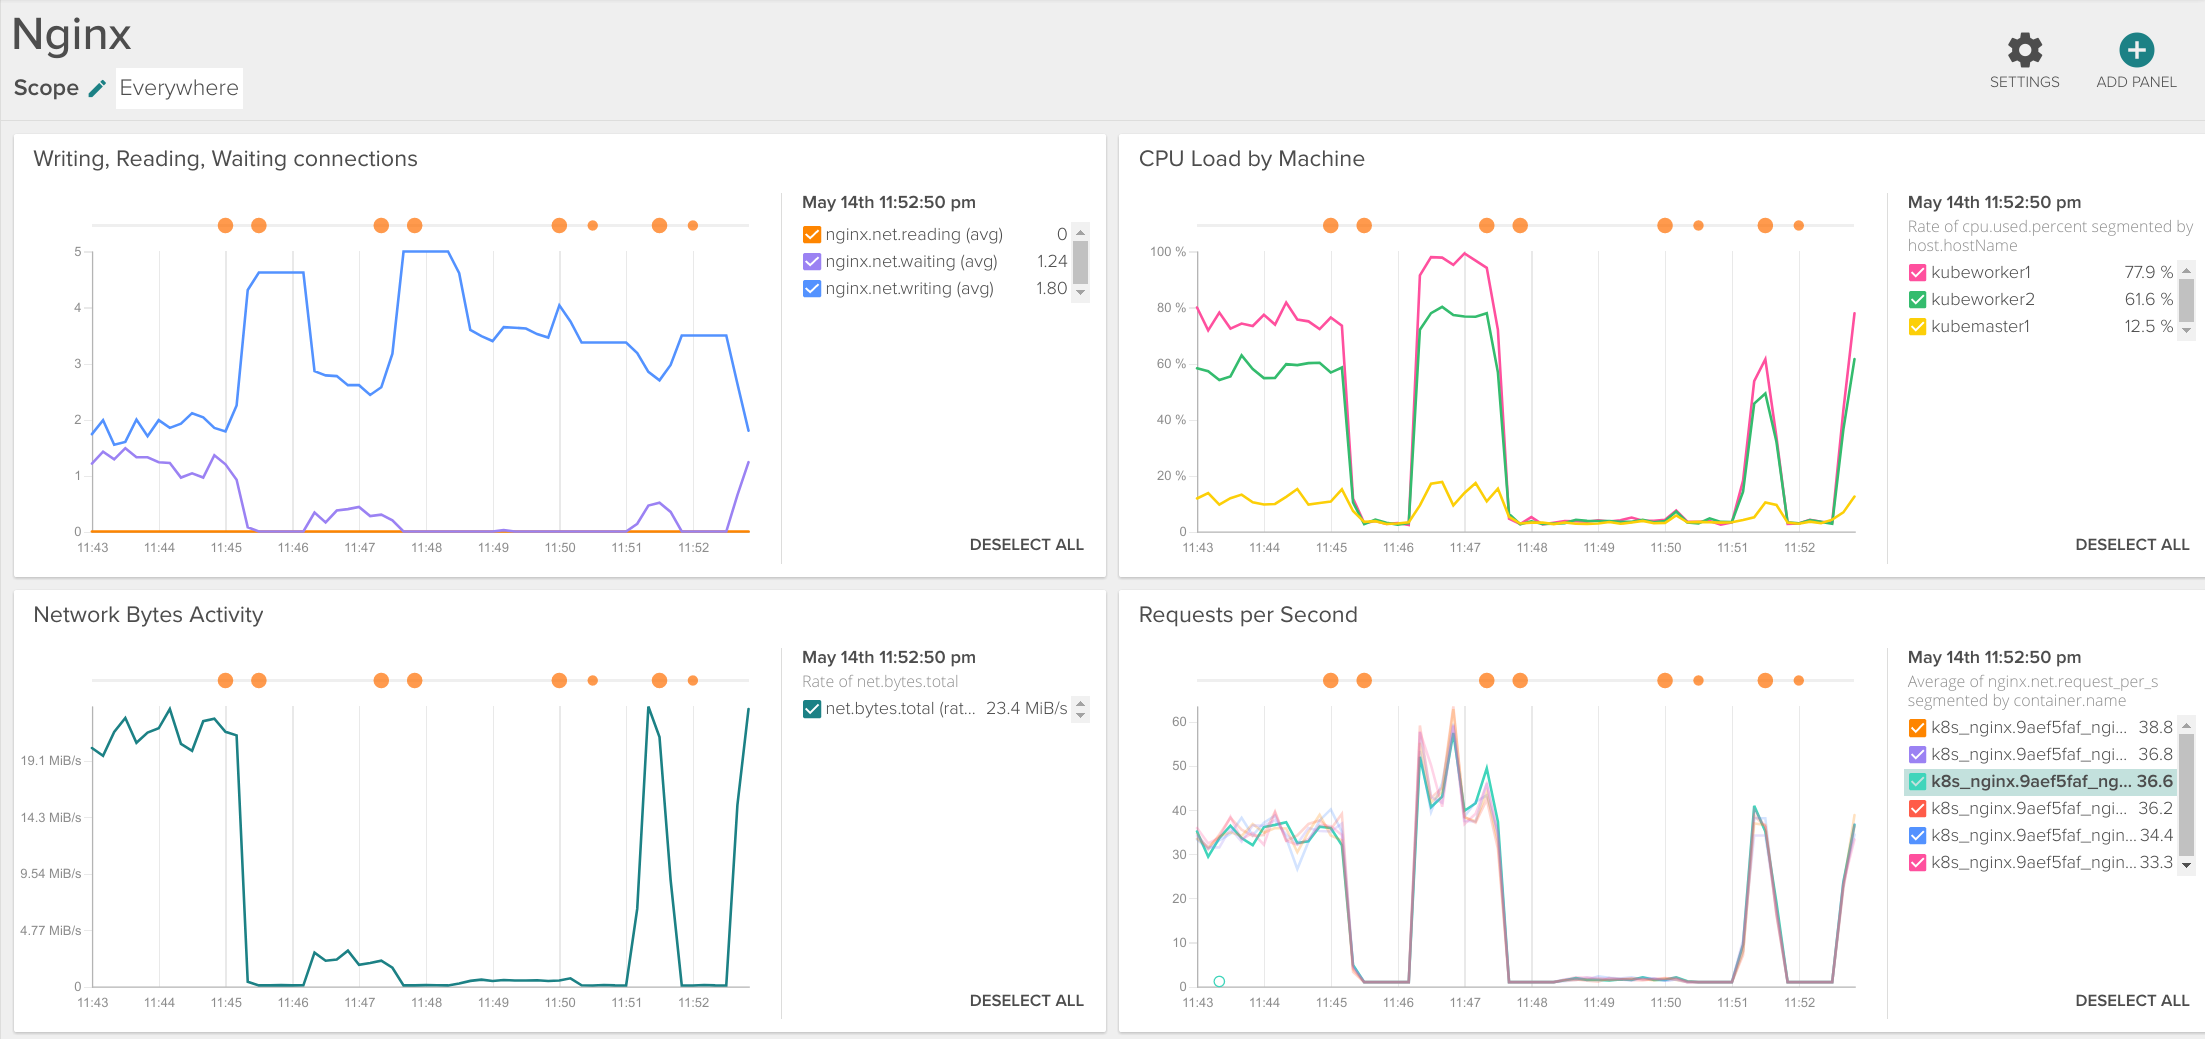
The default dashboard includes: connection status (writing, reading, waiting), CPU load, network traffic, requests per second, top URLs, slowest URLs, active connections, dropped connections and response codes.

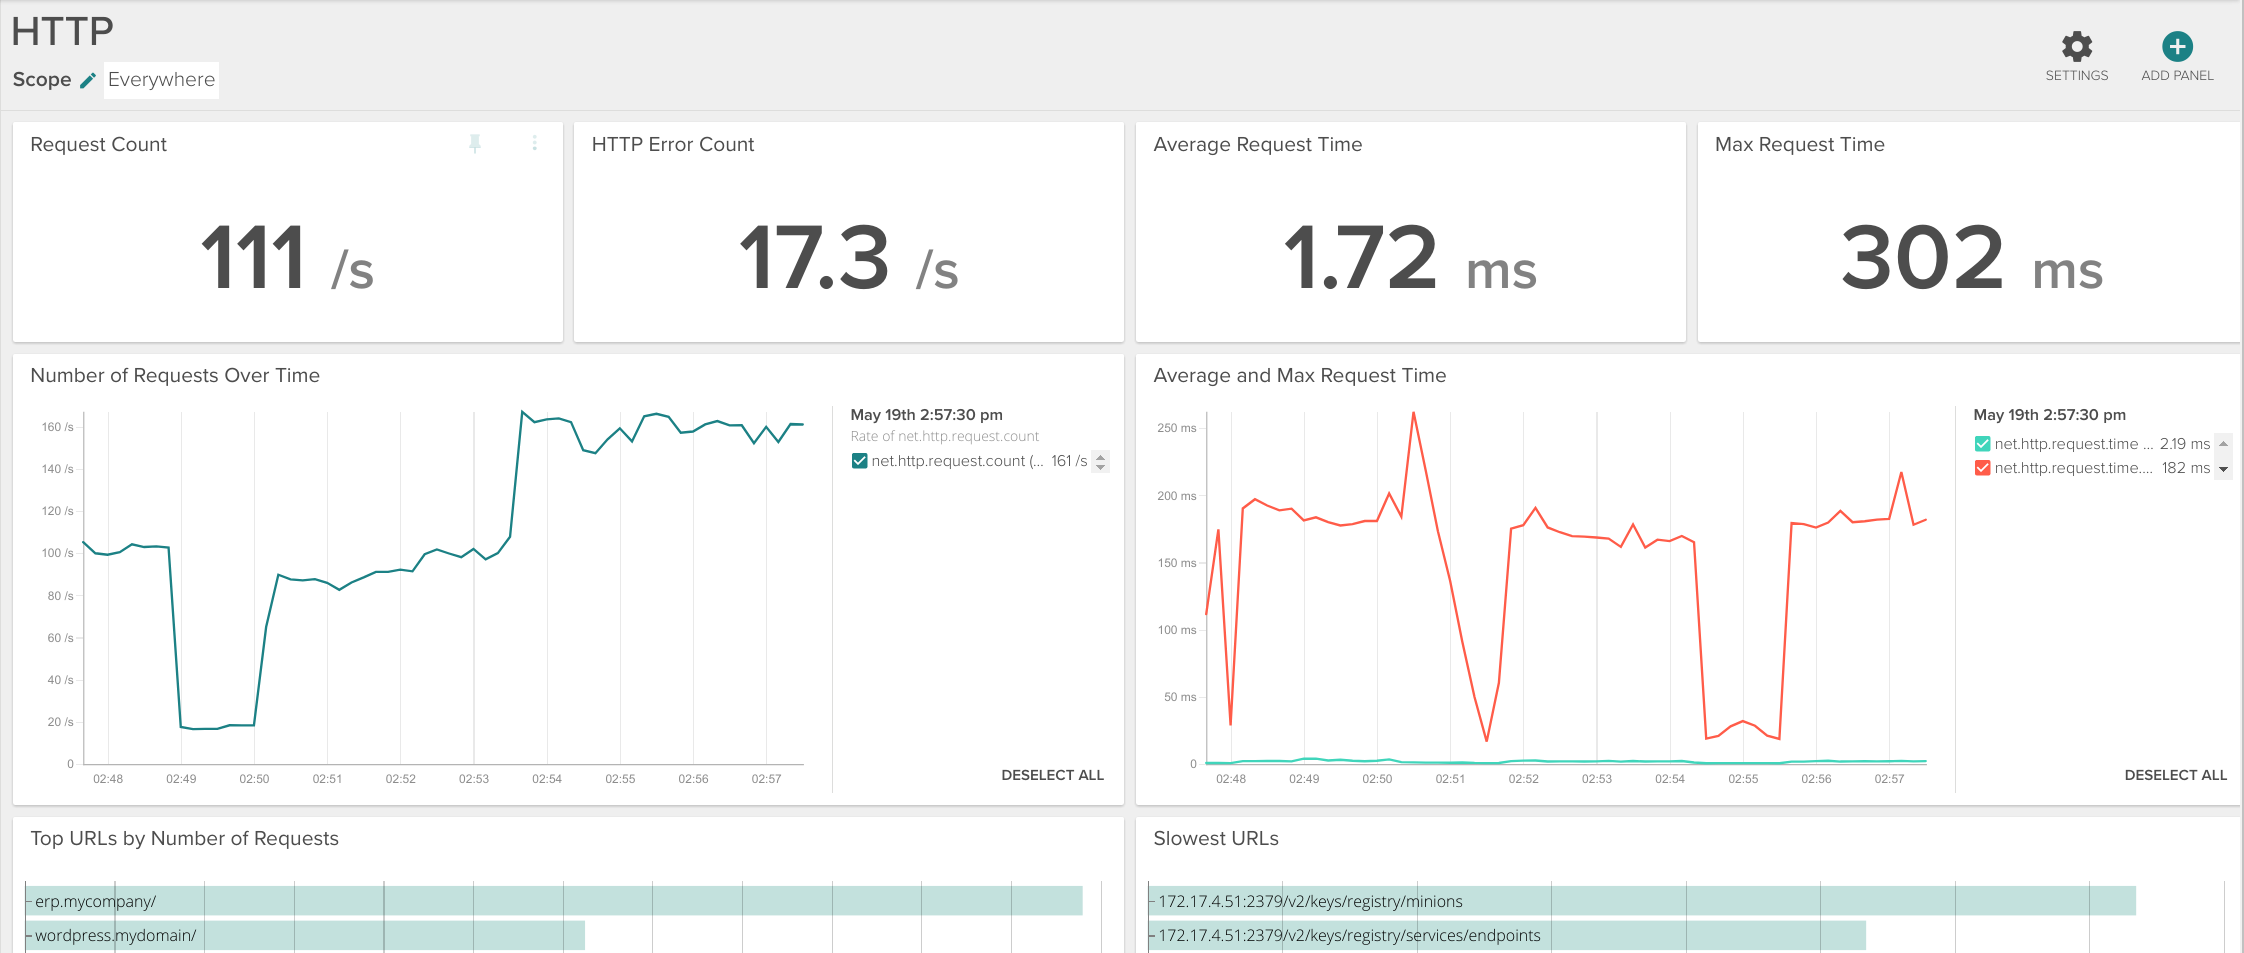
The HTTP dashboard template includes some more application layer metrics like: average request time, maximum request time, or requests type (GET, POST, etc). You could merge the metrics that are more interesting for you into a single panel using the Copy Panel icon and grouping them into a different dashboard.
In a more dynamic fashion, similar views to these dashboards are available in the Explore tab, just select the scope that you want to visualize and apply the Nginx view, HTTP view or HTTP Top Requests view.
Using Kubernetes labels in graphs to monitor Nginx
When using microservices in orchestration platforms like Kubernetes you need to monitor Nginx metrics both at the service level but also individually per container or per pod. Kubernetes metadata such as labels are very helpful for this, but using Sysdig you can use any of the available metadata to do this kind of segmentation, either from Kubernetes, Docker or any cloud provider like AWS (think of showing a metric segmented by availability zone).
Segmentation by Kubernetes Namespace
For example, let’s assume that you have three different Kubernetes namespaces to completely separate the development , staging and production environments. Now you want to know how many requests per second each environment is receiving, so we can segment by kubernetes.namespace.name:
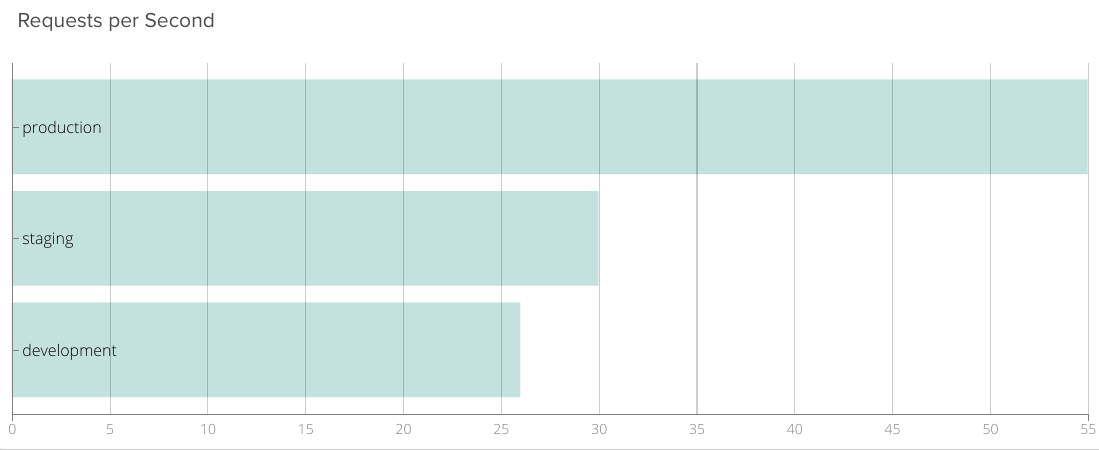
Average of nginx.net.request_per_s segmented by kubernetes.namespace.name.
A similar example could be that, as part of your CI/CD pipeline, you need to have a real time benchmark comparing your current production code and ‘N+1 staging’ code.
Let’s compare again processed requests per second, replaying real traffic to the staging environment:
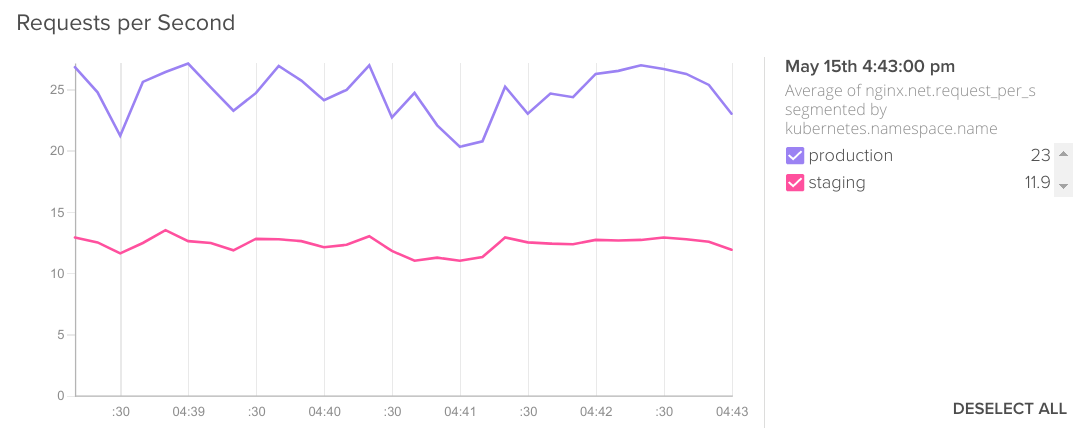
Average of nginx.net.request_per_s segmented by kubernetes.namespace.name.
Doing the same kind of segmentation on the metric that shows HTTP error responses would also be interesting for this scenario:
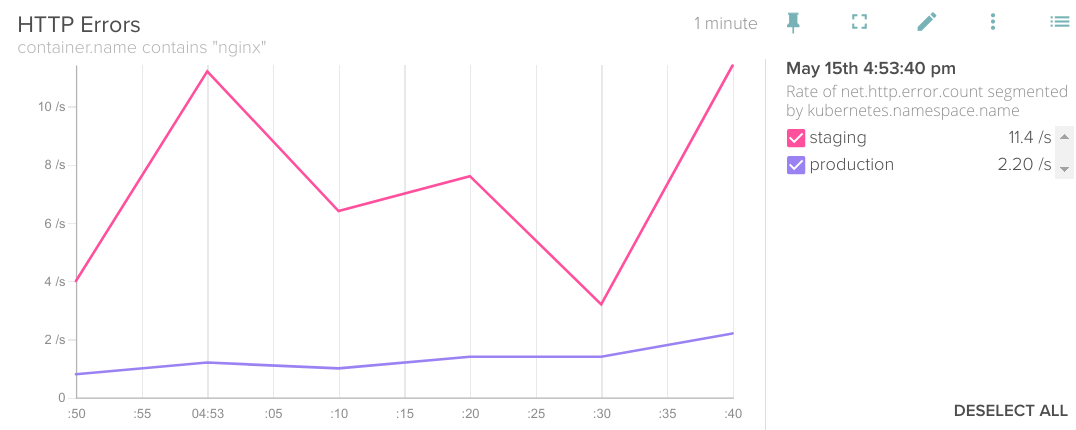
Rate of net.http.error.count segmented by kubernetes.namespace.name.
Oops! looks like there are some unresolved issues in our staging code, we cannot move it to production.
Segmentation by Kubernetes Service
One of the most wished-for features when using microservices is being able to monitor each of the services that build up the entire user-facing application. Usually we want to find which is the slowest microservice: who is the bottleneck?
In our case, we use a separate ReplicationController per service, this way we can easily segment the HTTP requests. Typically you can use here kubernetes.replicationController.name or kubernetes.service.name tags to segment any metric in the time series graph.
You want to know which of your services needs more bandwidth:
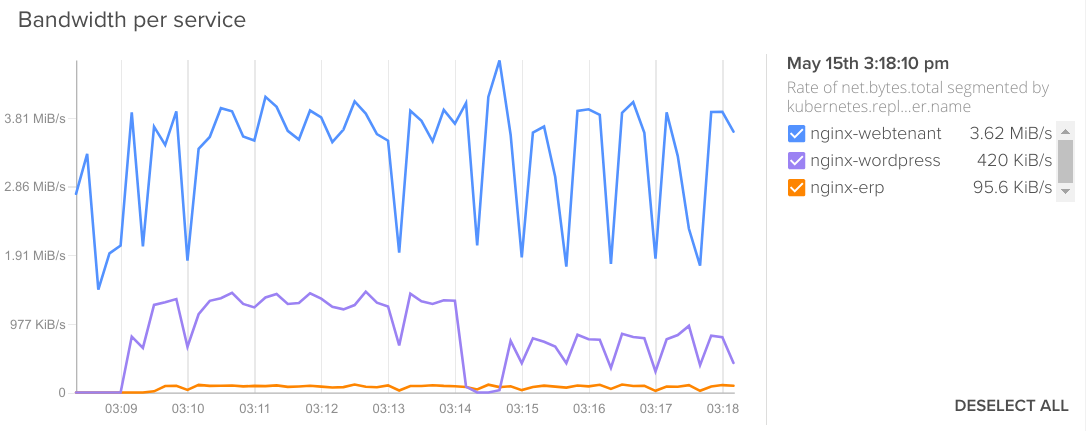
Rate of net.bytes.total segmented by kubernetes.replicationController.name.
Or receives most requests per second:
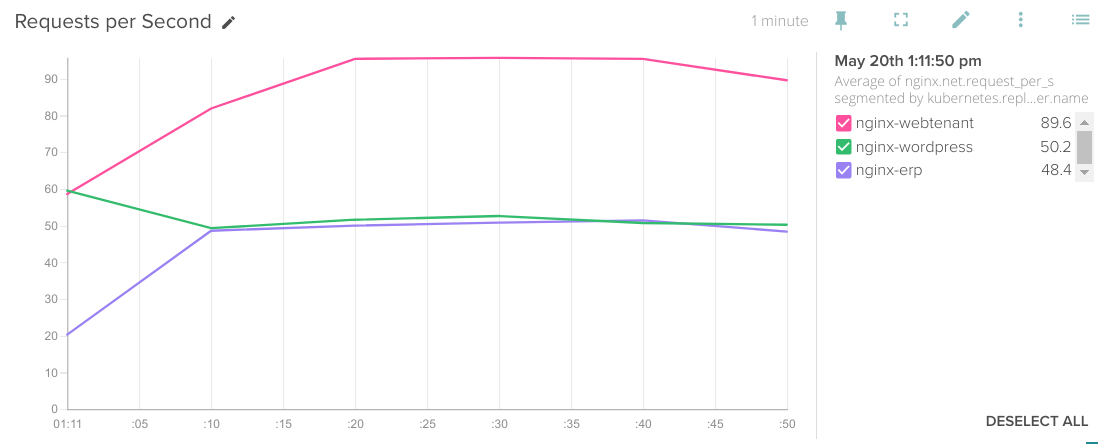
Rate of nginx.net.request_per_s segmented by kubernetes.replicationController.name.
Another common use case is that you want to know which service takes more time to process user requests. Again, Sysdig transparent metric collection allows you to see response times for each microservice without any kind of code instrumentation or ‘sidecar monitoring container’ adding complexity to your pods. This is probably the most useful troubleshooting first step to find out what’s going on within a microservices application.
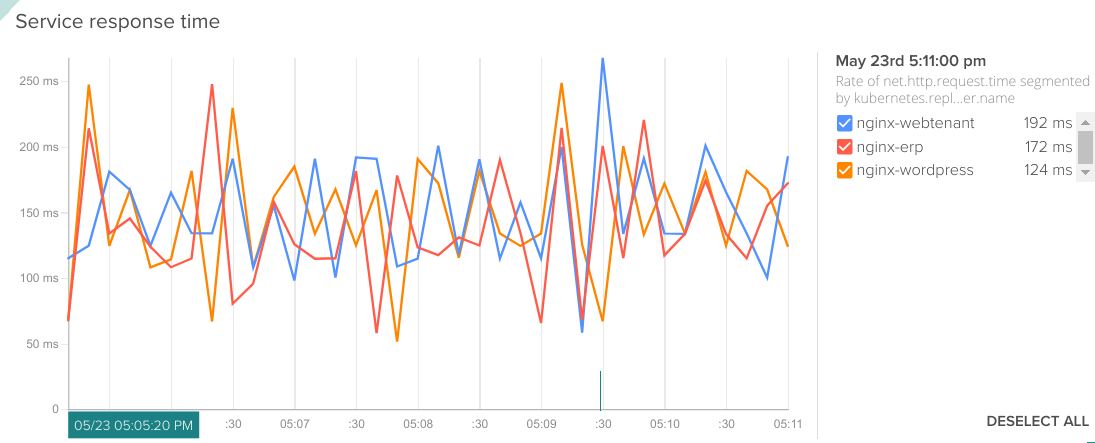
Rate of net.http.request.time segmented by kubernetes.replicationController.name.
Or, you noticed there were some issues using your services at one specific point in time and want to check HTTP errors per service:
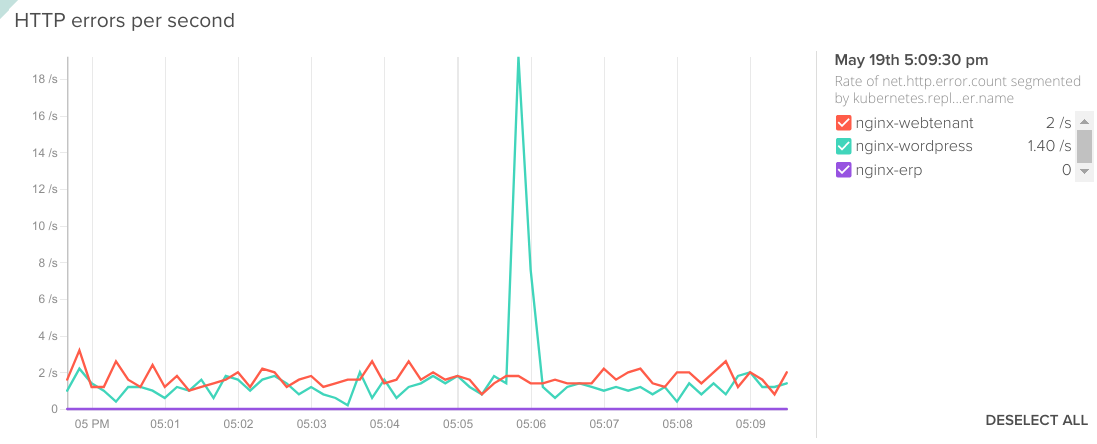
Rate of net.http.error.count segmented by kubernetes.replicationController.name.
Segmentation by Kubernetes Pod
Want a separate graph line per container? just segment by pod.name.
Segment by host.hostName => Segment by pod.name.
This is especially interesting when you are looking exactly which container is not behaving as it should compared with the rest of containers in your service. You can also easily create a board to assess the individual performance of your Nginx pods:
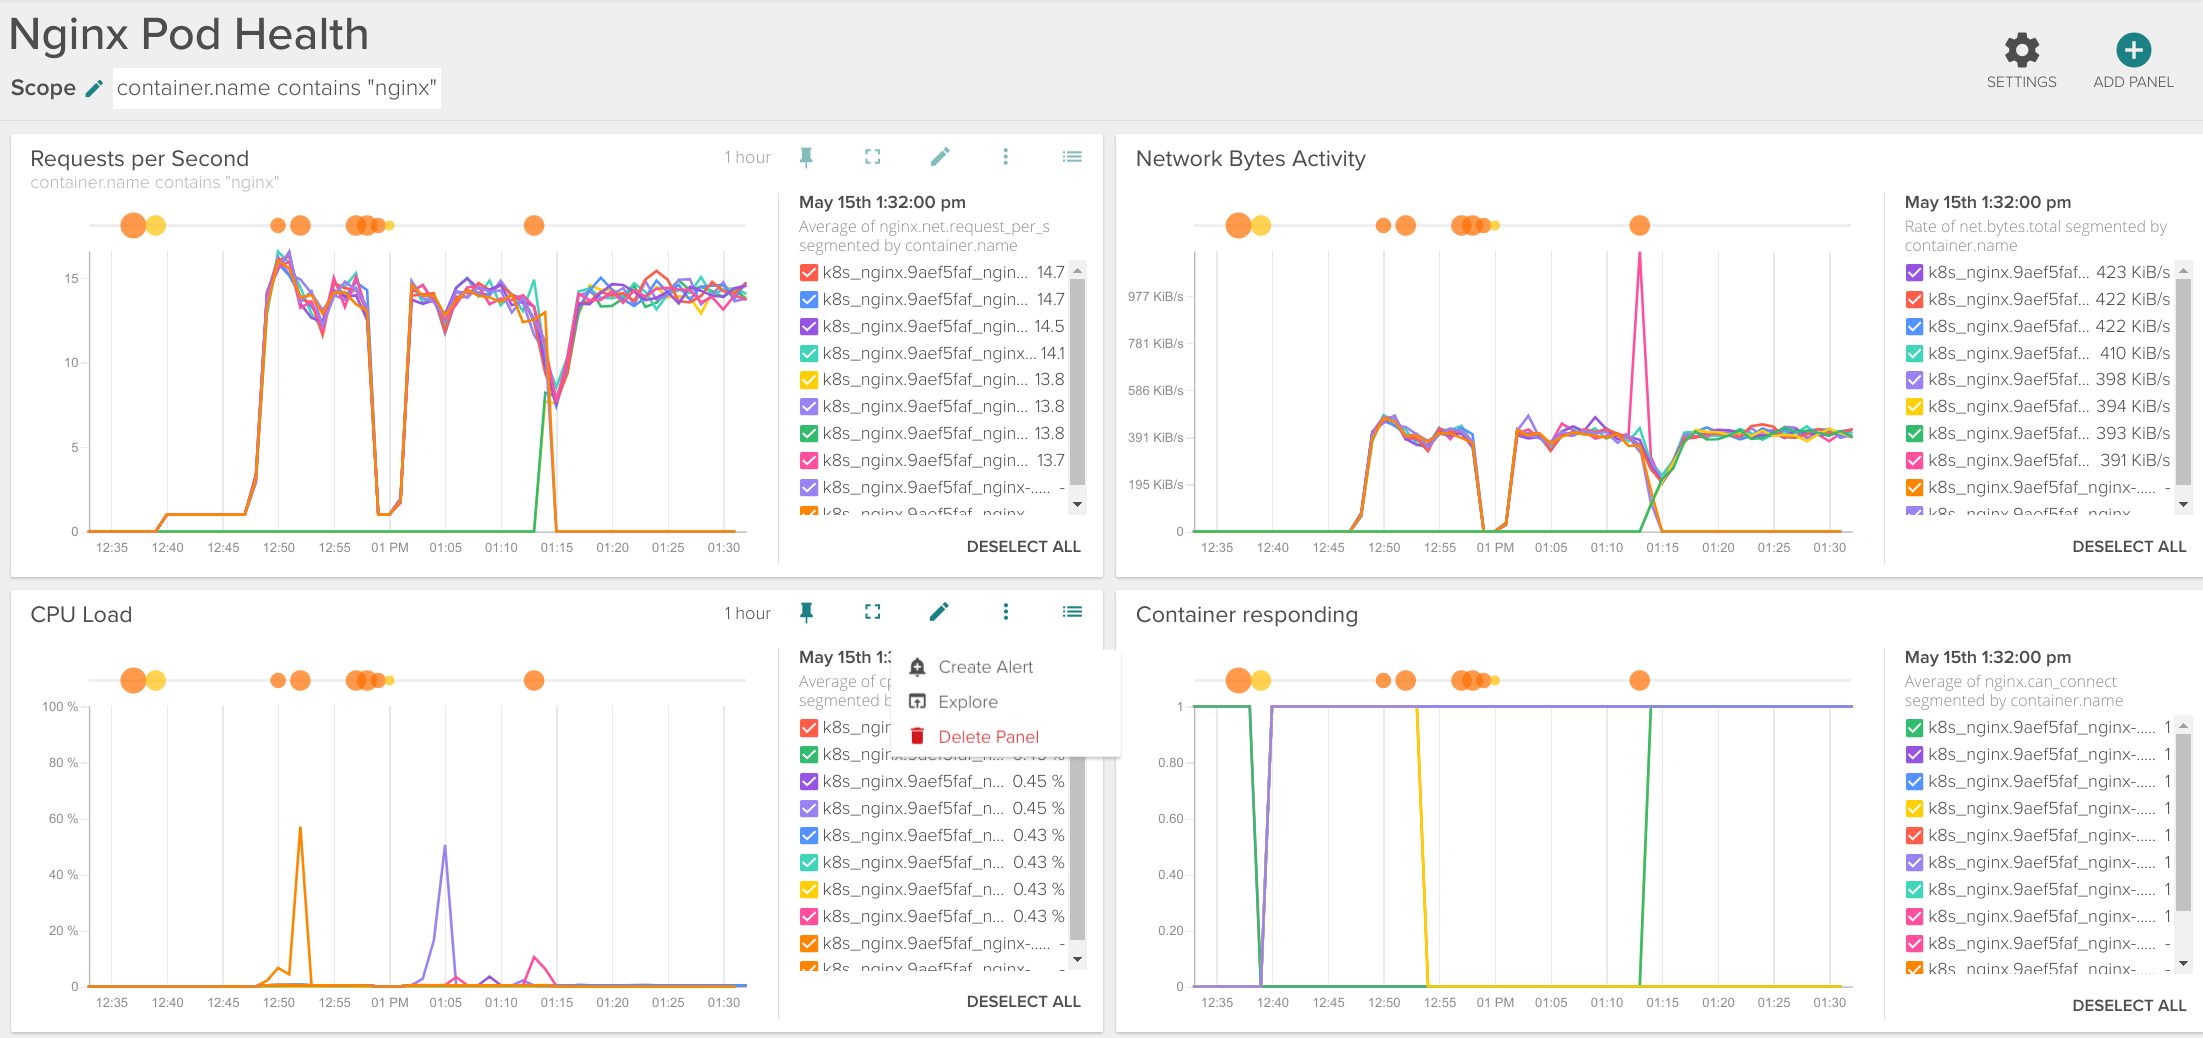
Segmentation by HTTP response code and HTTP method
We have mentioned before how interesting is being able to use Nginx metrics, coupled with application metrics like response time, HTTP URL, response code or HTTP method.
Monitoring the HTTP methods (POST, GET, PUT, PATCH, DELETE…) can be really useful to audit how the clients are using your REST APIs.
The HTTP response codes reveal a lot of information on what’s going on with your application or API. You should look not only for the famous 404 Not Found or 500 Internal Server Error , there are also other meaningful errors like disallowed methods, bad gateway or gateway timeouts:
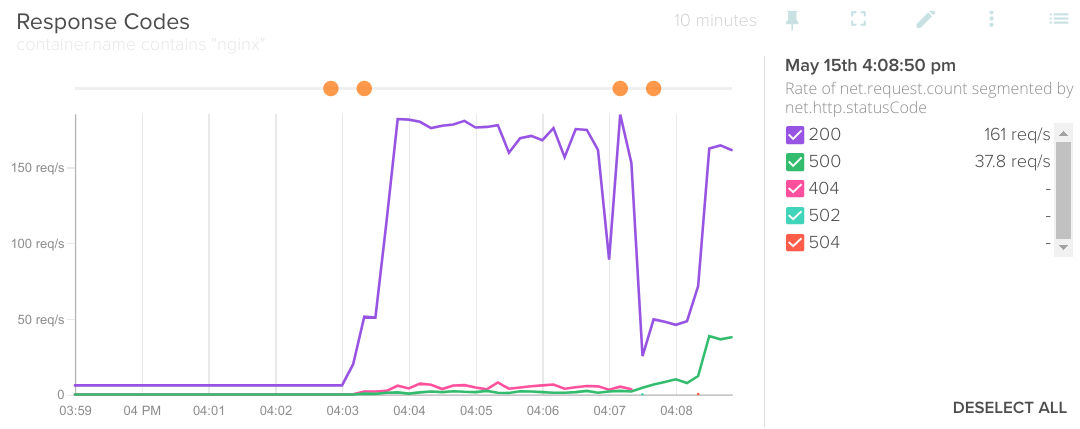
Rate of net.request.count segmented by net.http.statusCode.
As you might have guessed already, it is probably a good idea to set an alert if the monitor is detecting too many 4xx 5xx error codes.
Nginx Plus
Nginx Plus (or Nginx+) is the commercial version of the Nginx server. It builds several enterprise features on top of the opensource version like health-checks, advanced load balancing, clustering, multimedia extensions and, specifically related with the context of this article, additional metrics.
This version also features its own management dashboard:
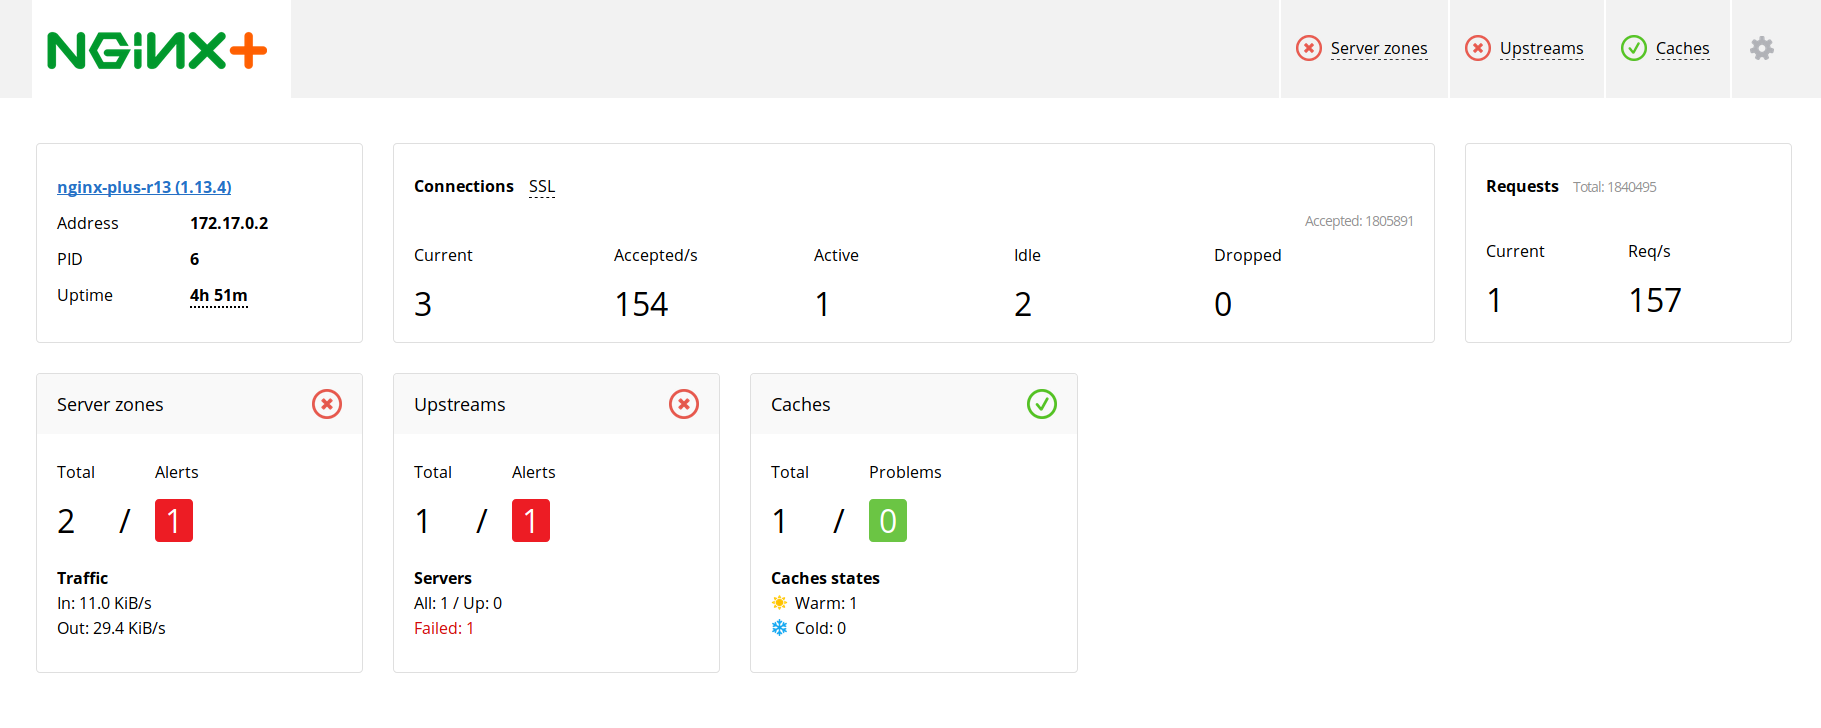
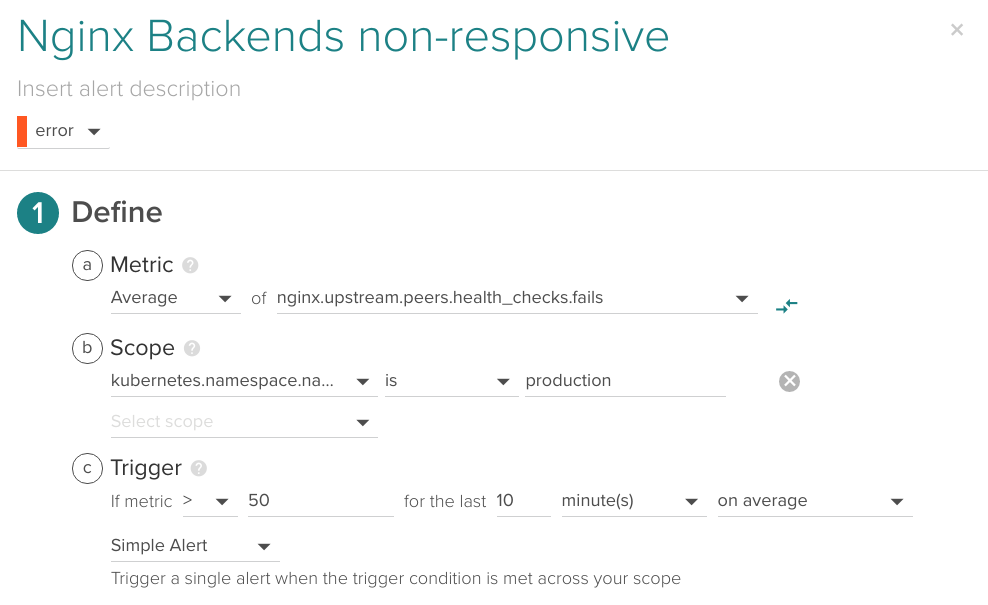
Of course, you can integrate Nginx Plus with Sysdig Monitor and take advantage of all these extra metrics combining them with container visibility and orchestration context. For example, you can fire an alarm when the nginx.upstream.peers.health_checks.unhealthy goes above certain threshold for the production kubernetes.namespace.name
For Nginx Plus to work with Sysdig, you first need to expose the status endpoint. For this example we are going to add a separate metrics virtualhost:
Port 8080 url <yourdomain>/status will publish the raw JSON metrics (you can actually display them in your browser but it’s not suited for human consumption). If you access <yourdomain>/status.html you will be able to see the dashboard we mentioned above.
Once you have enabled the status endpoint, you need to make the Sysdig agent aware of it. Edit the /opt/draios/etc/dragent.yaml additional configuration file. For this example we are going to add the following section:
This configuration YAML file will merge with the default agent configuration. You have more information on customizing your Sysdig agent here.
Restart the agent:
sudo service dragent restart
And voila! you should start receiving the Nginx Plus-specific metrics in your Sysdig Monitor interface right away.
Some interesting metrics:
- Server Zone metrics (i.e.
nginx.server_zone.responses.total), connections between the end client and the Nginx front servers. - Upstream metrics (i.e.
nginx.upstream.peers.active), to monitor connection between the Nginx front servers and web backends.- Upstream health checks (i.e.
nginx.upstream.peers.health_checks.fails)
- Upstream health checks (i.e.
- SSL handshake information (i.e.
nginx.ssl.session_reuses). - Extended connections metrics like dropped connections
nginx.connections.dropped. - Total number of abnormally terminated and respawned Nginx child processes
nginx.processes.respawned.
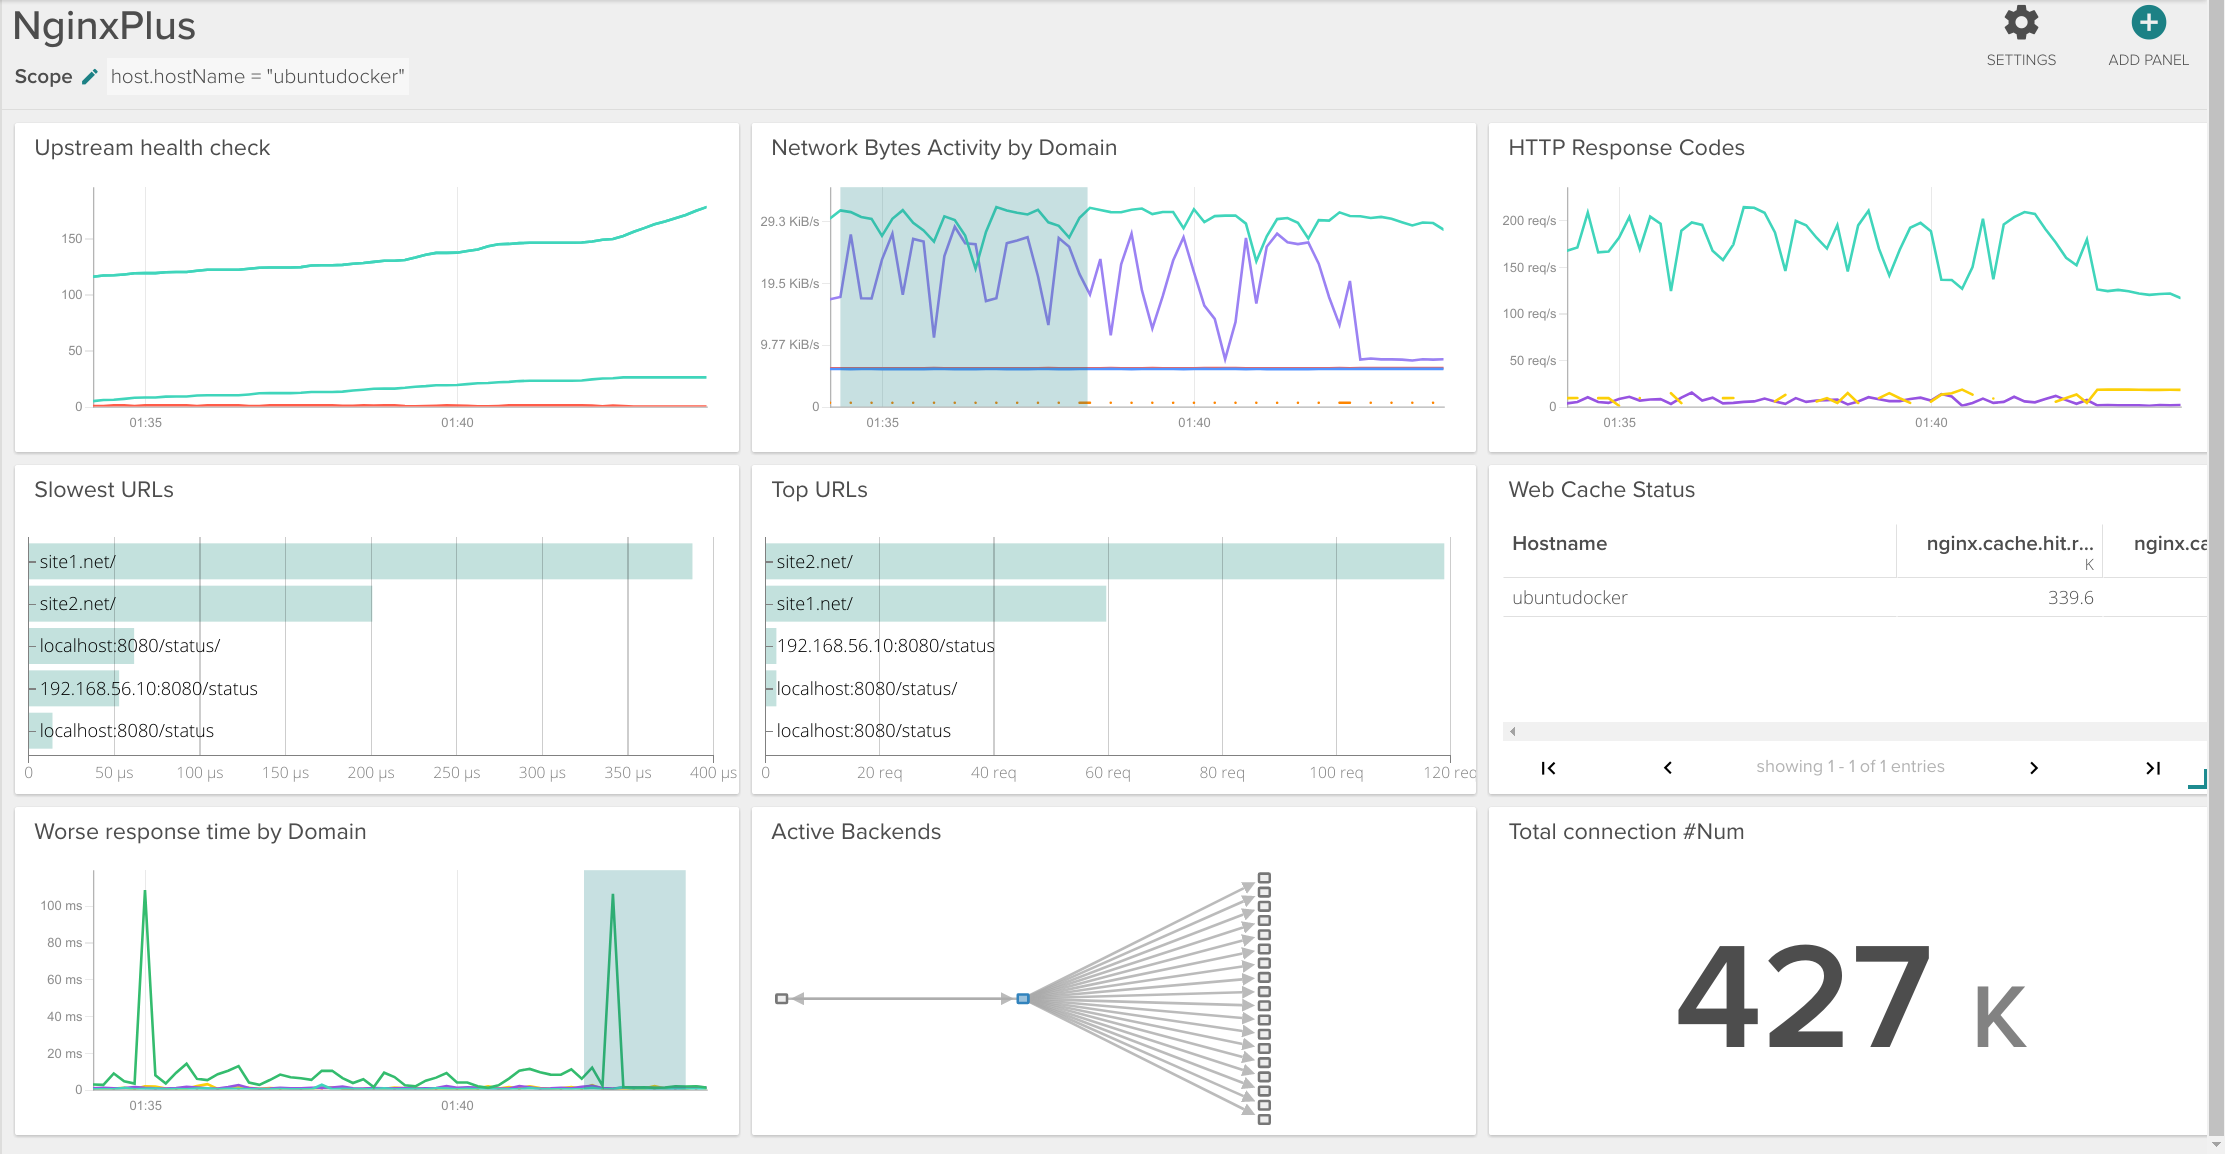
This is an example Nginx Plus dashboard using some of those metrics:
Conclusions
Nginx is a powerhouse of the cloud. Its flexibility and conciseness means that is easy to do simple deployments and affordable to do more complex ones. It is also so light on resources you probably don’t have to think twice about deploying a lot of replicas to ensure high availability.
Nginx servers are usually in a privileged position inside your infrastructure to analyze service responsiveness, detect bottlenecks and predict backend failures, don’t miss the opportunity to make the best of this information. Sysdig can monitor Nginx metrics with application layer metrics like service response time, HTTP methods, response code and top or slowest URls, providing a complete visibility of your Nginx and related microservices without doing any kind of code instrumentation, just looking at the system calls!
Enjoyed this? Move into the second part of How to monitor Nginx on Kubernetes: Metrics alerts, where you will learn Nginx alert configuration matching the common failure points and the use cases we described on this article.