
Sysdig hearts (can I emoji here?) monitoring Azure Container Service just as much Amazon or other public cloud providers… and we can prove it to you!
Azure has made leaps and bounds progress in terms of container and container orchestration support. This blog post will show you some great things you can do with Sysdig and monitoring Azure in terms of giving you a full picture of your container or micro service based applications.
Azure container and orchestrator setup
Create your container service in azure with your favorite orchestrator (Sysdig support(s) all 3 of them). (great article for the step by step: docs.microsoft.com/en-us/azure/container-service/container-service-deployment
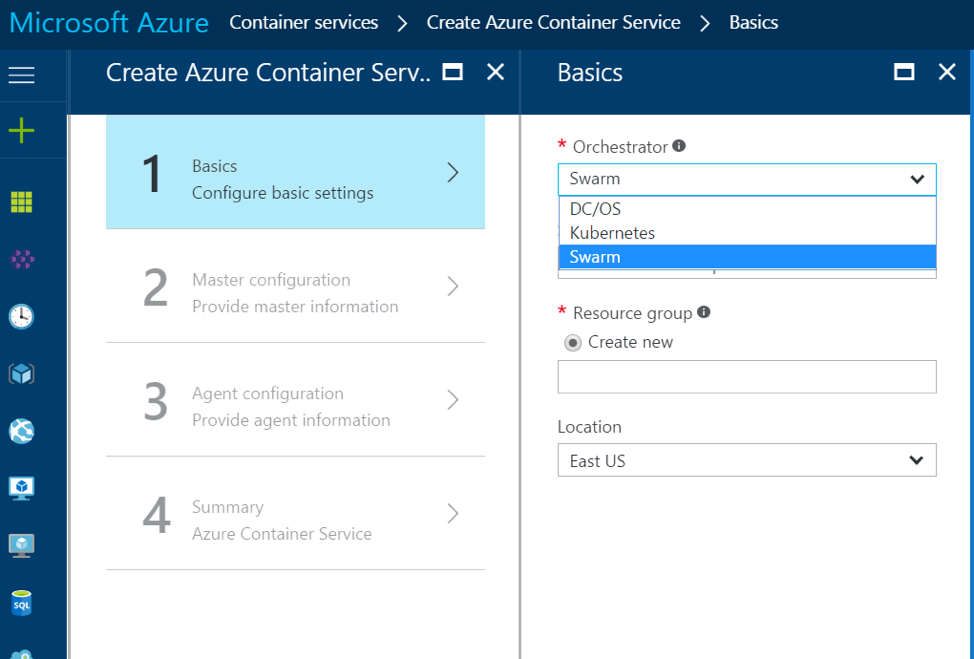
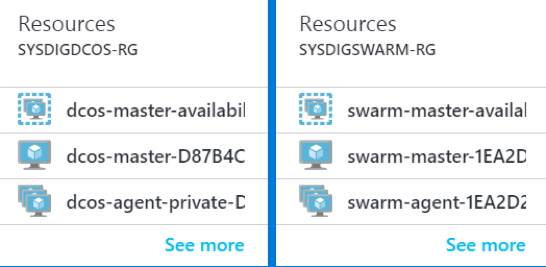
The concept of a resource group is a good one it groups your resources in easy to find “buckets” for deploying and troubleshooting and overall ease of use vs the independent method in Azure Portal Classic and other public cloud UI’s beyond creating automation scripts. I created (2) Azure Container Services, using Docker Swarm and DC/OS Mesosphere as my orchestrators. Azure’s quickstart templates can also be saved as JSON files for this process to be recreated or modified quickly.
For this exercise, I created a DCOS and Docker Swarm Instance. Kubernetes is also supported by Azure Container Services.
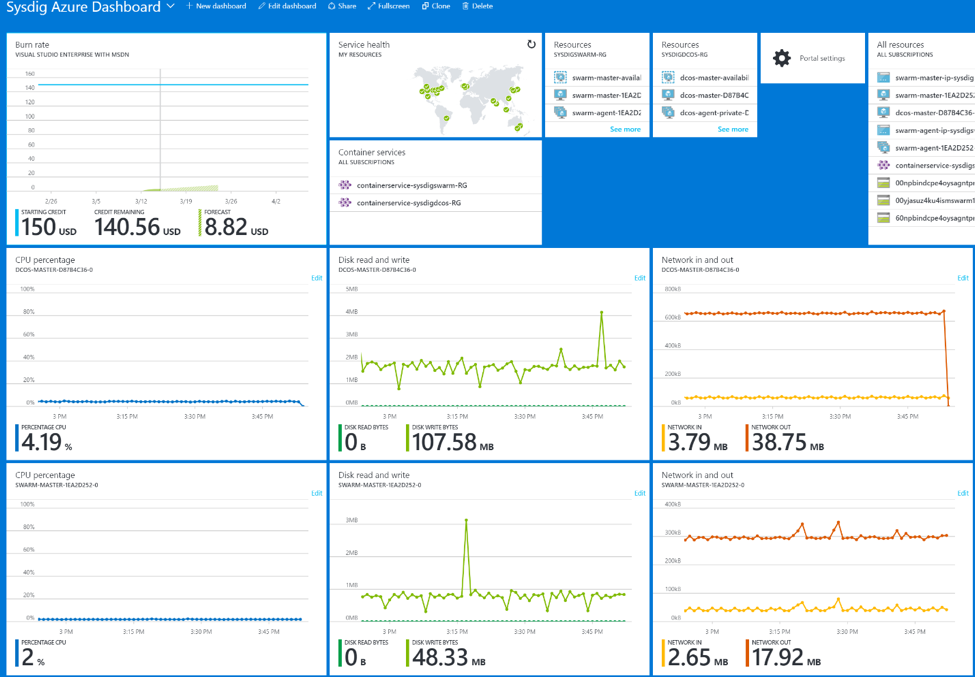
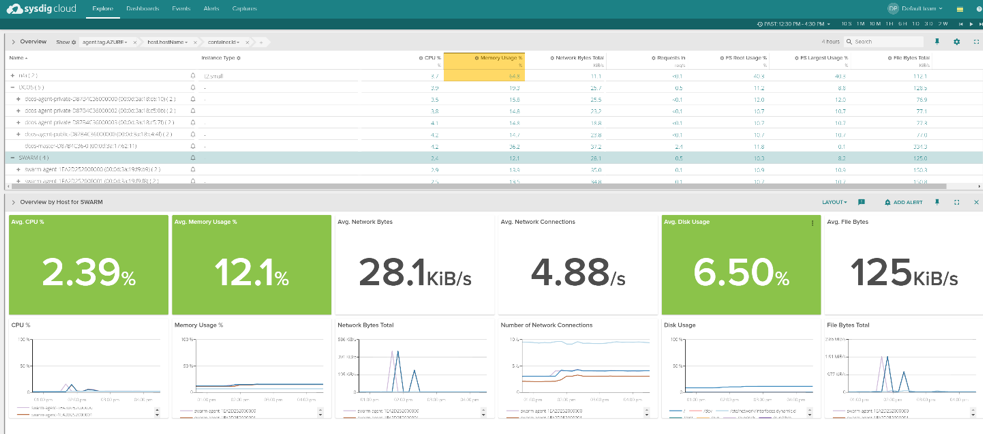
Here is a high level CPU/Disk Read and Write/Network Azure infrastructure based dashboard of the docker swarm and DCOS masters. Azure’s dashboarding/metrics does a great job of showing me my azure services and infrastructure, along with resource groups and billing.
Deep container monitoring for Azure
What if I really want to get in depth details about monitoring my microservices? Maybe I want to see how my individual containers or microservices are interacting. Perhaps I even want to see http request/response, network connectivity between the containers, and how my front end web services are communicating with backend data services? Top connections/ports connecting to my containers? Maybe I want container CPU shares, Memory, or Disk space on my service along with my overall Azure Container Service.. How would I get more in depth microservices/container visibility within Azure?
That’s where Sysdig comes in and can help you. Sysdig is the container monitoring specialist. We focus on the complex task of seeing inside containers, and then relating that information to your orchestrator and your cloud in real-time. With that, let’s put Sysdig to work on monitoring Azure.
The Sysdig steps for setting up Azure monitoring
For Docker
All you have to do is deploy the sysdig monitoring agent into your cluster – no setup or configuration needed.. see specific instructions here.. https://support.sysdigcloud.com/hc/en-us/articles/204498905-Sysdig-Install-Standard-Linux-Docker-CoreOS- ****
For Kubernetes
We can deploy our agent via daemonset. Microsoft has documentation on the steps to accomplish this: https://docs.microsoft.com/en-us/azure/container-service/container-service-kubernetes-sysdig ****
For Mesosphere
You would install the agent on your master instances with the instructions above, and then deploy the agent via our Universe deployment, here are the steps straight from Microsoft on the topic https://docs.microsoft.com/en-us/azure/container-service/container-service-monitoring-sysdig
Done… That’s it.
Sysdig will then automatically collect metadata and other goodies from the Orchestrator of your choice and then help you organize and group your applications for your teams to monitor (container or microservices) in a more holistic way. Sysdig’s magic is, with this simple instrumentation method, you can even see what your applications are doing inside your containers.
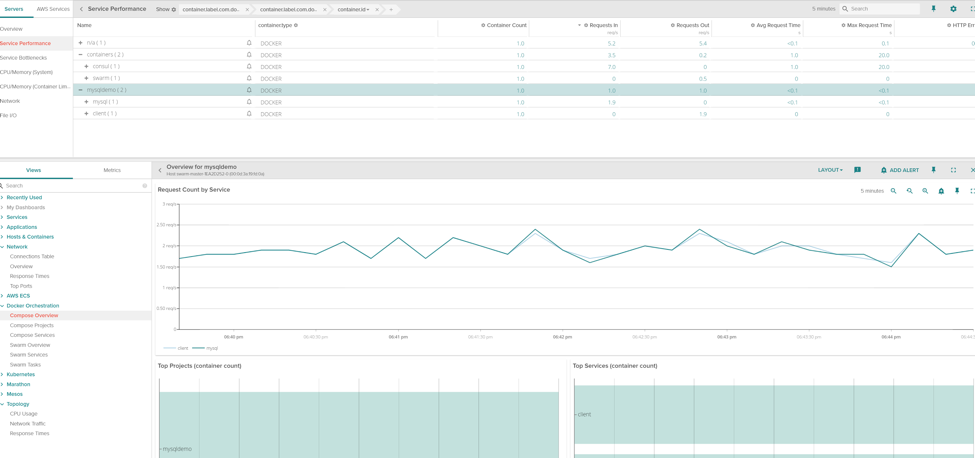
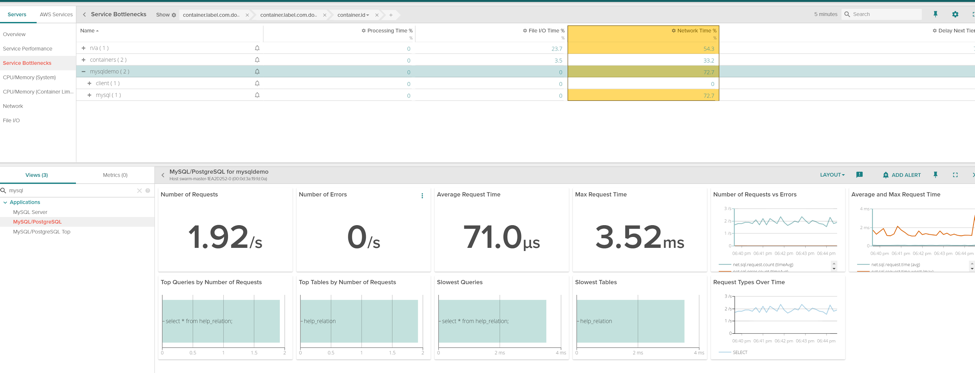
Here is a service performance of a simple MySQL Demo docker compose service running on my Azure Container Services Docker Swarm cluster.
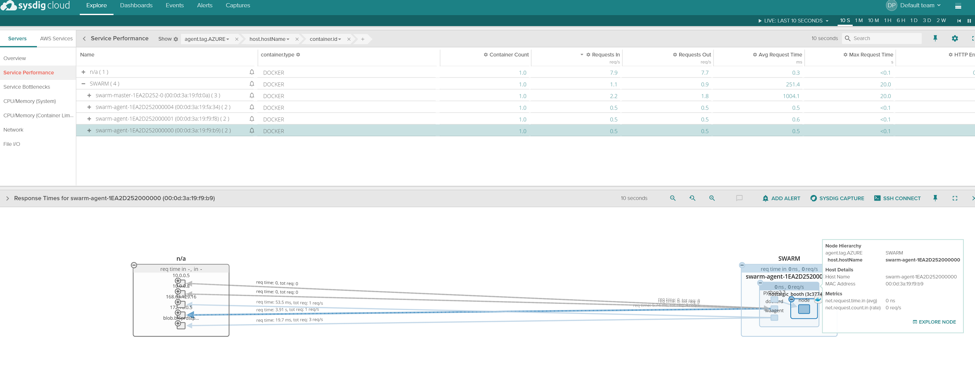
Here is a topology view of response times for your services running in your docker swarm cluster.
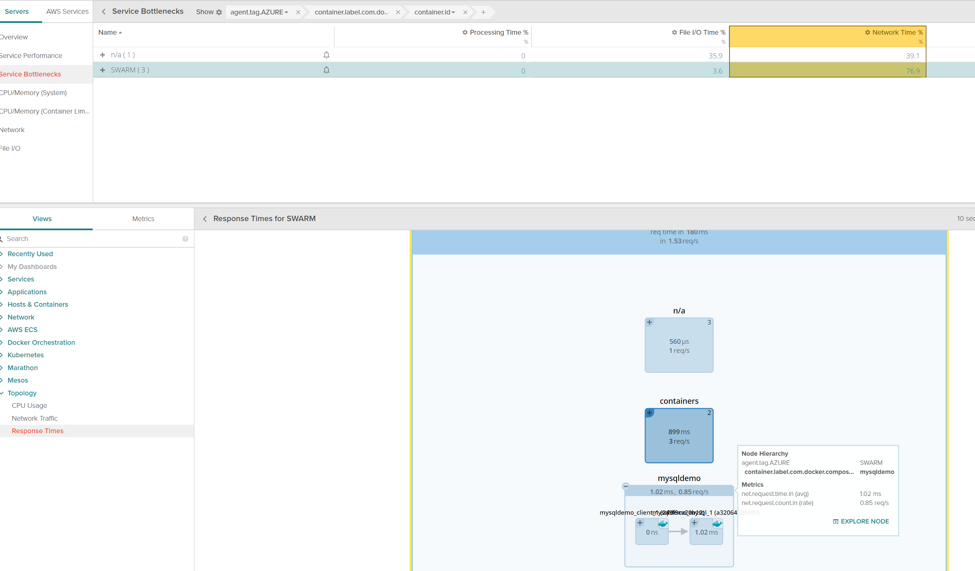
Here’s the MySQL Demo service with a client communicating with a backend MySQL server. We are showing service bottleneck details and response times.
We are even getting my service’s MySQL(and many other application integrations) without installing an agent directly into my container)
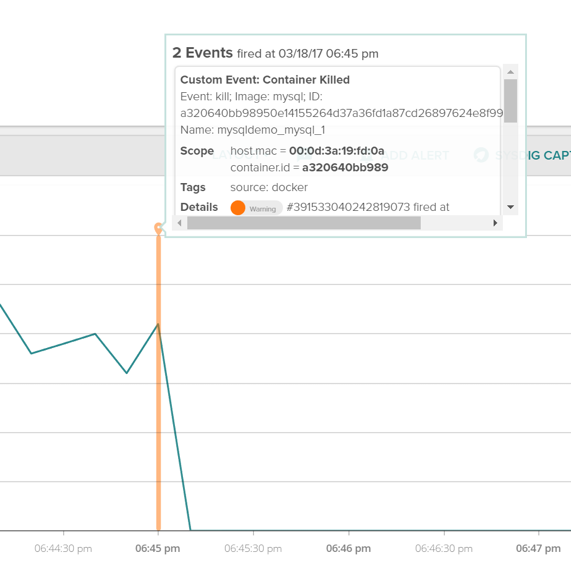
Sysdig even captures event data if one of your containers goes down right from the Orchestrator… we make your Azure container service even more fantastic.
How does Sysdig do it?
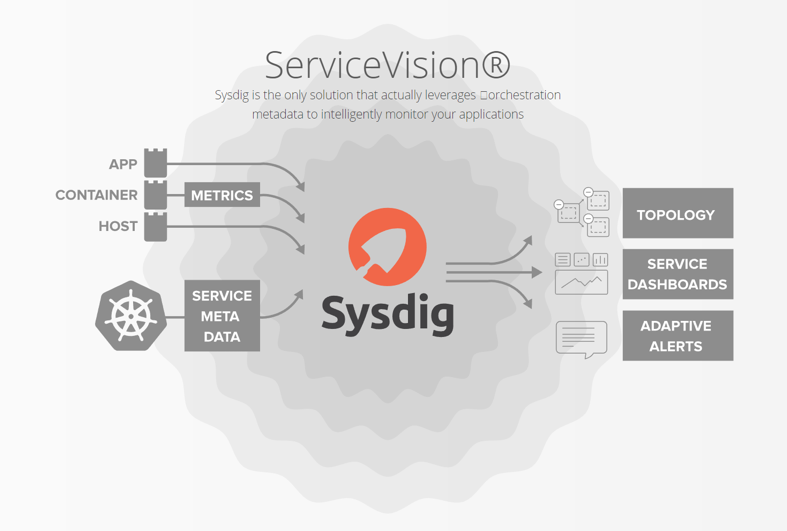
Container and Service Vision that’s how! We automatically find and poll your orchestrator for metadata about your deployment. This allows us to then aggregate your monitoring data on-the-fly to give you smarter, microservice-based views of your resources, instead of just physical host/ip/container views.We were also built to understand microservices from day one. We leverage the data in your orchestration system through a functionality we call ServiceVision to allow us to have an always-up-to-date view of where your containers are deployed and what they are supposed to be doing.
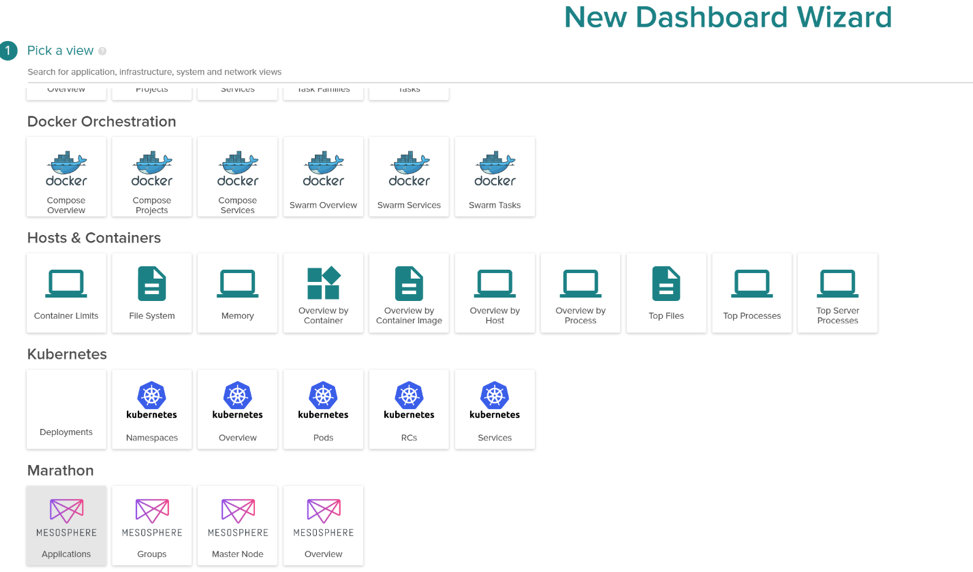
Take a look at all these (OOTB) Dashboards you can create quickly…. All the usual suspects you can deploy with Azure Container Services (Docker/Swarm, Kubernetes, and Mesosphere and Marathon) from an overview to individual services/tasks these templates are there right when you sign up for a trial or sign up for Sysdig.
Our agent runs at the kernel level for Sysdig to provide container vision without bloating your code or containers. Here is a docker compose overview that lays out the more in depth details from a service oriented point of view, even if your application’s/service’s containers are scattered in different Azure regions, availability sets, etc. Sysdig can provided a unified holistic view of the performance of that app/service.
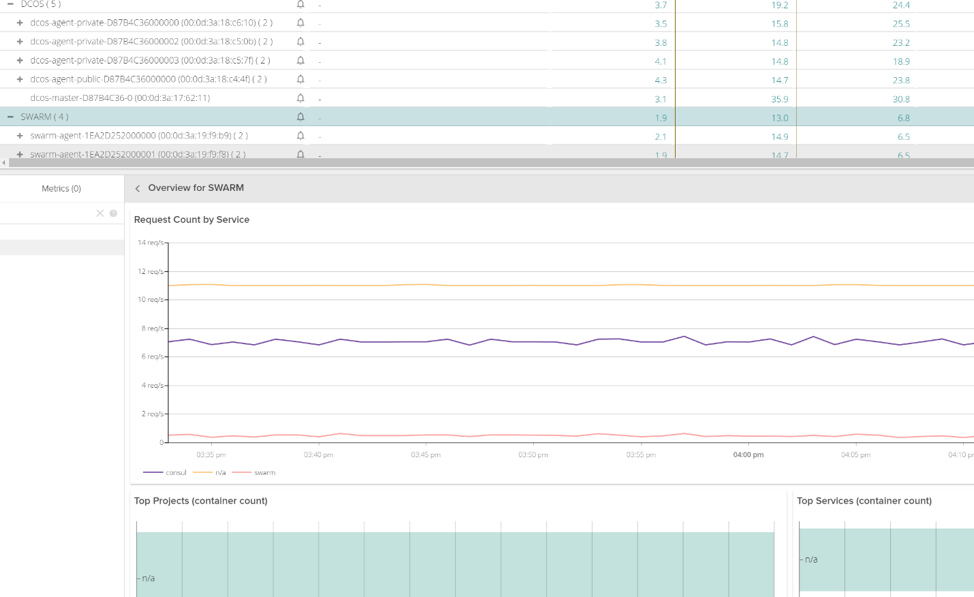
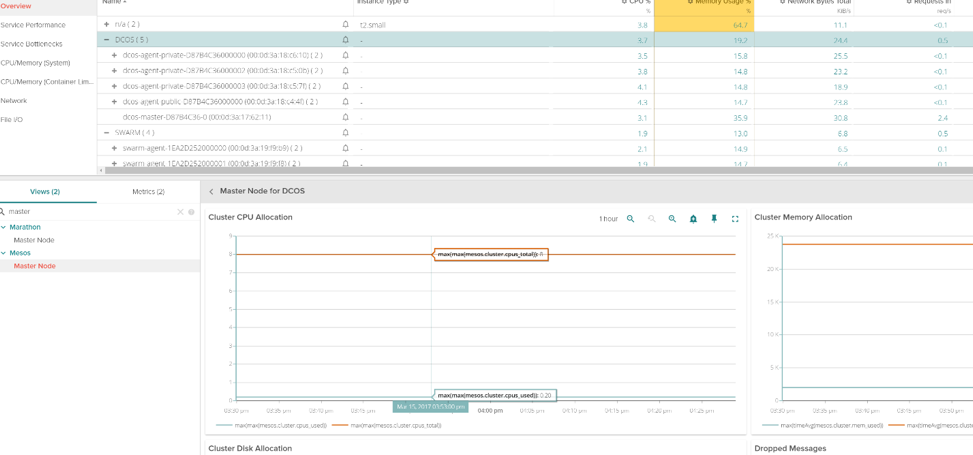
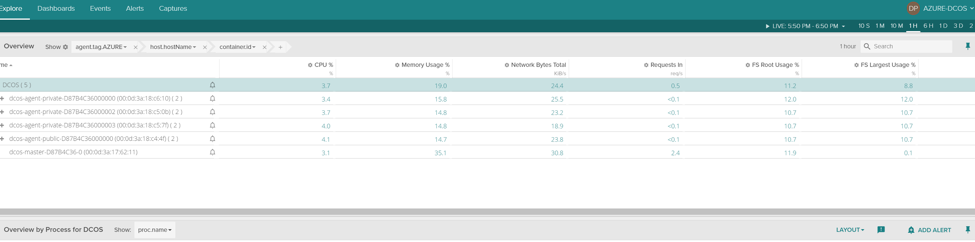
Sysdig is also getting DCOS data from the Orchestration API. Along with other application centric methods. you can see things such as Master and Agent node metrics, tasks, and even individual Marathon grouping
We can even provide granular application and or service level metrics for monitoring your Azure deployments. Here’s an example node.js app running on the 3 agent docker swarm we deployed in our azure container service:
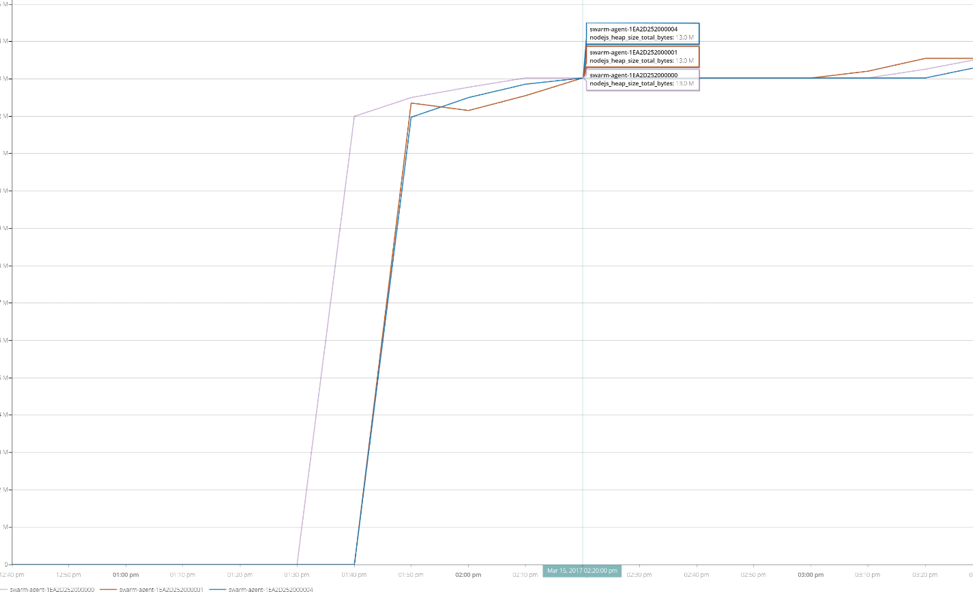
We are able to segment out which container is using x amount of heap size for instance…. All without anything installed in your containers or application code at all.
Service based access control to Azure container services… Can Sysdig do that?
With Sysdig Teams, we can isolate specific Azure instances to the end application teams needing visibility, we can even narrow it down to the end applications they are building. In this example I created two Teams, Azure-DCOS and AZURE-SWARM and created a service level access control to only visibility into the DC/OS Mesos environment
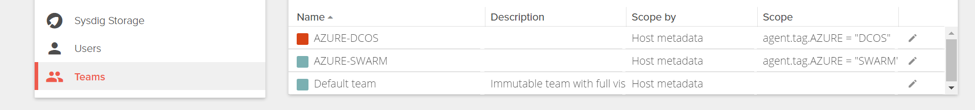
after switching to the AZURE-DCOS team, we only see what metrics ive selected from the team creation.
What if I don’t want to use a SaaS monitoring solution?
Sysdig can be installed our on premises installation in either a standard AZURE VM instance.
Directions here: https://support.sysdigcloud.com/hc/en-us/articles/206519903-On-Premises-Installation-Guide or your brand new Azure Container Services environment. (contact Sysdig for details)
Final thoughts
Sysdig works extremely well with Azure and can you provide you and your team even more visibility into your applications in addition to the default Azure tools. We hope this blog will help you take the leap in testing your applications/containers with Sysdig and Azure. Sysdig is offering 14 day trial if you want to take a test drive and you can also contact us if you want a demo.