
One of our missions at Sysdig is to make it easy to get deep application visibility into your environment. We think a convenient way of doing this is to provide automatic service discovery for your favorite software tools. What does that mean? NO PLUGINS. As soon as you install our Sysdig Cloud agent it will automatically discover the software that is running on all hosts, VMs, even containers.
Application Visibility Without Polluting Containers
Why is this a big deal? Most monitoring tools treat containers as essentially black boxes. If they even support Docker at all, visibility is limited to the basic resource utilization metrics reported by the containers themselves (eg. the Docker Stats API). Want application metrics? Good luck. A few tools manage to dip their toe in a little deeper, but require heavy configuration to get application level metrics out of containers. This means they’re not only hard to set up, but also brittle and even harder to maintain and scale.
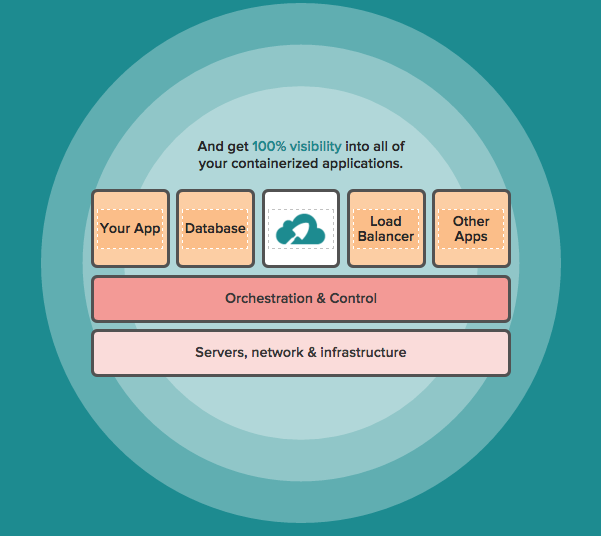
Sysdig is inherently different. Sysdig gives you 100% visibility into all your applications, even if they are running in containers. Sysdig’s Container Vision technology automatically detects what services are running on your infrastructure no matter how they’re packaged. Then we can display key application level metrics in preconfigured mini dashboards we call Views.
Today I’m excited to announce in our latest release we’ve added support for additional automatic service discovery and 23 new views.
Application Views:
- Apache CouchDB
- Consul
- Couchbase
- etcd
- FluentDB
- Gearman
- Go
- HDFS
- Kyoto Tycoon
- lighttpd
- MongoDB (Server)
- MySQL (Server
- Percona TokuMX
- PgBouncer
- PHP-FPM
- Postfix
- PostgreSQL Server
- Riak CS
- Riak
- Varnish
Mesos Views:
* Marathon * Master * Slave
An Example – Cassandra Container Monitoring
****This visibility allows us to do some pretty cool things in terms of monitoring applications inside containers, and that’s where Views come in. While using the Explore tab and drilling into a specific group, host, or container a bottom panel opens up. From that bottom panel you can select Views and then navigate to the one which is most relevant to you. In the example above we had grouped by service and chose to drill down into Cassandra.
Once you’ve selected the service that is relevant to you a mini dashboard will appear. Sysdig discovers the service running and displays a dashboard that has already been preconfigured with key metrics related to whatever service you’re drilling into. All without any work on the your end. Take a look back at the gif above and I bet you can find software you’re using on the left hand side.
Now that you have this newfound application level visibility you might as well use it and let your ops guys get more sleep. There are some pretty cool alerting capabilities that we covered in earlier blogs you should check out:
- Sysdig Cloud and PagerDuty: a Superior Alerting Experience
- Alerting for Today’s (and Tomorrow’s) Distributed, Containerized Environments
Conclusion
The beauty of views and automatic service discovery is that it requires no work on your end, and scales as quickly as your containers do. Add a new container or service and Sysdig will auto discover it and group information to easily track and troubleshoot what’s happening in your infrastructure.
Besides the new application views we already have a large set of views for System, Network, Kubernetes, and AWS Service metrics which are all available at the click of a mouse. If you’d like to start having visibility to all layers of your infrastructure, please don’t hesitate to sign up for a free, 14 day trial above!