


Falco Feeds extends the power of Falco by giving open source-focused companies access to expert-written rules that are continuously updated as new threats are discovered.

This tutorial shows how to prepare and deploy WordPress with all required dependencies (MySQL, etc) in Kubernetes.
Why WordPress? WordPress is usually chosen as the de facto application when explaining how to handle a process with a server software stack.
One of the challenges Kubernetes users face is deploying and re-deploying the same components required by their applications: databases like MySQL or MariaDB, MongoDB, Redis, Memcached, Elasticsearch; frontend servers like Nginx; or just a load balancer with HAproxy, to name a few examples.
If you have a CI/CD workflow in place, you probably have Jenkins or any other similar software deploying to Kubernetes via kubectl: Services, Deployments, ConfigMaps, Ingress controller and maybe even persistent storage. But if you are looking for something easier and more simple, there is a Kubernetes package manager that can help you: Helm.
Helm package manager and Kubernetes Charts
Helm is a Kubernetes package manager that allows you to package an application and handle all the required dependencies, including other services, and the configuration. The packages are called Charts. The idea is that instead of running kubectl to create the different deployments, services, etc. all the resources are defined in manifest templates that Helm installs as an atomic operation. Think of dpkg or yum, cpan or pip, but for Kubernetes apps.
Kubernetes Charts is the official repository that offers a central reference location for already packaged applications; at this time 60 apps are available in the stable branch.
Installing Helm in OSX or Linux
As a prerequisite, you will need kubectl authenticated and working against your Kubernetes instance in your cloud provider or you can use Minikube for testing in your local laptop.
On OSX, we recommend using Homebrew to install Helm:
On Linux, you can download the latest release and unpack it:
Init Helm in your Kubernetes cluster
Before moving along, Helm needs to be installed in your Kubernetes cluster as well. This is a very straightforward process and you just need to init Helm:
This will create a containerized service in Kubernetes known as Tiller. From this point on, the Helm package manager installed in your laptop will communicate with Tiller running in Kubernetes via gRPC, and Tiller will be in charge of deploying, upgrading and deleting the apps in your cluster:
If you want to update the Chats database, like apt update, simply:
And if you want to upgrade Tiller:
WordPress Deployment in Kubernetes
With Helm configured and Tiller up and running you can start deploying your favorite apps. For instance, let's search for WordPress Charts:
And you can get more information about this Chart in a similar fashion to apt-cache:
Since we want our WordPress running in its own namespace, let's create one as we install the application:
You can find all the available configuration options here, and you can set these either using the command line --set or in a YAML file. Also, all Charts output some instructions on how to proceed after the package is installed. In this case, you should see how to get the WordPress Ingress controller URL with:
Note: using .status.loadBalancer.ingress[0].ip didn't work for me as expected an IP address and I had a hostname instead, but you can always inspect the wordpress service with kubectl to get full details:
So just head to: https://a55201964028b11e7ad7912182a6edca-1068550576.us-east-1.elb.amazonaws.com and you will be able to access your new WordPress blog.
You can also check the administrator user credentials that are stored in a Kubernetes secret:
And if you want to see this information at any point, you can use helm status wordpress to show it again.
Helm can install and handle multiple apps, and can list the different apps installed:
And you can also delete them once you have finished with helm delete.
Monitoring WordPress in Kubernetes
Along with your app stack, monitoring with telemetry and performance metrics for troubleshooting, dashboards and alerts is a must. Sysdig Monitor is probably your best bet for doing all this with one tool in Kubernetes and in less than 5 minutes!
Sysdig Monitor agent has always been very easy to install, either running the plain Docker command or deploying it using a DaemonSet, but now Sysdig can also be deployed with Helm since it's available in the official Kubernetes Charts repository.
You just need to run the following command, including the AccessKey, which you will find in your Sysdig Monitor user account settings.
That's it.
Now you can list both Charts running:
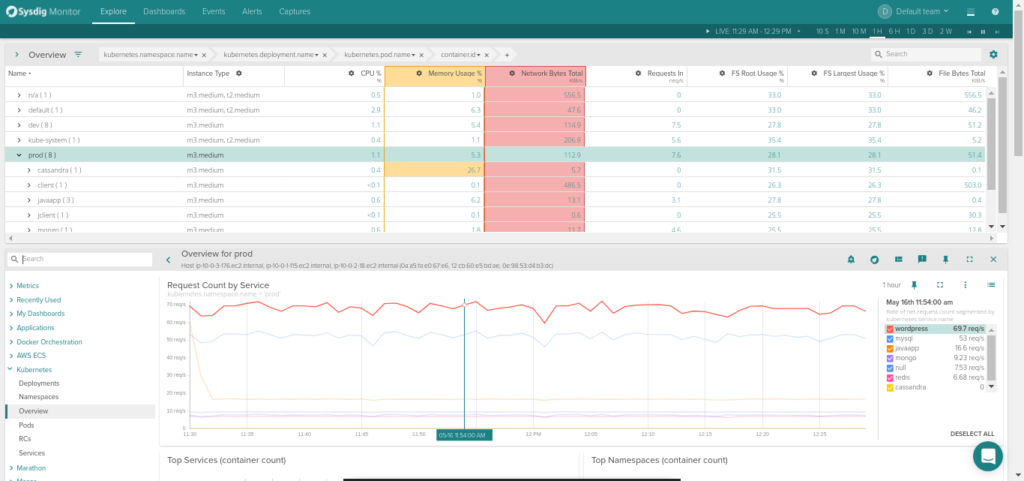
To start monitoring your Kubernetes deployment, go to Sysdig Monitor and from there you can visualize your deployment topology, configure dashboards and set up alerts. Through the Explore tab you can browse your infrastructure. Not only can you see hosts and containers running on them, you can also group containers using Kubernetes logic: cluster > namespaces > deployments or services > pods and containers.
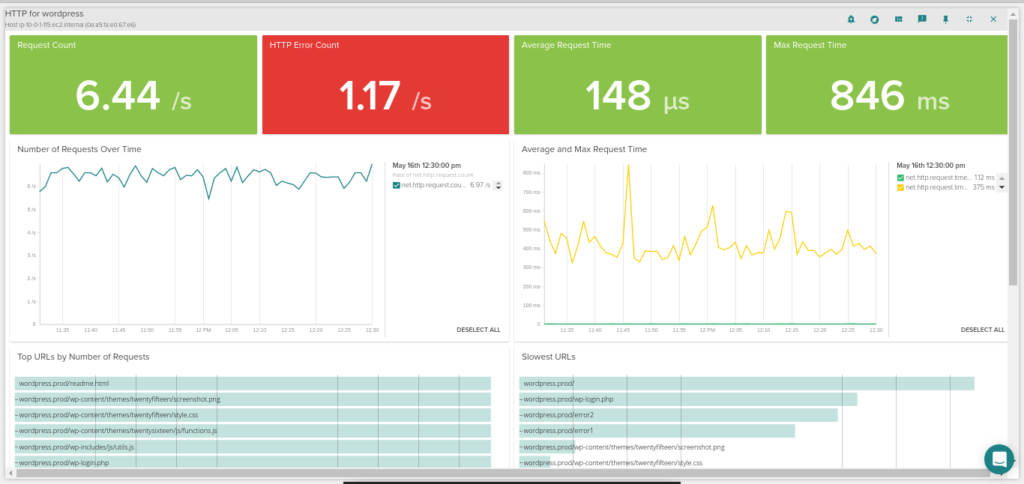
Thanks to Sysdig's ability to autodiscover the services running in your containers you will automatically get views of your WordPress containers, including application-layer metrics such as: HTTP requests and HTTP error count per second, average and max response time for each microservice, and also which are the top requested URLs or which are the slowest ones!
Recommended alerts for WordPress in Kubernetes
Monitoring any service running in Kubernetes is a little more tricky that monitoring the same service in a bare metal static infrastructure. Now you have to monitor not only the host and the services but also the containers and the orchestration platform. There is no rule that fits all scenarios, but we are going to throw out a few suggestions here of what should probably be in your alerts list.
Host-level alerts
Is any of your hosts down? If its a minion it's probably not too bad because Kubernetes will reschedule the containers somewhere else. If it's your master and you only have one you will probably want to know ASAP.
You might want to add some other host-level resource consumption alerts like disk usage over 80%, if you have been swapping for a few minutes and the load is way above normal. But remember, it's not worth waking you up if there isn't anything broken.
Kubernetes alerts
This is the new layer and basically you want to make sure the resources defined by Kubernetes are running. For our WordPress example, I'm pretty sure that everyone would like to know if there are no containers running for a given service, which should never happen!
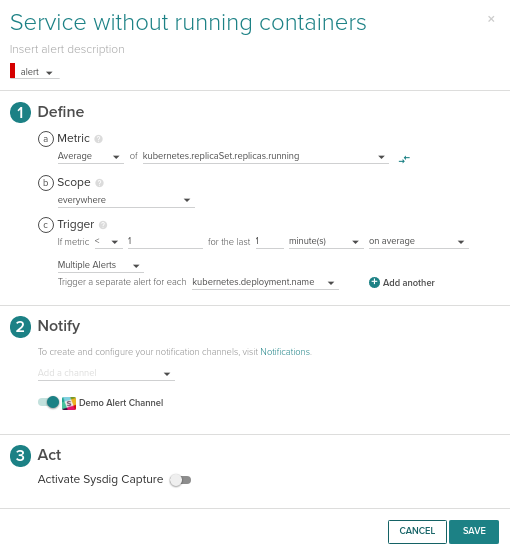
But also, you will want to know if the number of container running is lower that the number of replicas you wanted. This can be triggered with the following condition:
This should be applied to both the wordpress and mysql service.
Just making sure the containers are alive is not enough; you need to make sure they are not being continuously restarted because the process running inside is crashing. This is known as CrashLoopBackOff, and you can receive an alert when this happens using the restart count metric or an alert on the event:

We will apply this alert across everything in your cluster, making it trigger for each pod that matches this condition: kubernetes.pod.restart.count > 4 over the last 2 minutes.
Service level alerts
You still need to make sure that your services are running: that the WordPress webserver is responding to HTTP requests properly and queries are going through the MySQL database. Defining alerts at this level depends heavily on your traffic patterns. If you have a regular, sustained number of visits it is easy to set a minimum threshold of HTTP requests or MySQL queries, but if your traffic is random these kind of alerts will trigger many false positives.
In general, alerting should be configured using your working metrics (those that are a clear indicator that your app is working), triggering notifications to show that something has stopped working. Still, in most cases, you should set up a few alerts based on infrastructure availability or resources that always need to be there. If you want to learn more about Kubernetes alerting, don't miss our Monitoring Kubernetes (part 2): Best practices for alerting on Kubernetes.
Next steps
We think Helm is great for quickly and easily deploying the services you need for running your app in Kubernetes. Now you can also deploy the Sysdig Monitor agent with Helm too. If you want to close the circle you can create your own Chart package for your app and host it in your private repository, with everything still handled by Helm.
If you are looking at an even more user-friendly way to expose Helm to your Kubernetes users, check out Monocular, a Helm UI that you can also self-host in your Kubernetes.