
Kubernetes is one of the hottest and most promising new technologies in IT. And for good reason. Kubernetes builds on containers, and in particular on Docker, to offer a full environment to write scalable and service-based applications. It takes care of things like container grouping, discovery, load balancing and healing so you don’t have to worry about them. The design is elegant, scalable and the APIs are a pleasure to use.
There is a small catch though: the many benefits of Kubernetes do tend to come at the cost of reduced visibility into the system. We’re big fans of Kubernetes here at Sysdig though, and, well: we’re here to help.
Today I’m happy to announce that we have added native support for Kubernetes into Sysdig Cloud and our open source system exploration tool, sysdig. In this post, I’m going to focus on the new open source functionality in sysdig.
At a high level, sysdig is now aware of the entire Kubernetes cluster hierarchy, including namespaces, services, replication controllers and labels. So all of the rich system and application data gathered by sysdig is now available in the context of your Kubernetes infrastructure. What does this mean for you? In a nutshell, we believe sysdig can now be your go-to tool for making Kubernetes environments significantly easier to explore and troubleshoot! Let’s check it out…
The Basics
Starting with version 0.5.0, sysdig’s native Docker and container visibility is complemented by the ability to poll information from the Kubernetes API server, leveraging both the standard and the watch API. The feature is enabled by specifying the API server address using the -k command line switch when starting sysdig or csysdig:
> sysdig -k http://127.0.0.1:8080
Alternatively, you can accomplish the same by setting the SYSDIG_K8S_API environmental variable.
After that, sysdig will become aware of the Kubernetes cluster hierarchy, including namespaces, services, replication controllers and labels. This is in turn exposed to you, so that you can leverage it in sysdig’s filters, display fields and chisels. It’s also exported in a set of new csysdig views. Let me give you some examples.
Exploring a Kubernetes Cluster with csysdig
The easiest way to take advantage of sysdig’s Kubernetes support is by launching csysdig, the sysdig ncurses UI:
> csysdig -k http://127.0.0.1:8080
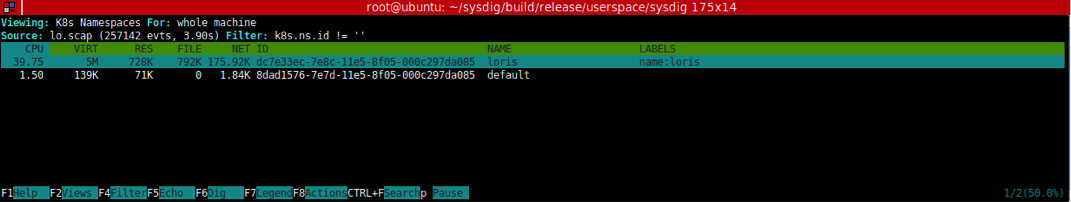
Now hit F2 to bring up the views panel, and you will notice the presence of a bunch of new views. The k8s Namespaces view can be used to see the list of namespaces and observe the amount of CPU, memory, network and disk resources each of them is using on this machine:
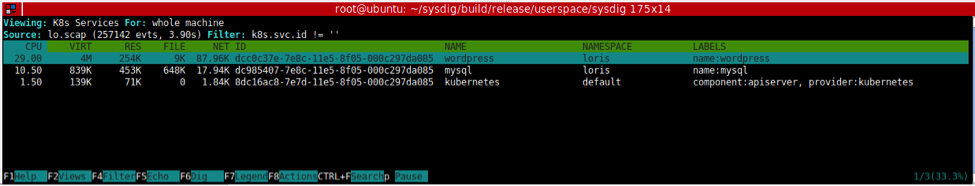
Similarly, you can select k8s Services to see the same information broken up by service:
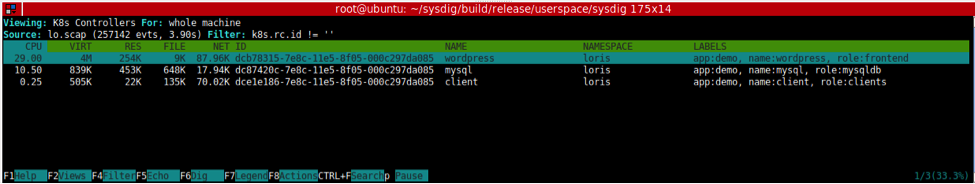
or k8s Controllers to see the replication controllers:
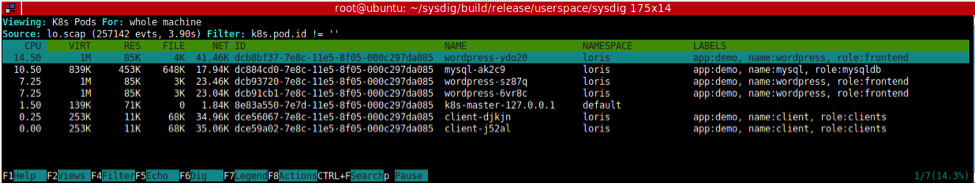
or k8s Pods to see the list of pods running on this machine and the resources they use:
Drill Down-Based Navigation
A cool feature in csysdig is the ability to drill down: just select an element, click on enter and – boom – now you are looking inside it. Drill down is now aware of the Kubernetes hierarchy, which means I can start from a service, get the list of its pods, see which containers run inside one of the pods, and go inside one of the containers to explore files, network connections, processes or even threads. Check out the video below.
Actions!
One more thing. As recently announced, csysdig just added “control panel” functionality. In particular, it’s now possible to use hotkeys to execute command lines based on the element currently selected. We’ve made sure to enrich the Kubernetes views with a bunch of useful hotkeys. For example, you can delete a namespace or a service by pressing ‘x’, or you can describe them by pressing ‘d’.
My favorite hotkeys, however, are ‘f’, to follow the logs that a pod is generating, and ‘b’, which leverages kubectl exec to give you a shell inside a pod. Being brought into a bash prompt for the pod you’re observing is really useful and, frankly, a bit magic. :-)
Going Deep with Sysdig Filters
In addition to the csysdig enhancements above, we’ve also added native support for Kubernetes in the classic sysdig interface. Ambitious users will now be able to step up their Kubernetes troubleshooting skills to Expert Mode with the following set of new sysdig filter fields:
> sysdig -l | grep k8s
Field Class: k8s
k8s.pod.name    Kubernetes pod name.
k8s.pod.id      Kubernetes pod id.
k8s.pod.label   Kubernetes pod label. E.g. 'k8s.pod.label.foo'.
k8s.pod.labels  Kubernetes pod comma-separated key/value labels. E.g. 'foo1:bar
k8s.rc.name     Kubernetes replication controller name.
k8s.rc.id       Kubernetes replication controller id.
k8s.rc.label    Kubernetes replication controller label. E.g. 'k8s.rc.label.foo
k8s.rc.labels   Kubernetes replication controller comma-separated key/value lab
k8s.svc.name    Kubernetes service name (can return more than one value, concat
k8s.svc.id      Kubernetes service id (can return more than one value, concaten
k8s.svc.label   Kubernetes service label. E.g. 'k8s.svc.label.foo' (can return
k8s.svc.labels  Kubernetes service comma-separated key/value labels. E.g. 'foo1
k8s.ns.name     Kubernetes namespace name.
k8s.ns.id       Kubernetes namespace id.
k8s.ns.label    Kubernetes namespace label. E.g. 'k8s.ns.label.foo'.
k8s.ns.labels   Kubernetes namespace comma-separated key/value labels. E.g. 'fo
Here are, for example, a couple of cool things you can do:
Show each file open event happening in /etc in the pod mypod:
> sudo sysdig evt.type=open and fd.name contains /etc and k8s.pod.name=mypod
Show the top HTTP requests made to the wordpress service:
>sudo sysdig -k http://127.0.0.1:8080 -chttptop k8s.svc.name=wordpress
Of course, these are just two of many things that you can do with these filters, which can be combined in arbitrarily complex expressions and used with any chisel.
Conclusion
If you are a Kubernetes user, either a beginner or a pro, I’m pretty confident that sysdig can be one of the most valuable tools in your toolbox. Giving it a spin is really simple. And I really hope you’ll make sure to let us know what you think, so we can keep improving sysdig!
And of course, if you’re interested in monitoring an entire distributed infrastructure of Kubernetes nodes, we’ve also added full Kubernetes support to Sysdig Cloud. You’ll get all of the visibility described above, but across your entire environment, with dashboards, pretty charts, topology views, and comprehensive alerting. I hope you’ll check it out!