
In this article, you’ll learn how to monitor Consul by HashiCorp with Prometheus. Also, troubleshoot Consul control plane with Prometheus from scratch, following Consul’s docs monitoring recommendations. Also, you’ll find out how to troubleshoot the most common Consul issues.
How to install Consul in Kubernetes
Installing Consul in Kubernetes is straightforward: just take a look at the Consul documentation page and follow the instructions. We recommend using the Helm chart, since it’s the easier way of deploying applications in Kubernetes.

How to configure Consul to expose Prometheus metrics
Consul automatically exports metrics in the Prometheus format. You just need to activate these options in the global.metrics configurations. If you’re using Helm, you can do it with:
--set 'global.metrics.enabled=true'
--set 'global.metrics.enableAgentMetrics=true'
Also, you’ll need to enable the telemetry.disable_hostname for both the Consul Server and Client so the metrics don’t contain the name of the instances.
--set 'server.extraConfig="{"telemetry": {"disable_hostname": true}}"'
--set 'client.extraConfig="{"telemetry": {"disable_hostname": true}}"'
Monitor Consul with Prometheus: Overall status
Autopilot
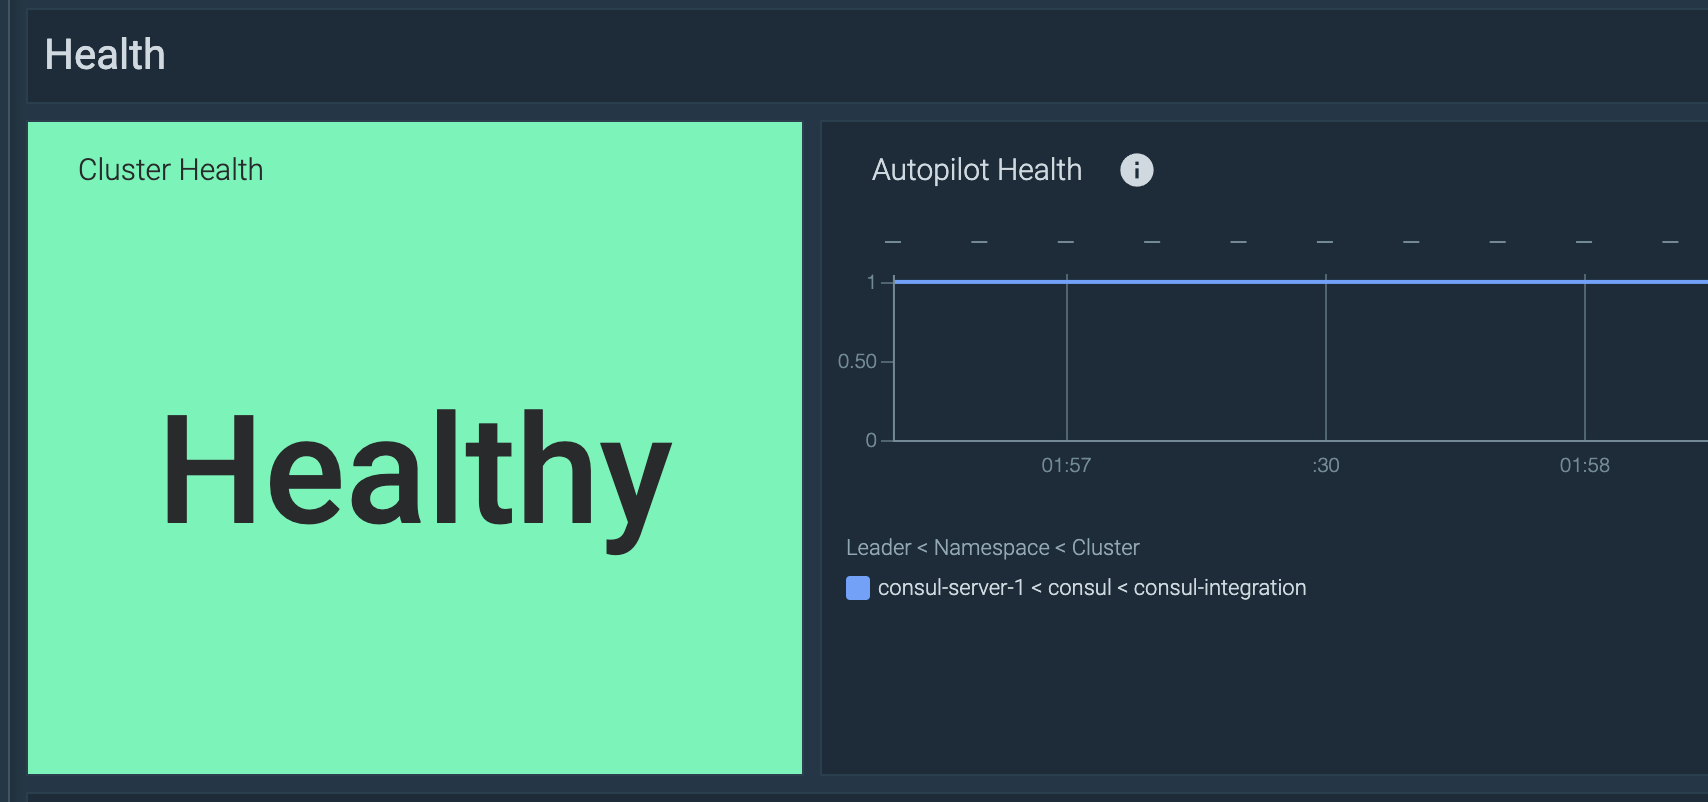
First, you can check the overall health of the Consul server using the Autopilot metric (consul_autopilot_healthy). If all servers are healthy, this will return 1 – and 0 otherwise. All non-leader servers will report NaN.
You could add this PromQL query to your dashboard to check the overall status of the Consul server:
min(consul_autopilot_healthy)
Adding these thresholds:
1: “Healthy”0: “Unhealthy”
To trigger an alert when one or many Consul servers in the cluster are unhealthy, you can simply use this PromQL:
consul_autopilot_healthy == 0
Want to dig deeper into PromQL? Read our getting started with PromQL guide to learn how Prometheus stores data, and how to use PromQL functions and operators.
Leadership changes
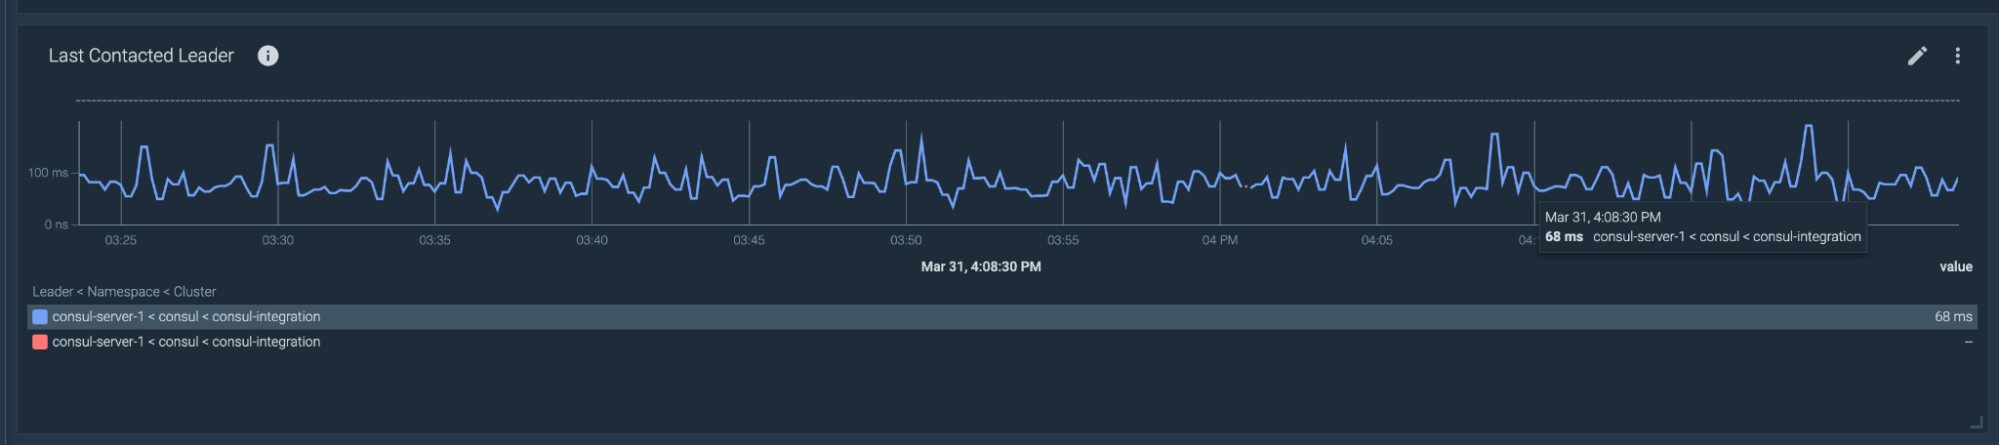
Consul deploys several instances of the control-plane controllers to ensure high availability. However, only one of them is the leader and the rest are for contingency. A Consul cluster should always have a stable leader. If it’s not stable, due to frequent elections or leadership changes, you could be facing network issues between the Consul servers.
For checking the leadership stability, you can use the following metrics:
consul_raft_leader_lastContact: Indicates how much time has passed since the leader contacted the follower nodes when checking its leader lease.consul_raft_state_leader: Number of leaders.consul_raft_state_candidate: Number of candidates to promote to leader. If this metric returns a number higher than 0, it means that a leadership change is in progress.
For a healthy cluster, you’re looking for a consul_raft_leader_lastContact lower than 200ms, a consul_raft_state_leader greater than 0, and a consul_raft_state_candidate equal to 0.
Let’s create some alerts to trigger if there is flapping leadership.
- There are too many elections for leadership:
sum(rate(consul_raft_state_candidate[1m]))>0 - There are too many leadership changes:
sum(rate(consul_raft_state_leader[1m]))>0 - Leader time to contact followers is too high:
consul_raft_leader_lastContact{quantile="0.9"}>200
The last query contains the label quantile="0.9", for using the percentile 90. By using the percentile p90, you’re getting the 10% of the samples that are taking more than 200ms to contact the leader.
Top troubleshooting situations to monitor Consul
Long latency in Consul transactions
Long latency in Consul transactional operations could be due to an unexpected load on the Consul servers, or the issues on the servers.
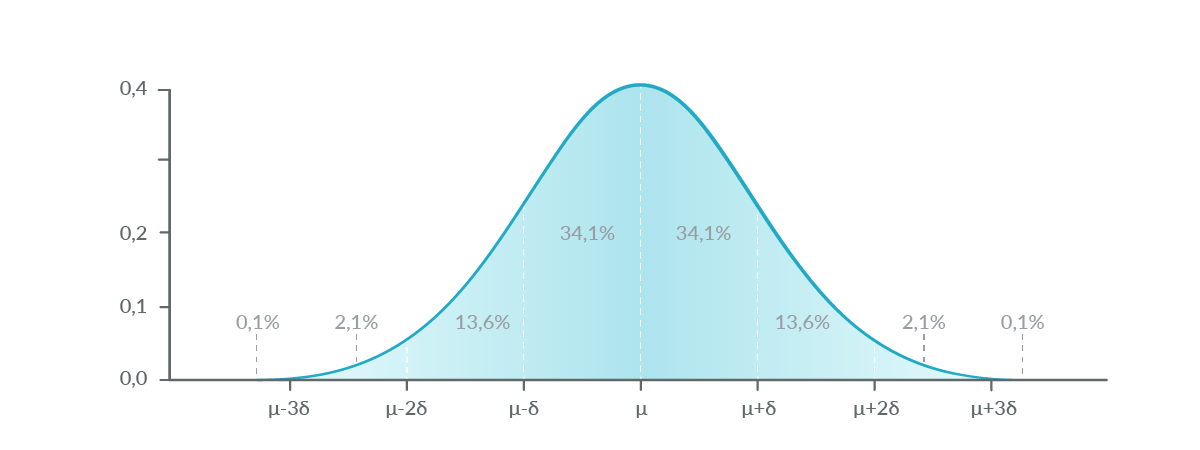
Anomalies need to be detected in a time context because the network is dynamic by nature, and you can’t just compare your samples with a fixed value. You need to compare your values with other values in the last hour (or the last day, last five minutes…) to determine if it’s a desirable value or needs some attention.
To detect anomalies, you can dust off your old statistics book and find the chapter explaining the normal distribution. The 95% of the samples in a normal distribution are between the average plus or minus two times the standard deviation.
To calculate this in PromQL, you can use the avg_over_time and stddev_over_time functions, like in this example:
avg(rate(consul_kvs_apply_sum[1m]) > 0)>(avg_over_time(rate(consul_kvs_apply_sum[1m]) [1h:1m]) + 2* stddev_over_time(rate(consul_kvs_apply_sum[1m]) [1h:1m]))
Let’s see a few alerts that are triggered if the transaction latency isn’t normal.
Key-Value Store update time anomaly
Consul KV Store update time had noticeable deviations from baseline over the previous hour.
avg(rate(consul_kvs_apply_sum[1m]) > 0)>(avg_over_time(rate(consul_kvs_apply_sum[1m]) [1h:1m]) + 2* stddev_over_time(rate(consul_kvs_apply_sum[1m]) [1h:1m]))

Please note that these examples contain PromQL subqueries.
Transaction time anomalies
Consul Transaction time had noticeable deviations from baseline over the previous hour.
avg(rate(consul_txn_apply_sum[1m]) >0)>(avg_over_time(rate(consul_txn_apply_sum[1m])[1h:1m]+2*stddev_over_time(rate(consul_txn_apply_sum[1m]) [1h:1m]))
Consul has a Consensus protocol that uses the Raft algorithm. Raft is a “consensus” algorithm, a method to achieve value convergence over a distributed and fault-tolerant set of cluster nodes.
Transactions count anomaly
Consul transactions count rate had noticeable deviations from baseline over the previous hour.
avg(rate(consul_raft_apply[1m]) > 0)>(avg_over_time(rate(consul_raft_apply[1m])[1h:1m])+2*stddev_over_time(rate(consul_raft_apply[1m])[1h:1m]))
Commit time anomalies
Consul commit time had noticeable deviations from baseline over the previous hour.
avg(rate(consul_raft_commitTime_sum[1m]) > 0)>(avg_over_time(rate(consul_raft_commitTime_sum[1m])[1h:1m])+2*stddev_over_time(rate(consul_raft_commitTime_sum[1m]) [1h:1m]))
High memory consumption
Keeping the memory usage under control is key to keeping the Consul server healthy. Let’s create some alerts to be sure that your Consul server doesn’t use more memory than available.
Consul is using more than 90% of available memory.
100 * sum by(namespace,pod,container)(container_memory_usage_bytes{container!="POD",container!="", namespace="consul"}) / sum by(namespace,pod,container)(kube_pod_container_resource_limits{job!="",resource="memory", namespace="consul"}) > 90

The garbage collection pause is high
Consul’s garbage collector has the pause event that blocks all runtime threads until the garbage collection completes. This process takes just a few nanoseconds, but if Consul’s memory usage is high, that could trigger more and more GC events that could potentially slow down Consul.
Let’s create two alerts: a warning alert if the GC takes more than two seconds per minute, and a critical alert if the GC takes more than five seconds per minute.
Please note that one second is 1000000000 nanoseconds
Garbage Collection stop-the-world pauses were greater than two seconds per minute.
(rate(consul_runtime_gc_pause_ns_sum[1m]) / (1000000000) > 2
Garbage Collection stop-the-world pauses were greater than five seconds per minute.
(min(consul_runtime_gc_pause_ns_sum)) / (1000000000) > 5
Network load is high
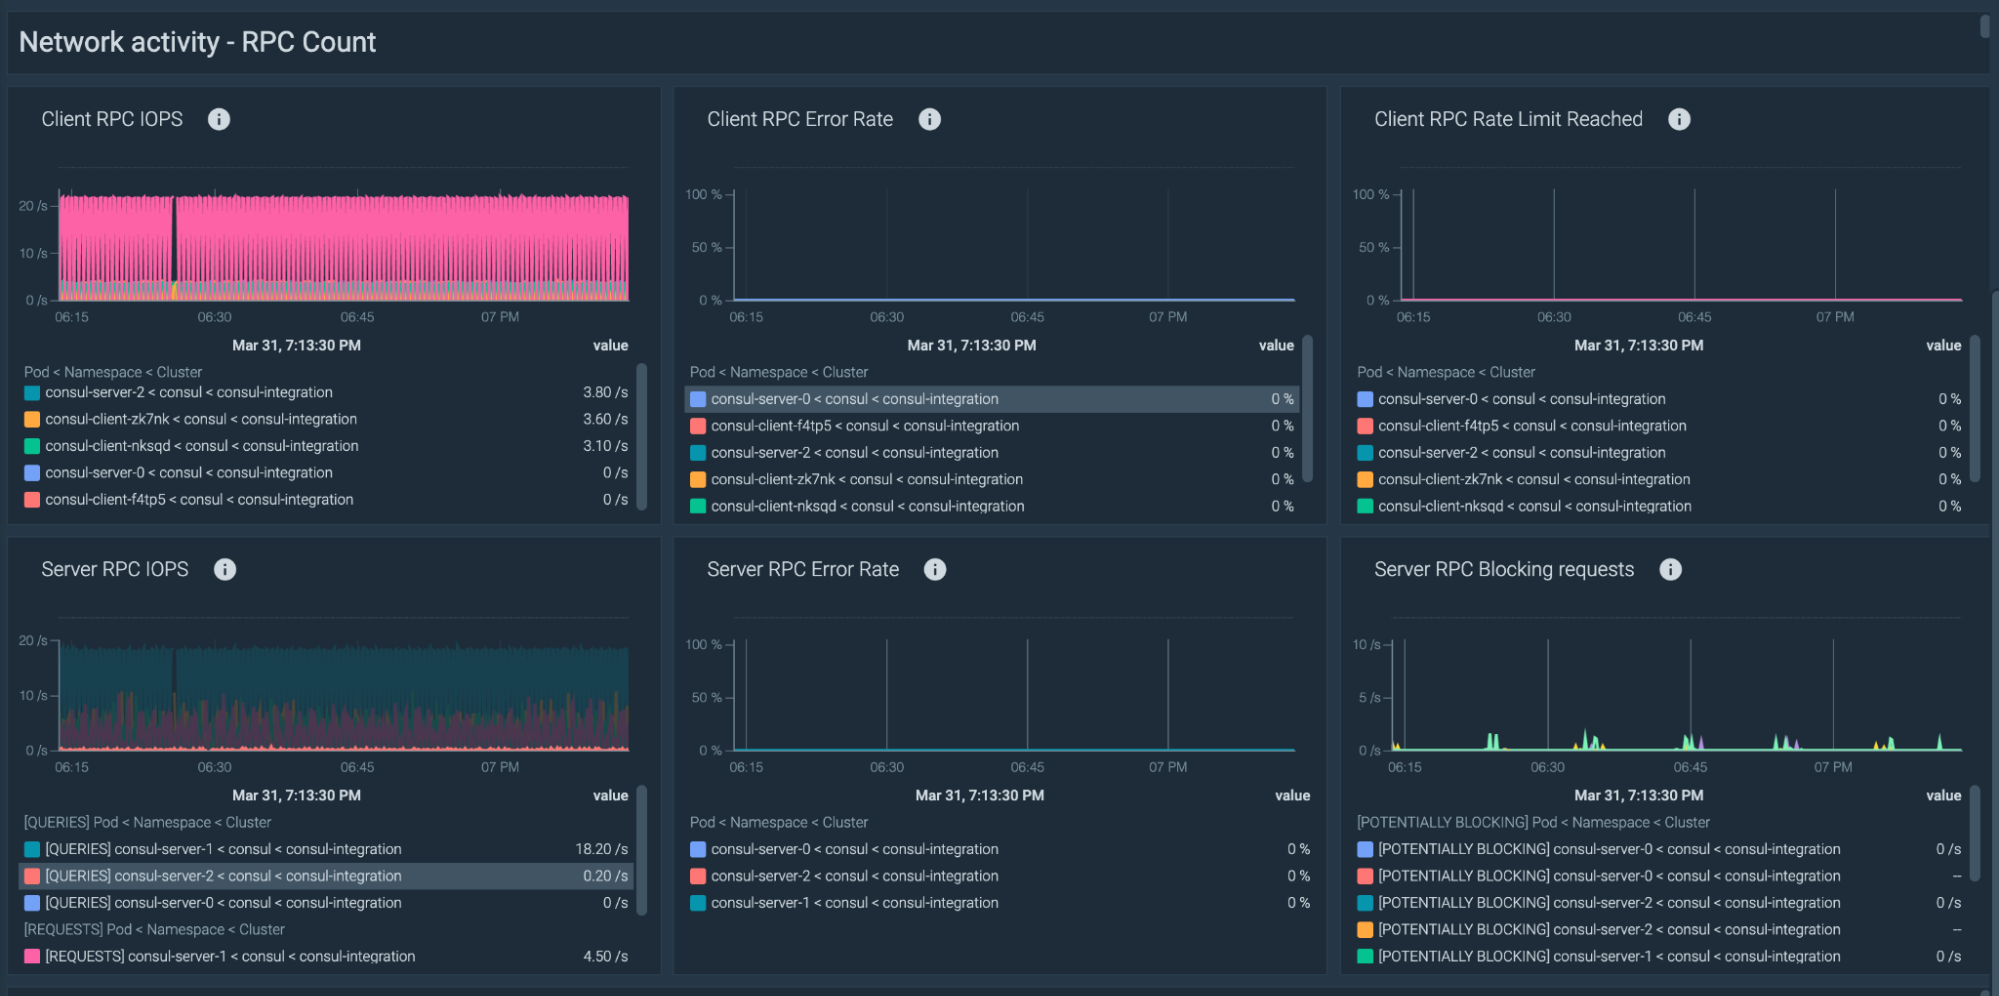
A high RPC count, meaning that the requests are being rate-limited, could imply a misconfigured Consul agent.
Now it’s time to assure that your Consul clients aren’t being rate-limited with sending requests to the Consul server. These are the recommended alerts for the RPC connections.
Client RPC requests anomaly
Consul Client RPC requests had noticeable deviations from baseline over the previous hour.
avg(rate(consul_client_rpc[1m]) > 0) > (avg_over_time(rate(consul_client_rpc[1m]) [1h:1m])+ 2* stddev_over_time(rate(consul_client_rpc[1m]) [1h:1m]) )
Client RPC requests rate limit exceeded
Over 10% of Consul Client RPC requests have exceeded the rate limit.
rate(consul_client_rpc_exceeded[1m]) / rate(consul_client_rpc[1m]) > 0.1
Client RPC requests failed
Over 10% of Consul Client RPC requests are failing.
rate(consul_client_rpc_failed[1m]) / rate(consul_client_rpc[1m]) > 0.1
Replica issues
Restoration time is too high
In this situation, restoring from disk or the leader is slower than the leader writing a new snapshot and truncating its logs. After a restart, followers might never rejoin the cluster until write rates reduce.
consul_raft_leader_oldestLogAge < 2* max(consul_raft_fsm_lastRestoreDuration)
Using Consul Enterprise? Check that your license is up-to-date!
You can use this simple PromQL query to check if your Consul Enterprise license will expire in less than 30 days.
consul_system_licenseExpiration / 24 < 30
Monitor Consul with Prometheus, with these dashboards
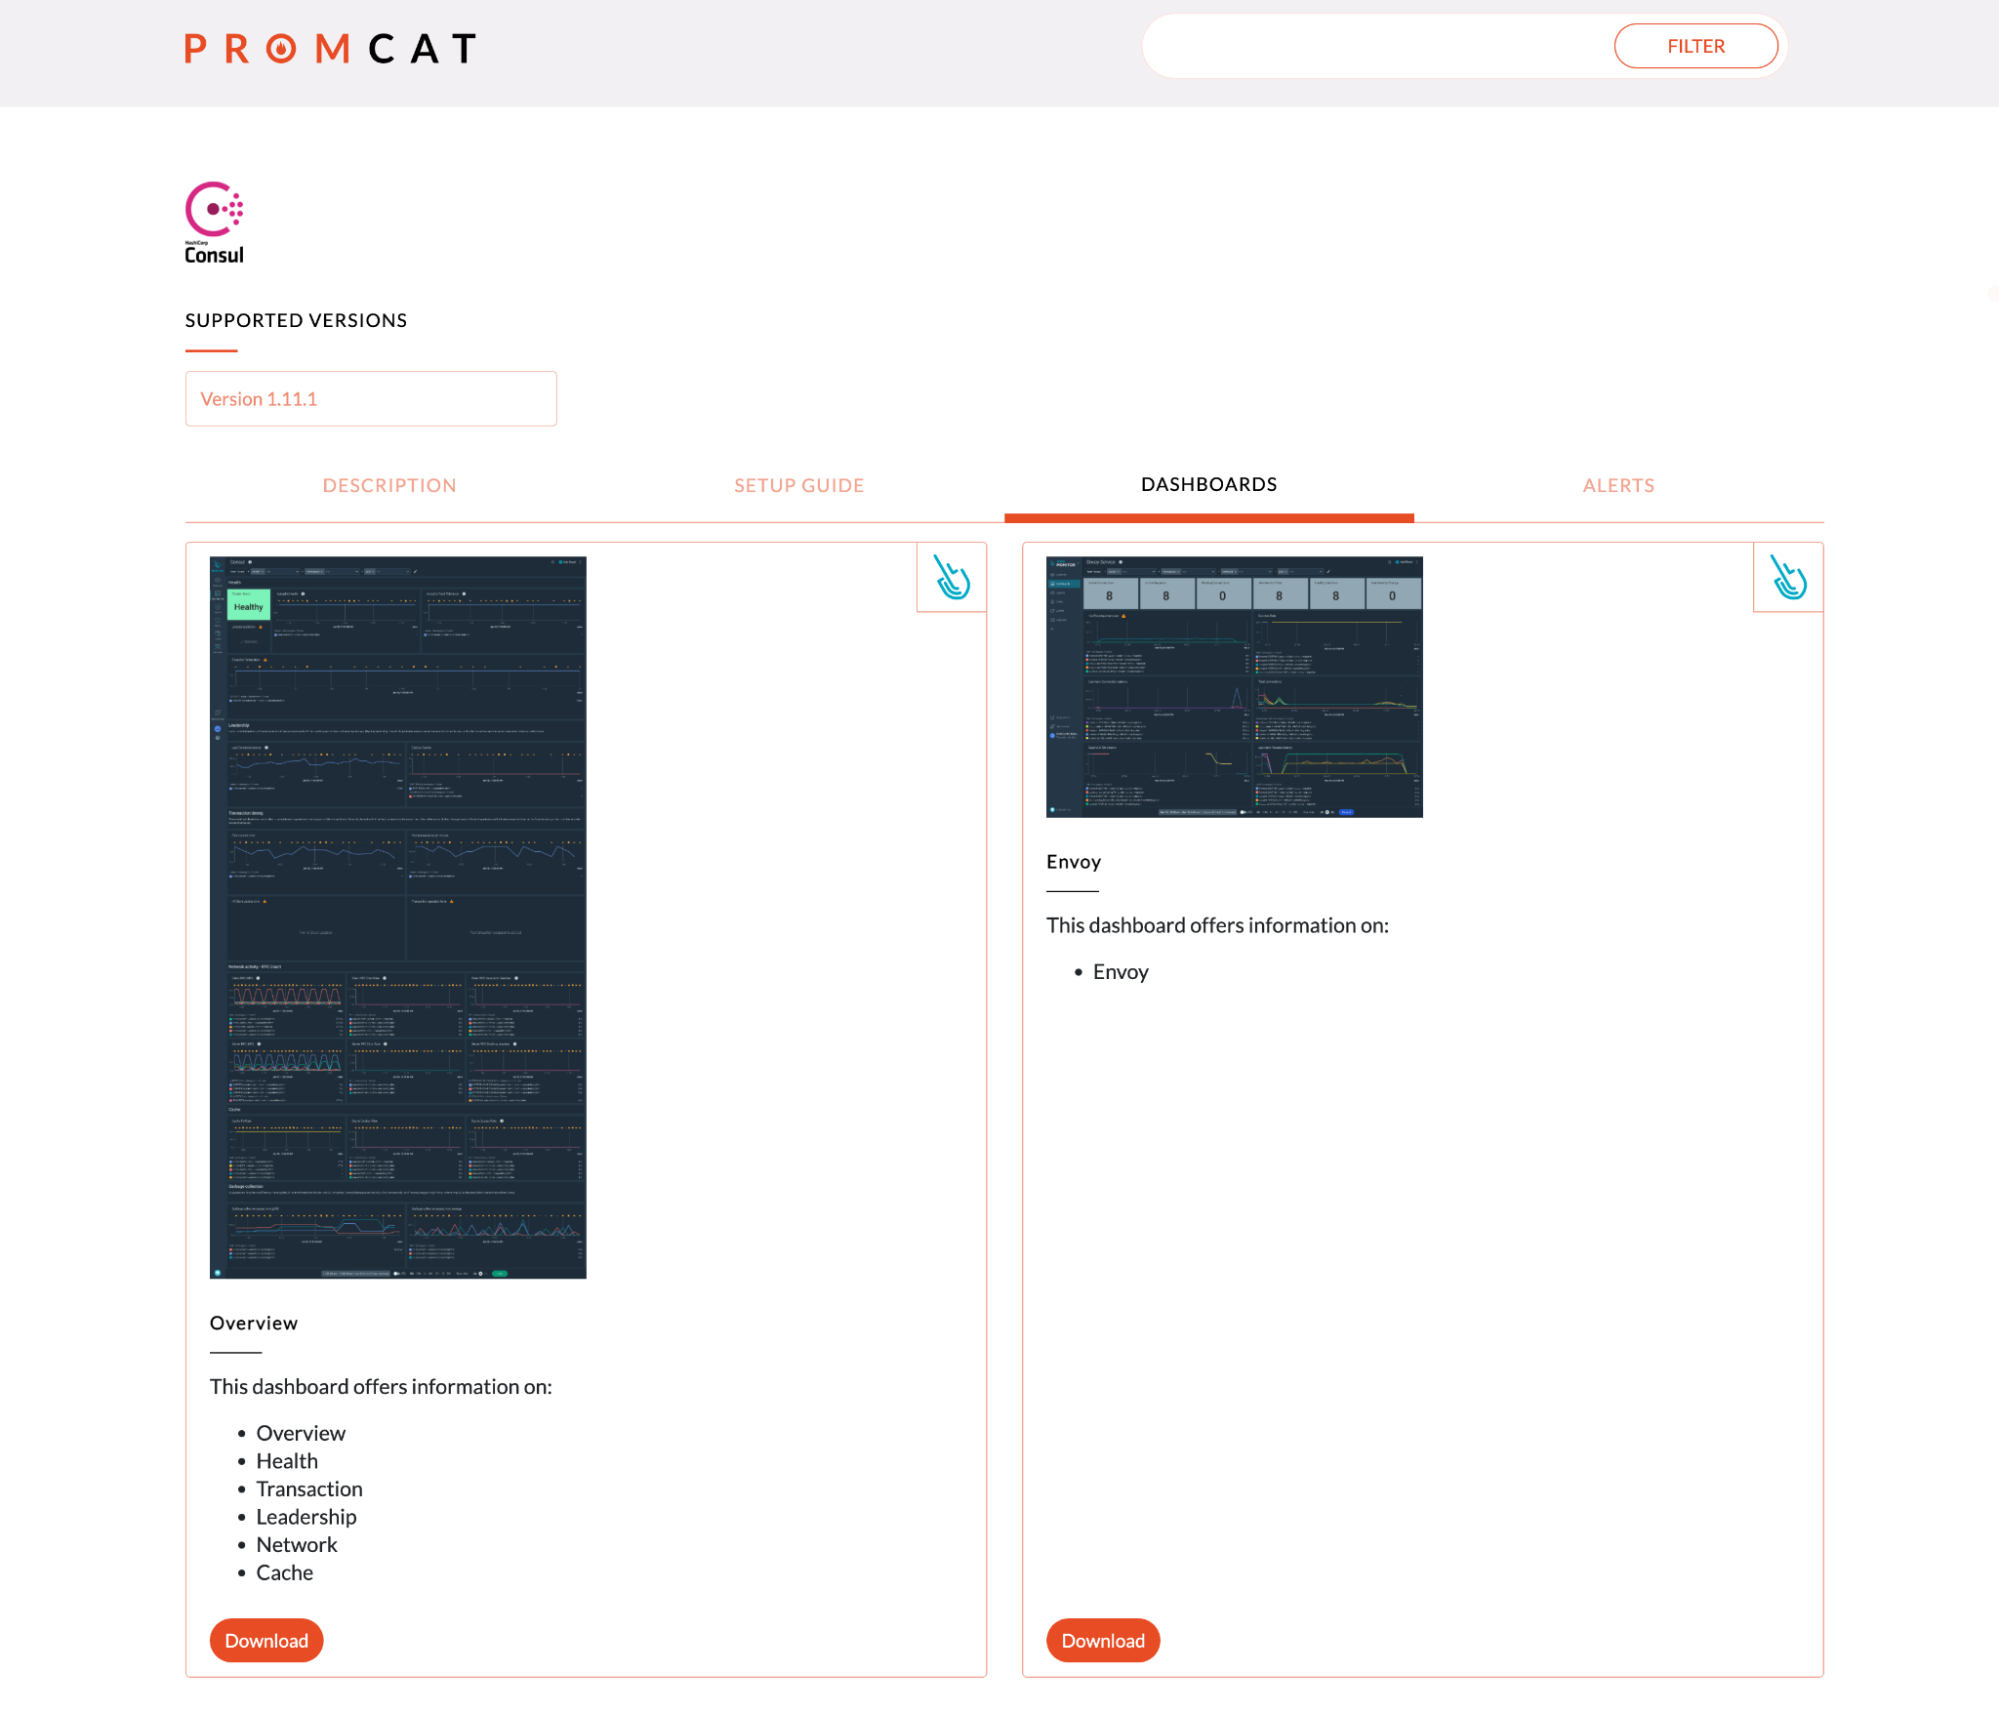
Don’t miss these open source dashboards already setup to monitor your Consul cluster overview, but also:
- Health
- Transaction
- Leadership
- Network
- Cache
In this article, you’ve learned how to monitor the Consul control plane with Prometheus, and some alert recommendations, useful for troubleshooting the most common Consul issues.
Want to try this integration?
Register now for the free Sysdig Monitor trial and start taking advantage of its Managed Prometheus service. Try our Prometheus integrations or send metrics through Prometheus Remote Write in minutes!