

Kubernetes capacity planning is one of the main challenges that infrastructure engineers have to face, as understanding Kubernetes limits and requests is not an easy thing.
You might be reserving way more resources than you need to ensure your containers don’t run out of memory, or are CPU throttled. If you are in this situation, you’re going to be charged for those resources even if they aren’t being used, and it will also make deployments more difficult to schedule. That’s why Kubernetes capacity planning is always a balance between the stability and reliability of the cluster, and the correct use of the resources.
In this article, you’ll learn how to identify unused resources and how to rightsize the capacity of your cluster.
Don’t be a greedy developer
There are situations where a container requests more resources than it needs. If it’s just a container, it may not have a critical impact on the invoice from your cloud provider. But if this happens in all the containers, you’ll have several extra costs in your invoices in a large cluster.
Not to mention that if pods are too big, you may spend extra effort debugging scheduling issues. After all, it’s harder for Kubernetes to schedule bigger Pods following your priorities.
Two open-source tools will help you with Kubernetes capacity planning:
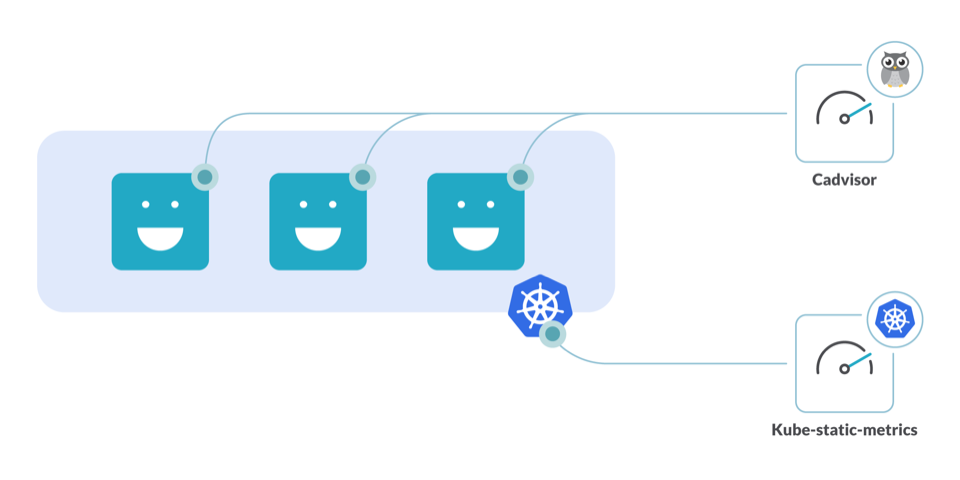
- kube-state-metrics: An add-on agent to generate and expose cluster-level metrics.
- CAdvisor: A resource usage analyzer for containers.
With these tools running in your cluster, you’ll be able to avoid resource underuse and rightsize the requests for your cluster.
How to detect underutilized resources
CPU
Computing capacity is one of the most delicate knobs to tweak since it’s easy to throttle your node by setting the requests too low. On the other side, trying to solve this by requesting too many cores will end up on a mostly idle cluster node.

Detecting idle cores
Using the information given by container_cpu_usage_seconds_total and kube_pod_container_resource_requests, you can detect how many CPU cores are underutilized.
sum((rate(container_cpu_usage_seconds_total{container!="POD",container!=""}[30m]) - on (namespace,pod,container) group_left avg by (namespace,pod,container)(kube_pod_container_resource_requests{resource="cpu"})) * -1 >0)
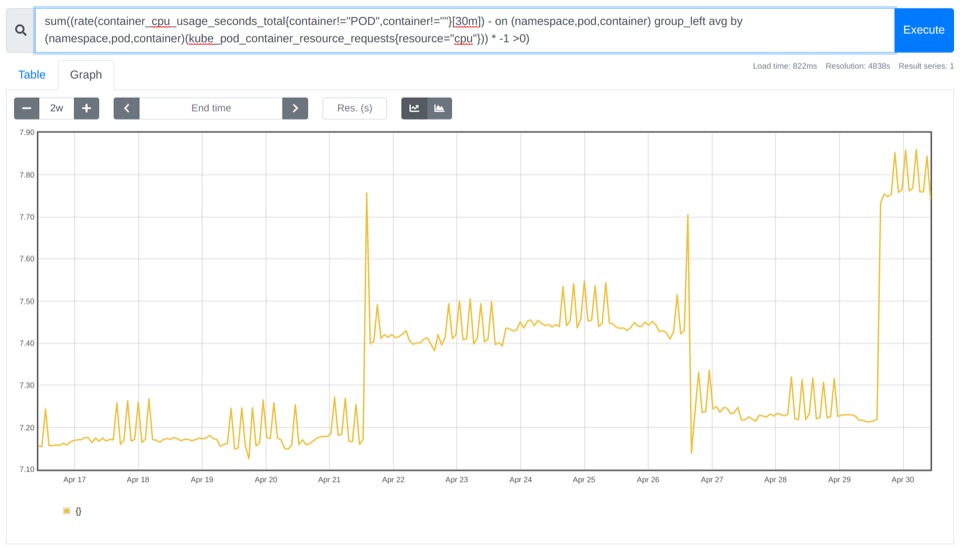
In the example above, you can see there are between ~7.10 and ~7.85 cores not being used.
How to identify which namespaces are wasting more CPU cores
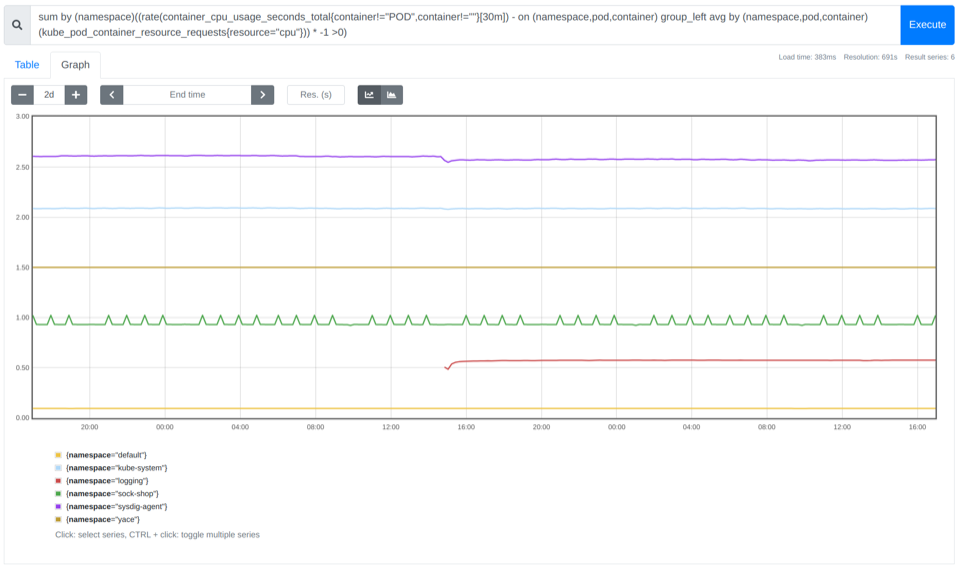
By summing the previous PromQL query by namespace, you can get a more fine-grained picture. And, the good news is that it enables you to charge-back the departments responsible for the over-sized namespaces.
sum by (namespace)((rate(container_cpu_usage_seconds_total{container!="POD",container!=""}[30m]) - on (namespace,pod,container) group_left avg by (namespace,pod,container)(kube_pod_container_resource_requests{resource="cpu"})) * -1 >0)
Finding the top 10 containers that are CPU oversized
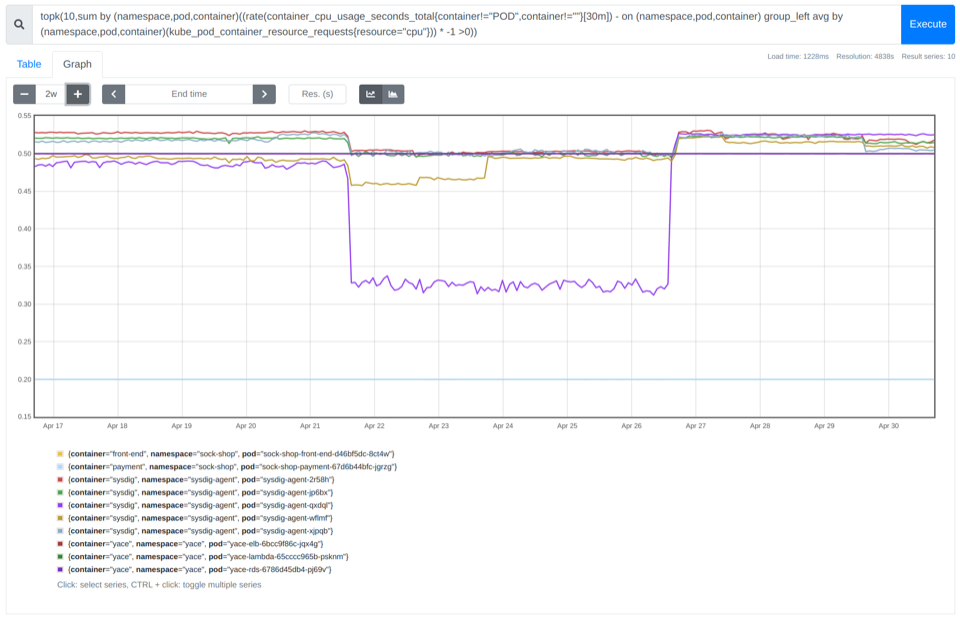
As we covered in our PromQL getting started guide, you can use the topk function to easily get the top n results for a PromQL query. Just like this:
topk(10,sum by (namespace,pod,container)((rate(container_cpu_usage_seconds_total{container!="POD",container!=""}[30m]) - on (namespace,pod,container) group_left avg by (namespace,pod,container)(kube_pod_container_resource_requests{resource="cpu"})) * -1 >0))
Memory
It’s critical to do memory planning correctly. If you don’t request enough memory, the node will start to evict pods when it runs out of memory. But memory is also finite, so the better you tune this setting, the more deployments will fit each node. Learn more about Out of memory errors.
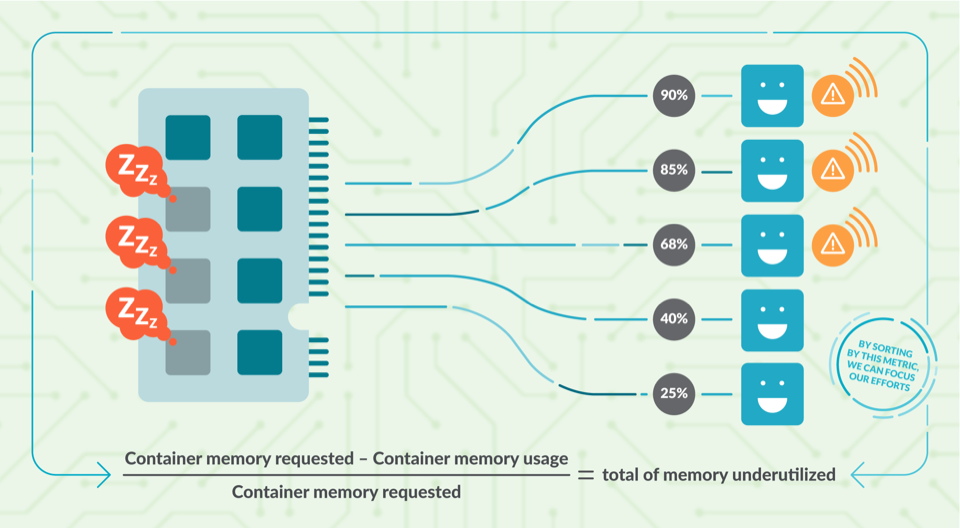
Detecting unused memory
You can use the information from container_memory_usage_bytes and kube_pod_container_resource_requests to see how much memory you are wasting.
sum((container_memory_usage_bytes{container!="POD",container!=""} - on (namespace,pod,container) avg by (namespace,pod,container)(kube_pod_container_resource_requests{resource="memory"})) * -1 >0 ) / (1024*1024*1024)
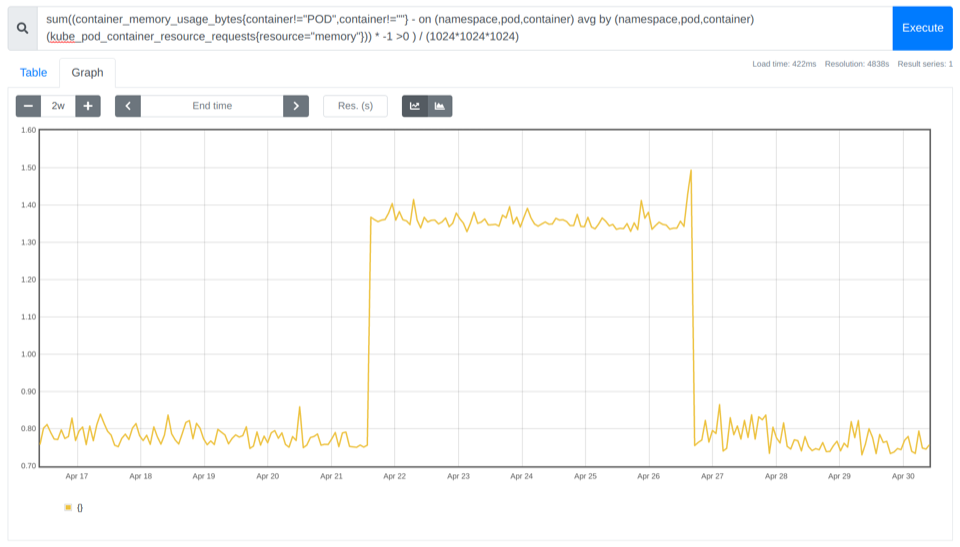
In the example above, you can see that you could save 0.8 Gb cost for that cluster.
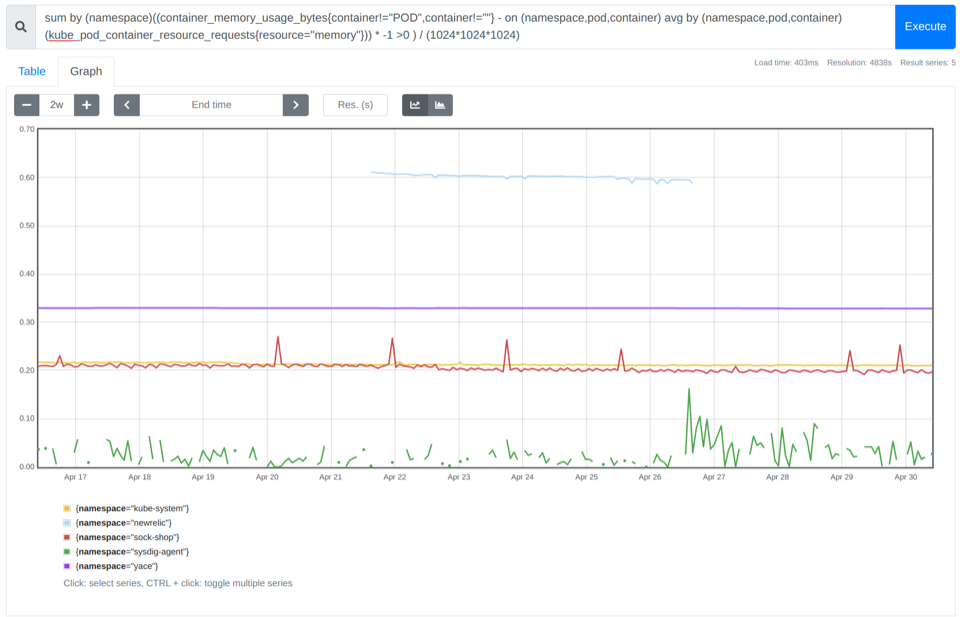
How to identify which namespaces are wasting more memory
We can aggregate by namespace, just as we did with the CPU.
sum by (namespace)((container_memory_usage_bytes{container!="POD",container!=""} - on (namespace,pod,container) avg by (namespace,pod,container)(kube_pod_container_resource_requests{resource="memory"})) * -1 >0 ) / (1024*1024*1024)
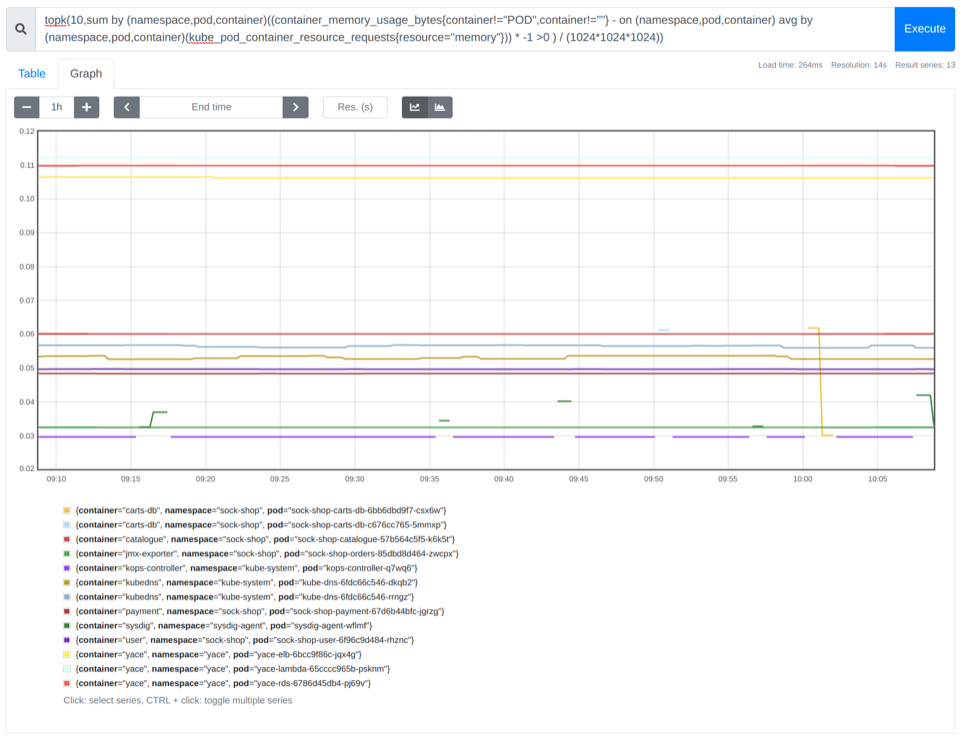
Finding the top 10 containers that are memory oversized
Again, using the topk function, we can identify the top 10 containers that waste more memory inside of each namespace.
topk(10,sum by (namespace,pod,container)((container_memory_usage_bytes{container!="POD",container!=""} - on (namespace,pod,container) avg by (namespace,pod,container)(kube_pod_container_resource_requests{resource="memory"})) * -1 >0 ) / (1024*1024*1024))
How to rightsize the requests of your containers
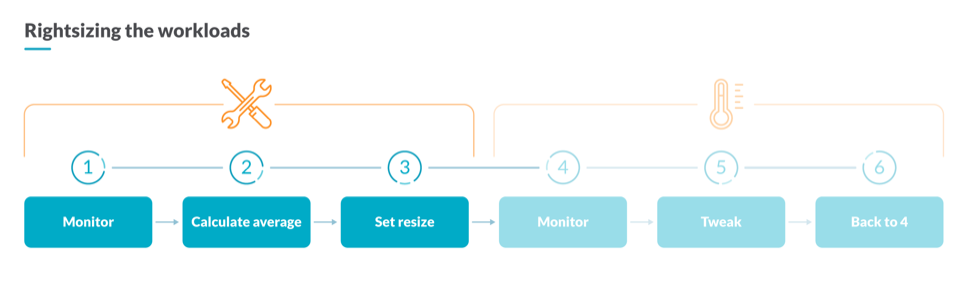
In Kubernetes capacity planning, to reserve the correct amount of computational resources, you need to analyze the current resource usage of your containers. For that, you could use this PromQL Query that calculates the average CPU utilization for all the containers belonging to the same workload. Understanding a workload as a Deployment, a StatefulSet, or a DaemonSet.
avg by (namespace,owner_name,container)((rate(container_cpu_usage_seconds_total{container!="POD",container!=""}[5m])) * on(namespace,pod) group_left(owner_name) avg by (namespace,pod,owner_name)(kube_pod_owner{owner_kind=~"DaemonSet|StatefulSet|Deployment"}))
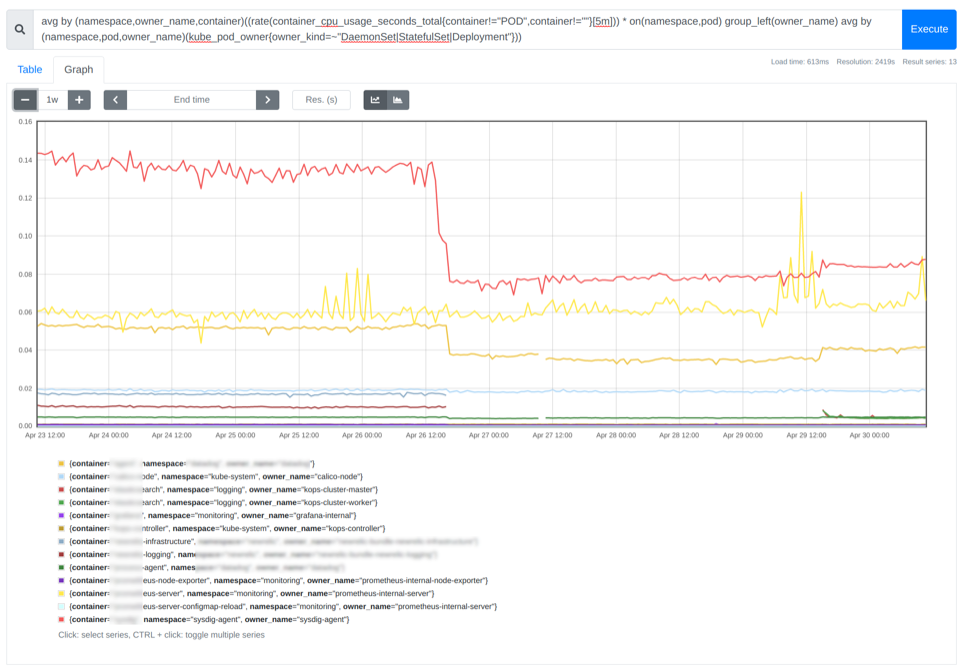
In the image above, you can see the average CPU utilization for each container. As a rule of thumb, you can set the request of the containers with a value between 85% and 115% of the average usage of CPU or memory.
How to measure the impact of your optimizations
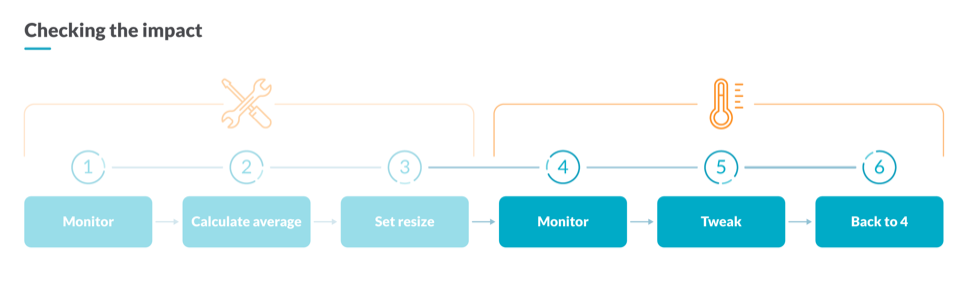
After performing some Kubernetes capacity planning operations, you’ll need to check the impact of the changes on your infrastructure. For that, you can compare the underutilized CPU cores now against the values from one week before to assess the impact of your optimizations.
sum((rate(container_cpu_usage_seconds_total{container!="POD",container!=""}[30m]) - on (namespace,pod,container) group_left avg by (namespace,pod,container)(kube_pod_container_resource_requests{resource="cpu"})) * -1 >0) - sum((rate(container_cpu_usage_seconds_total{container!="POD",container!=""}[30m] offset 1w) - on (namespace,pod,container) group_left avg by (namespace,pod,container)(kube_pod_container_resource_requests{resource="cpu"} offset 1w )) * -1 >0)
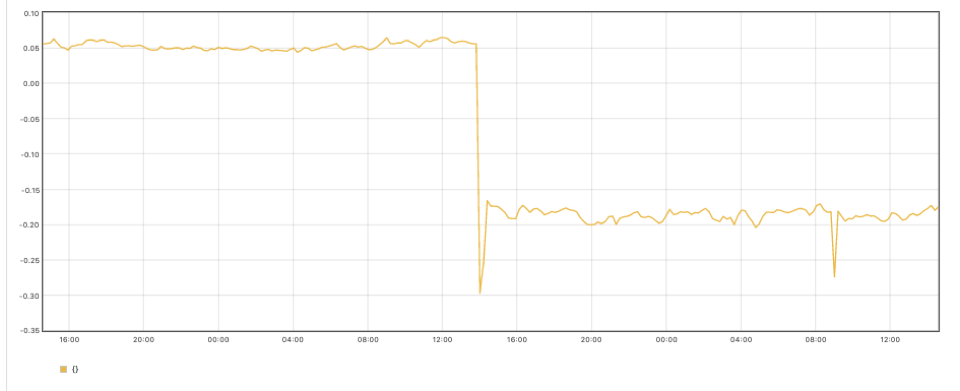
In the above graph, you can see that after applying the previous optimizations, we now have fewer unused cores in our cluster.
Putting it all together
Now you know the consequences of the greedy developer problem and how to detect the over-allocation of platform resources. Additionally, you learned how to rightsize the requests of your containers and how to measure the impact of your optimizations.
These tips should be a good starting point to build a comprehensive Kubernetes capacity planning dashboard, and obtain a single pane of glass with all the information needed to optimize your platform resources.
Now that you already configured your Kubernetes resource requests in your cluster, you can dig deeper on how to set the right Kubernetes resource limits!
How to do Kubernetes capacity planning with Sysdig
We, at Sysdig, use Kubernetes ourselves, and also help hundreds of customers dealing with their clusters every day. We are happy to share all that expertise with you in our out-of-the-box Kubernetes Dashboards. With the right dashboards, you won’t need to be an expert to troubleshoot or do Kubernetes capacity planning in your cluster.
With our out-of-the-box Kubernetes Dashboards, you can discover underutilized resources in a couple of clicks.
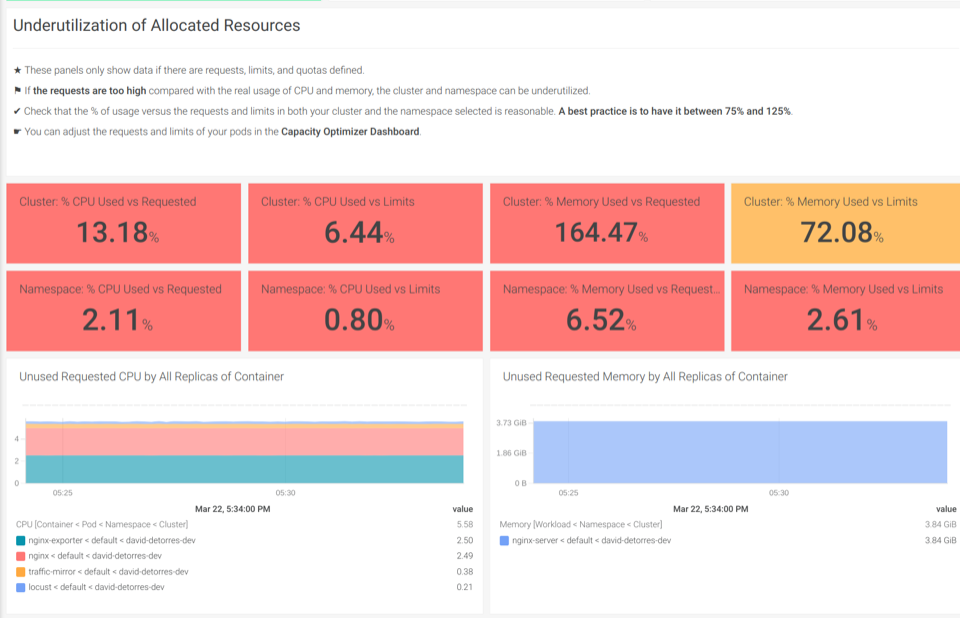
The Underutilization of Allocated Resources dashboards help you find if there are unused CPU or memory
Also, you can sign up for a free trial of Sysdig Monitor and try the out-of-the-box Kubernetes dashboards.