
Etcd is the backend store for all the Kubernetes cluster related data. It is undoubtedly a key component in the Kubernetes infrastructure. Monitoring etcd properly is of vital importance because if you fail to observe the Kubernetes etcd, you’ll probably fail to prevent issues too. In that case, you can get into some serious trouble.
If the etcd quorum is lost, and the etcd consequently cluster fails, you won’t be able to make changes to the Kubernetes current state. No new pods will be scheduled, among many other problems. Big latencies between the etcd nodes, disk performance issues, or high throughput are some of the common root causes of availability problems with etcd.
How to monitor etcd is a hot topic for those companies that are on their Kubernetes and cloud native journey. Fortunately, the Kubernetes etcd is instrumented to provide the etcd metrics out of the box. From either a DIY Prometheus instance or a Prometheus managed service, you can scrape the etcd metrics and take control of one of the most critical components in your Kubernetes cluster.
If you want to learn how to monitor etcd, which metrics you should check and what they mean, and prevent issues with the Kubernetes etcd…
You are in the right place 👌. Keep reading!
This article will cover the following topics:
What is etcd?
Etcd is a distributed key-value open source database that provides a reliable way to store data that needs to be accessed from distributed systems or clusters of machines. When talking about Kubernetes, it can be said that etcd is the cornerstone of the cluster. Kubernetes leverages the etcd distributed database to store its REST API objects (under the /registry directory key): Pods, Services, Ingress, and everything else is tracked and stored in the etcd in a key-value format.

So, what would happen if the Kubernetes etcd goes down?
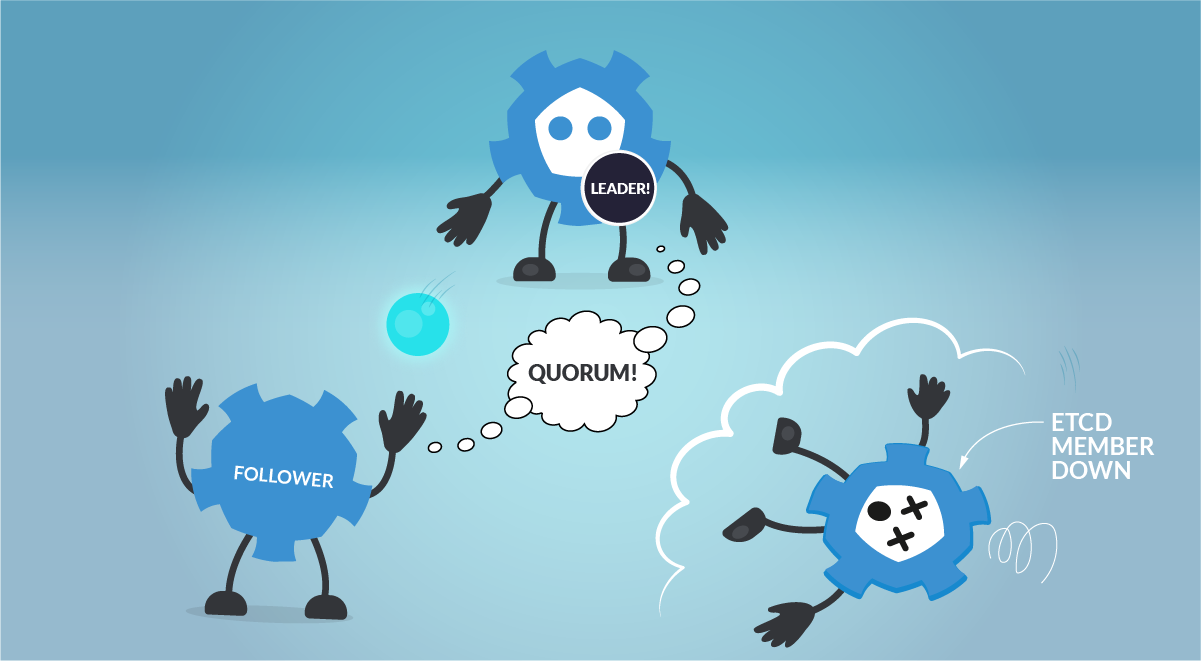
In the event of etcd quorum being lost and a new leader can’t be elected, the current Pods and workloads would keep running in your Kubernetes cluster. However, no new changes can be made, even new Pods can’t be scheduled.
In terms of leader election and “consensus”, etcd uses the RAFT algorithm. This is a method to achieve convergence over a distributed and fault-tolerant set of cluster nodes. Basically, what you need to know about how the RAFT helps to elect a leader in etcd is:
Node status can be one of the following:
- Follower
- Candidate
- Leader
How does the election process work?
- If a Follower cannot locate the current Leader, it will become a Candidate.
- The voting system will elect a new Leader among the Candidates.
- Registry values updates (commit) always goes through the Leader. However, clients don’t know which node is the Leader. If a Follower receives a request that needs consensus, it will forward this request automatically to the Leader.
- Once the Leader has received the ack from the majority of the Followers, the new value is considered “committed”.
- The cluster will survive as long as most of the nodes remain alive.
Perhaps the most remarkable features of etcd are:
- The straightforward way of accessing the service using REST-like HTTP calls.
- Its master-master protocol, which automatically elects the cluster Leader and provides a fallback mechanism to switch this role if needed.
When running etcd to store data for your distributed systems or Kubernetes clusters, it is recommended to use an odd number of nodes. Quorum needs a majority of nodes in the cluster to agree on updates to the cluster state. For a cluster with n number of nodes, the quorum needed to make up a cluster is (n/2)+1. For example:
- For a 3 nodes cluster, quorum will be achieved with 2 nodes. (Failure tolerance 1 node)
- For a 4 nodes cluster, quorum will be achieved with 3 nodes. (Failure tolerance 1 node)
- For a 5 nodes cluster, quorum will be achieved with 3 nodes. (Failure tolerance 2 nodes)
An odd-size cluster tolerates the same number of failures as an even-size cluster, but with fewer nodes. In addition, in the event of a network partition, an odd number of nodes guarantees that there will always be a majority partition, avoiding the frightening split-brain scenario. This way, the etcd cluster can keep operating and being the source of truth when the network partition is resolved.
Lastly, let’s see how to operate with the etcd by using the etcdctl CLI tool. It can be useful to get information about the health of the etcd members:
$ ETCDCTL_API=3 etcdctl \
--endpoints 192.168.119.30:2379,192.168.119.31:2379,192.168.119.32:2379 \
--cert=/etc/kubernetes/pki/etcd/server.crt \
--key=/etc/kubernetes/pki/etcd/server.key \
--cacert=/etc/kubernetes/pki/etcd/ca.crt \
endpoint status --write-out=tableCode language: JavaScript (javascript)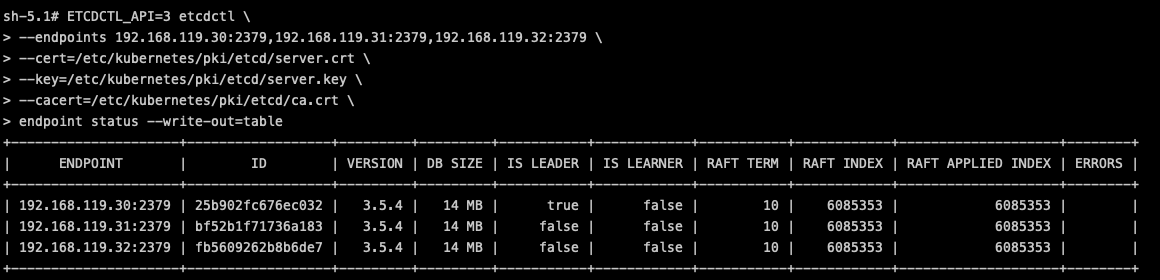
Or, you can even browse the data directly in the etcd backend:
$ ETCDCTL_API=3 etcdctl \
--endpoints 192.168.119.30:2379,192.168.119.31:2379,192.168.119.32:2379 \
--cert=/etc/kubernetes/pki/etcd/server.crt \
--key=/etc/kubernetes/pki/etcd/server.key \
--cacert=/etc/kubernetes/pki/etcd/ca.crt \
get / --prefix --keys-only

/registry/apiextensions.k8s.io/customresourcedefinitions/apiservers.operator.tigera.io
/registry/apiextensions.k8s.io/customresourcedefinitions/authorizationpolicies.security.istio.io
/registry/apiextensions.k8s.io/customresourcedefinitions/bgpconfigurations.crd.projectcalico.org
/registry/apiextensions.k8s.io/customresourcedefinitions/bgppeers.crd.projectcalico.org
/registry/apiextensions.k8s.io/customresourcedefinitions/blockaffinities.crd.projectcalico.org
/registry/apiextensions.k8s.io/customresourcedefinitions/caliconodestatuses.crd.projectcalico.org
/registry/apiextensions.k8s.io/customresourcedefinitions/clusterinformations.crd.projectcalico.org
/registry/apiextensions.k8s.io/customresourcedefinitions/destinationrules.networking.istio.io
/registry/apiextensions.k8s.io/customresourcedefinitions/envoyfilters.networking.istio.io
/registry/apiextensions.k8s.io/customresourcedefinitions/felixconfigurations.crd.projectcalico.org

(output truncated)Code language: JavaScript (javascript)
How to monitor etcd
As mentioned in the previous section, etcd is instrumented, exposes and provides its metrics endpoint, and is accessible in every master host. Users can easily scrape metrics from this endpoint, without the need of scripts or additional exporters. Just curl the metrics endpoint and get all the Kubernetes etcd metrics related data.
This endpoint is secured, though. The official port for etcd client requests, the same one that you need to get access to the /metrics endpoint, is 2379. So, if you want to scrape metrics from the etcd /metrics endpoint, you need to have access to the Kubernetes etcd client port and possess the etcd client certificates.
Let’s check one of the Kubernetes etcd Pod yaml definitions, specifically the endpoint ports used by the Kubernetes etcd.
spec:
  containers:
  - command:
    - etcd
    - --advertise-client-urls=https://192.168.119.30:2379
    - --cert-file=/etc/kubernetes/pki/etcd/server.crt
    - --client-cert-auth=true
    - --data-dir=/var/lib/etcd
    - --experimental-initial-corrupt-check=true
    - --experimental-watch-progress-notify-interval=5s
    - --initial-advertise-peer-urls=https://192.168.119.30:2380
    - --initial-cluster=k8s-control-1.lab.example.com=https://192.168.119.30:2380
    - --key-file=/etc/kubernetes/pki/etcd/server.key
    - --listen-client-urls=https://127.0.0.1:2379,https://192.168.119.30:2379
    - --listen-metrics-urls=http://127.0.0.1:2381
    - --listen-peer-urls=https://192.168.119.30:2380
    - --name=k8s-control-1.lab.example.com
    - --peer-cert-file=/etc/kubernetes/pki/etcd/peer.crt
    - --peer-client-cert-auth=true
    - --peer-key-file=/etc/kubernetes/pki/etcd/peer.key
    - --peer-trusted-ca-file=/etc/kubernetes/pki/etcd/ca.crt
    - --snapshot-count=10000
    - --trusted-ca-file=/etc/kubernetes/pki/etcd/ca.crt
    image: registry.k8s.io/etcd:3.5.4-0
Code language: JavaScript (javascript)
Here, you can see the –listen-client-urls parameter which identifies the endpoint you should use to reach the /metrics endpoint, and the –cert-file and –key-file certificates you need to access this secured endpoint.
Getting access to the endpoint manually
If you try to access the /metrics endpoint without these certificates, you’ll soon realize that it is not possible to reach the endpoint.
$ curl http://192.168.119.30:2379/metrics
curl: (52) Empty reply from server

$ curl https://192.168.119.30:2379/metrics
curl: (60) SSL certificate problem: unable to get local issuer certificate
More details here: https://curl.haxx.se/docs/sslcerts.html

curl failed to verify the legitimacy of the server and therefore could not
establish a secure connection to it. To learn more about this situation and
how to fix it, please visit the web page mentioned above.
Code language: JavaScript (javascript)
What do you need to get your metrics from etcd then?
It’s simple, grab the etcd certificates from your master node and curl the Kubernetes etcd endpoint.
Note: In order to be trusted, you have to use the etcd CA certificate (ca.crt) or use -k to bypass the validation.
$ curl --cacert etcd_certificates/ca.crt --cert etcd_certificates/server.crt --key etcd_certificates/server.key https://192.168.119.30:2379/metrics
# HELP etcd_cluster_version Which version is running. 1 for 'cluster_version' label with current cluster version
# TYPE etcd_cluster_version gauge
etcd_cluster_version{cluster_version="3.5"} 1
# HELP etcd_debugging_auth_revision The current revision of auth store.
# TYPE etcd_debugging_auth_revision gauge
etcd_debugging_auth_revision 1
# HELP etcd_debugging_disk_backend_commit_rebalance_duration_seconds The latency distributions of commit.rebalance called by bboltdb backend.
# TYPE etcd_debugging_disk_backend_commit_rebalance_duration_seconds histogram
etcd_debugging_disk_backend_commit_rebalance_duration_seconds_bucket{le="0.001"} 4896
etcd_debugging_disk_backend_commit_rebalance_duration_seconds_bucket{le="0.002"} 4896
etcd_debugging_disk_backend_commit_rebalance_duration_seconds_bucket{le="0.004"} 4896
etcd_debugging_disk_backend_commit_rebalance_duration_seconds_bucket{le="0.008"} 4896
etcd_debugging_disk_backend_commit_rebalance_duration_seconds_bucket{le="0.016"} 4896
etcd_debugging_disk_backend_commit_rebalance_duration_seconds_bucket{le="0.032"} 4896
etcd_debugging_disk_backend_commit_rebalance_duration_seconds_bucket{le="0.064"} 4896
etcd_debugging_disk_backend_commit_rebalance_duration_seconds_bucket{le="0.128"} 4896
etcd_debugging_disk_backend_commit_rebalance_duration_seconds_bucket{le="0.256"} 4896
etcd_debugging_disk_backend_commit_rebalance_duration_seconds_bucket{le="0.512"} 4896
etcd_debugging_disk_backend_commit_rebalance_duration_seconds_bucket{le="1.024"} 4896
etcd_debugging_disk_backend_commit_rebalance_duration_seconds_bucket{le="2.048"} 4896
etcd_debugging_disk_backend_commit_rebalance_duration_seconds_bucket{le="4.096"} 4896
etcd_debugging_disk_backend_commit_rebalance_duration_seconds_bucket{le="8.192"} 4896
etcd_debugging_disk_backend_commit_rebalance_duration_seconds_bucket{le="+Inf"} 4896
etcd_debugging_disk_backend_commit_rebalance_duration_seconds_sum 0.0042786149999999995
etcd_debugging_disk_backend_commit_rebalance_duration_seconds_count 4896
# HELP etcd_debugging_disk_backend_commit_spill_duration_seconds The latency distributions of commit.spill called by bboltdb backend.
(output truncated)Code language: PHP (php)
How to configure Prometheus to scrape etcd metrics
Once you have tested that the Kubernetes etcd metrics endpoint is accessible and that you can get the etcd metrics manually, it’s time to configure your Prometheus instance, or your managed Prometheus service, for scrapping the etcd metrics.
First, you need to create a new secret in the monitoring namespace. This secret will mount the etcd certificates (the same were used in the previous section) that you’ll need to scrape metrics from the etcd metrics endpoint. Patch the prometheus-server Deployment with that secret you just created.
Disclaimer: The etcd is the core of any Kubernetes cluster. If you don’t take care with the certificates, you can expose the entire cluster and potentially be a target.
$ kubectl create secret generic etcd-ca --from-file=etcd_certificates/server.crt --from-file=etcd_certificates/server.key -n monitoring
$ kubectl patch deployment prometheus-server -n monitoring -p '{"spec":{"template":{"spec":{"volumes":[{"name":"etcd-ca","secret":{"defaultMode":420,"secretName":"etcd-ca"}}]}}}}'
$ kubectl patch deployment prometheus-server -n monitoring -p '{"spec":{"template":{"spec":{"containers":[{"name":"prometheus-server","volumeMounts":[{"mountPath":"/opt/prometheus/secrets","name":"etcd-ca"}]}]}}}}'Code language: JavaScript (javascript)
Assuming you already have your DIY Prometheus instance or a managed Prometheus service, you need to get the current prometheus-server ConfigMap, and add a new scrape_config for etcd metrics. Add the etcd job under the scrape_configs section.
$ kubectl get cm prometheus-server -n monitoring -o yaml > prometheus-server.yaml
$ vi prometheus-server.yaml
scrape_configs:
…
    - job_name: etcd
      scheme: https
      kubernetes_sd_configs:
      - role: pod
      relabel_configs:
      - action: keep
        source_labels:
        - __meta_kubernetes_namespace
        - __meta_kubernetes_pod_name
        separator: '/'
        regex: 'kube-system/etcd.+'
      - source_labels:
        - __address__
        action: replace
        target_label: __address__
        regex: (.+?)(\\:\\d)?
        replacement: $1:2379
      tls_config:
        insecure_skip_verify: true
        cert_file: /opt/prometheus/secrets/server.crt
        key_file: /opt/prometheus/secrets/server.key
Code language: PHP (php)
Replace the ConfigMap with the new one that includes the etcd endpoint and recreate the Prometheus pod to apply this new configuration.
$ kubectl replace -f prometheus-server.yaml -n monitoring
$ kubectl delete pod prometheus-server-5df7b6d9bb-m2d27 -n monitoring
Now, you can check and query any of the Kubernetes etcd metrics scraped from the Prometheus server.
Monitoring etcd: Which metrics should you check?
Let’s go with the most important etcd metrics you should monitor in your Kubernetes environment.
Disclaimer: etcd metrics might differ between Kubernetes versions. Here, we used Kubernetes 1.25 and etcd 3.25. You can check the latest metrics available for etcd in the official etcd documentation.
Etcd server metrics
Following, you’ll find a summary of the key etcd server metrics. These will give you visibility on the availability of the etcd cluster.
etcd node availability: When talking about clusters, it may happen that a node goes down suddenly for any reason. So, it is always a good idea to monitor the availability of the nodes that make up the cluster. You just need to run a PromQL like the following to count how many nodes are active in your cluster.count(etcd_cluster_version)
etcd_server_has_leader: This metric indicates whether the etcd nodes have a leader or not. If the value is 1, then there is a leader in the cluster. On the other hand, if the value is 0, it means there is no leader elected in the cluster. In that case, the etcd would be not operational.# HELP etcd_server_has_leader Whether or not a leader exists. 1 is existence, 0 is not. # TYPE etcd_server_has_leader gauge etcd_server_has_leader 1
etcd_server_leader_changes_seen_total: In an etcd cluster, the leader can change automatically thanks to the RAFT algorithm. But this doesn’t necessarily mean that it is good or appropriate for the normal operation of the etcd cluster. If this metric is growing continuously over time, it could indicate a performance or network problem in the cluster.# HELP etcd_server_leader_changes_seen_total The number of leader changes seen. # TYPE etcd_server_leader_changes_seen_total counter etcd_server_leader_changes_seen_total 1
You can check the etcd leader changes within the last hour. If this number grows over time, it may similarly indicate performance or network problems in the cluster.
max(increase(etcd_server_leader_changes_seen_total[60m]))
etcd_server_proposals_committed_total: A consensus proposal is a request, like a write request to add a new configuration or track a new state. It can be a change in a configuration, like aConfigMapor any other Kubernetes object. This metric should increase over time, as it indicates the cluster is healthy and committing changes. The different nodes may report different values, but this is expected and happens for various reasons, like having to recover from peers after restarting or for being the leader and having the most commits. It is important to monitor this metric across all the etcd members since a large consistent lag between a member and its leader may indicate the node is unhealthy or having performance issues.# HELP etcd_server_proposals_committed_total The total number of consensus proposals committed. # TYPE etcd_server_proposals_committed_total gauge etcd_server_proposals_committed_total 5.234909e+06
etcd_server_proposals_applied_total: This metric records the total number of requests applied. This number may differ frometcd_server_proposals_committed_totalsince the etcd applies every commit asynchronously. This difference should be small. If it isn’t, or if it grows over time, that may indicate the etcd server is overloaded.# HELP etcd_server_proposals_applied_total The total number of consensus proposals applied. # TYPE etcd_server_proposals_applied_total gauge etcd_server_proposals_applied_total 5.234909e+06
etcd_server_proposals_pending: It indicates how many requests are queued to commit. A high number or a value growing over time may indicate there is a high load or that the etcd member cannot commit changes.# HELP etcd_server_proposals_pending The current number of pending proposals to commit. # TYPE etcd_server_proposals_pending gauge etcd_server_proposals_pending 0
etcd_server_proposals_failed_total: Failures with requests are basically due to a leader election process (where it is not able to commit changes) or a downtime caused by loss of quorum.# HELP etcd_server_proposals_failed_total The total number of failed proposals seen. # TYPE etcd_server_proposals_failed_total counter etcd_server_proposals_failed_total 0
You can monitor how many proposals failed within the last hour.
max(rate(etcd_server_proposals_failed_total[60m]))
Etcd disk metrics
Etcd is a database which stores Kubernetes objects status and definitions, configurations, etc. As a persistent database, it needs to back this data up in storage. Monitoring the etcd disk metrics is key to get a better understanding about how the etcd is performing, and to anticipate any problem that may come up.
High latencies in both metrics may indicate disk issues, and may cause a high latency on etcd requests or even make the cluster unstable and/or unavailable.
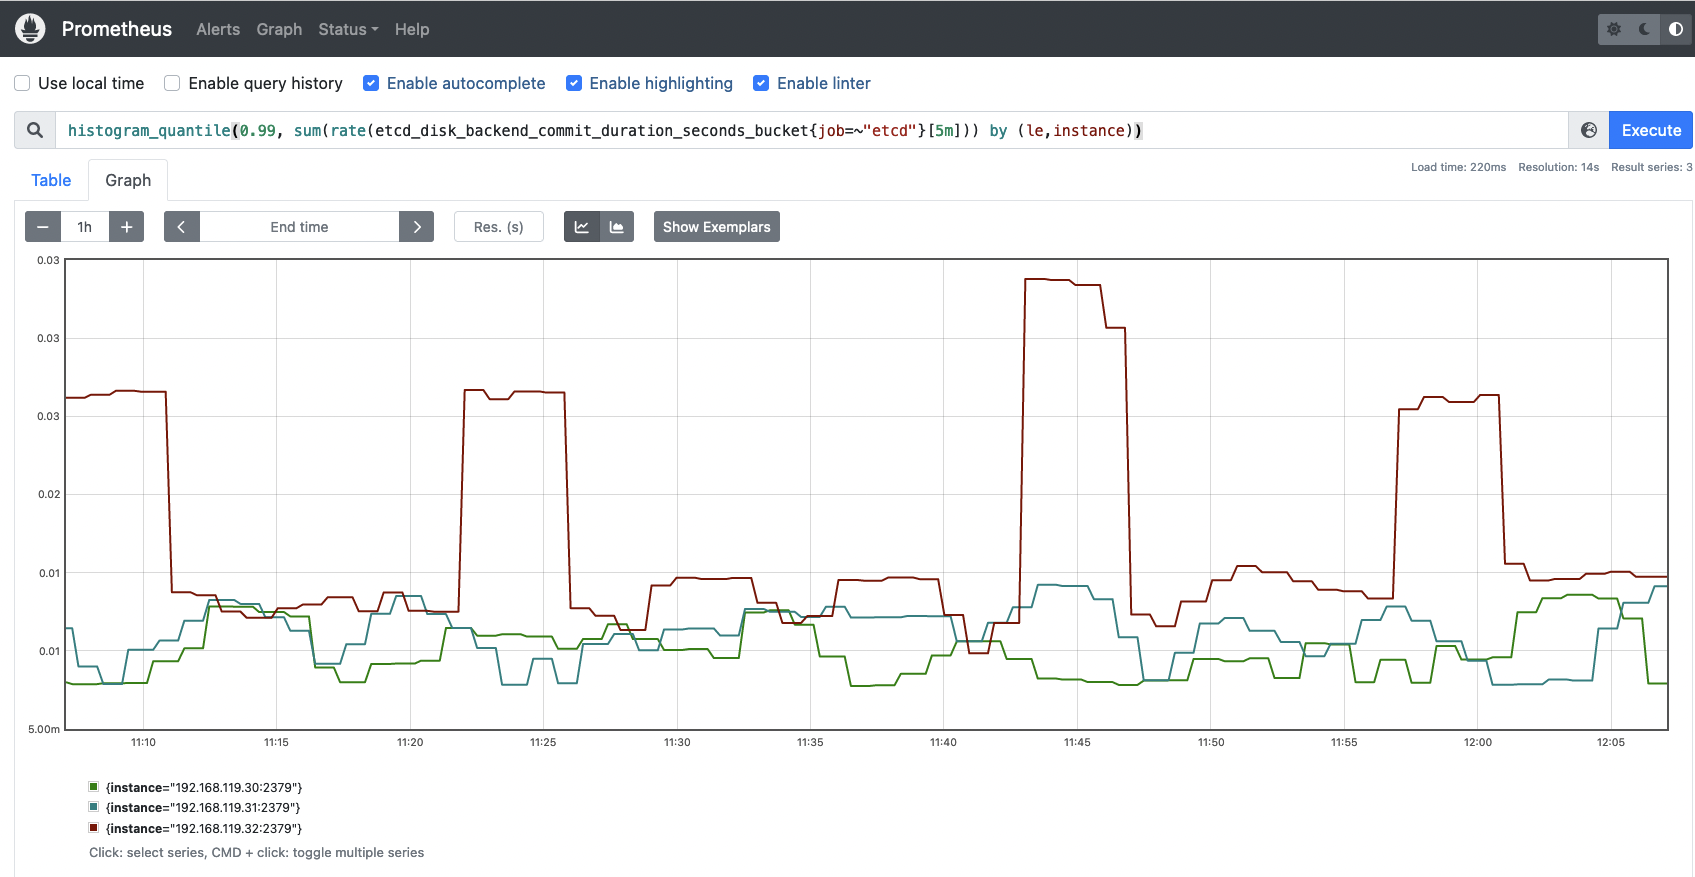
etcd_disk_wal_fsync_duration_seconds_bucket: This metric represents the latencies of persisting (fsync operation) its etcd log entries/WAL (write ahead of log) to disk before applying them.# HELP etcd_disk_wal_fsync_duration_seconds The latency distributions of fsync called by WAL. # TYPE etcd_disk_wal_fsync_duration_seconds histogram etcd_disk_wal_fsync_duration_seconds_bucket{le="0.001"} 0 etcd_disk_wal_fsync_duration_seconds_bucket{le="0.002"} 3539 etcd_disk_wal_fsync_duration_seconds_bucket{le="0.004"} 5960 etcd_disk_wal_fsync_duration_seconds_bucket{le="0.008"} 7827 etcd_disk_wal_fsync_duration_seconds_bucket{le="0.016"} 8999 etcd_disk_wal_fsync_duration_seconds_bucket{le="0.032"} 9234 etcd_disk_wal_fsync_duration_seconds_bucket{le="0.064"} 9259 etcd_disk_wal_fsync_duration_seconds_bucket{le="0.128"} 9261 etcd_disk_wal_fsync_duration_seconds_bucket{le="0.256"} 9261 etcd_disk_wal_fsync_duration_seconds_bucket{le="0.512"} 9261 etcd_disk_wal_fsync_duration_seconds_bucket{le="1.024"} 9261 etcd_disk_wal_fsync_duration_seconds_bucket{le="2.048"} 9261 etcd_disk_wal_fsync_duration_seconds_bucket{le="4.096"} 9261 etcd_disk_wal_fsync_duration_seconds_bucket{le="8.192"} 9261 etcd_disk_wal_fsync_duration_seconds_bucket{le="+Inf"} 9261 etcd_disk_wal_fsync_duration_seconds_sum 43.74130124199982 etcd_disk_wal_fsync_duration_seconds_count 9261etcd_disk_backend_commit_duration_seconds_bucket: Latencies while etcd is committing an incremental snapshot of its most recent changes to disk.# HELP etcd_disk_backend_commit_duration_seconds The latency distributions of commit called by backend. # TYPE etcd_disk_backend_commit_duration_seconds histogram etcd_disk_backend_commit_duration_seconds_bucket{le="0.001"} 0 etcd_disk_backend_commit_duration_seconds_bucket{le="0.002"} 0 etcd_disk_backend_commit_duration_seconds_bucket{le="0.004"} 3970 etcd_disk_backend_commit_duration_seconds_bucket{le="0.008"} 4721 etcd_disk_backend_commit_duration_seconds_bucket{le="0.016"} 4860 etcd_disk_backend_commit_duration_seconds_bucket{le="0.032"} 4886 etcd_disk_backend_commit_duration_seconds_bucket{le="0.064"} 4895 etcd_disk_backend_commit_duration_seconds_bucket{le="0.128"} 4896 etcd_disk_backend_commit_duration_seconds_bucket{le="0.256"} 4896 etcd_disk_backend_commit_duration_seconds_bucket{le="0.512"} 4896 etcd_disk_backend_commit_duration_seconds_bucket{le="1.024"} 4896 etcd_disk_backend_commit_duration_seconds_bucket{le="2.048"} 4896 etcd_disk_backend_commit_duration_seconds_bucket{le="4.096"} 4896 etcd_disk_backend_commit_duration_seconds_bucket{le="8.192"} 4896 etcd_disk_backend_commit_duration_seconds_bucket{le="+Inf"} 4896 etcd_disk_backend_commit_duration_seconds_sum 18.608936315999987 etcd_disk_backend_commit_duration_seconds_count 4896To know if the latency of the backend commits are good enough, you can visualize in a histogram. Run the following PromQL query and get the time latency in which 99% of requests are covered.
histogram_quantile(0.99, sum(rate(etcd_disk_backend_commit_duration_seconds_bucket{job=~"etcd"}[5m])) by (le,instance))
Etcd network metrics
This section describes the best metrics you can use to monitor the network status and activity around your etcd cluster.
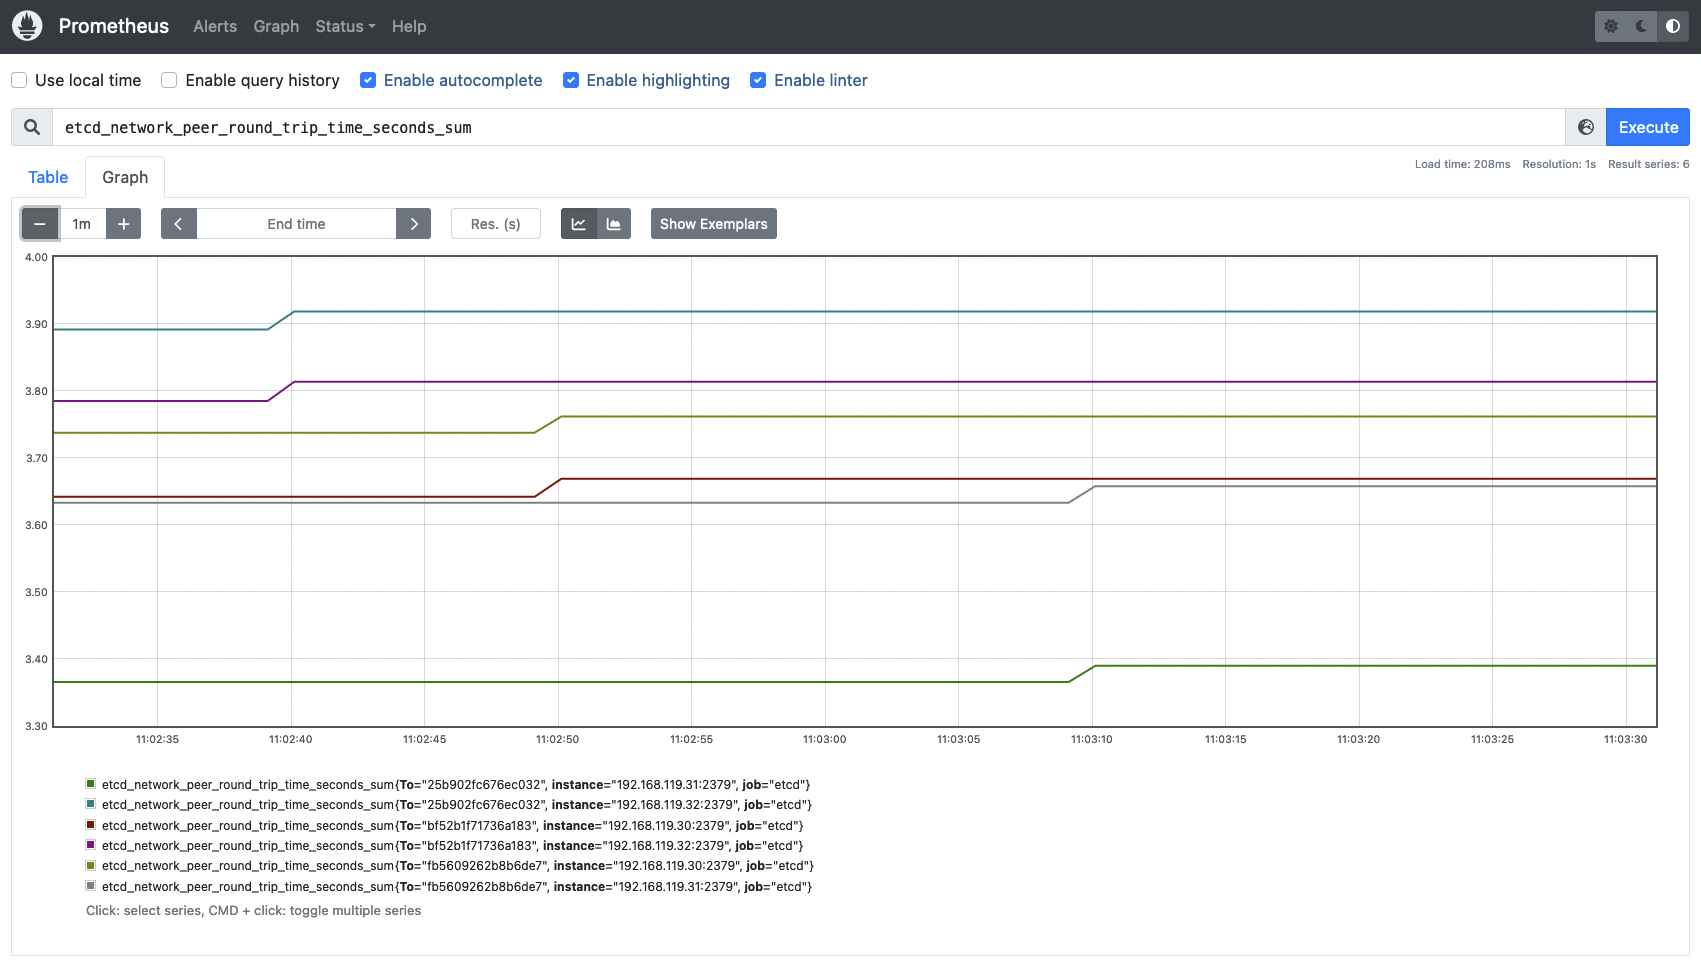
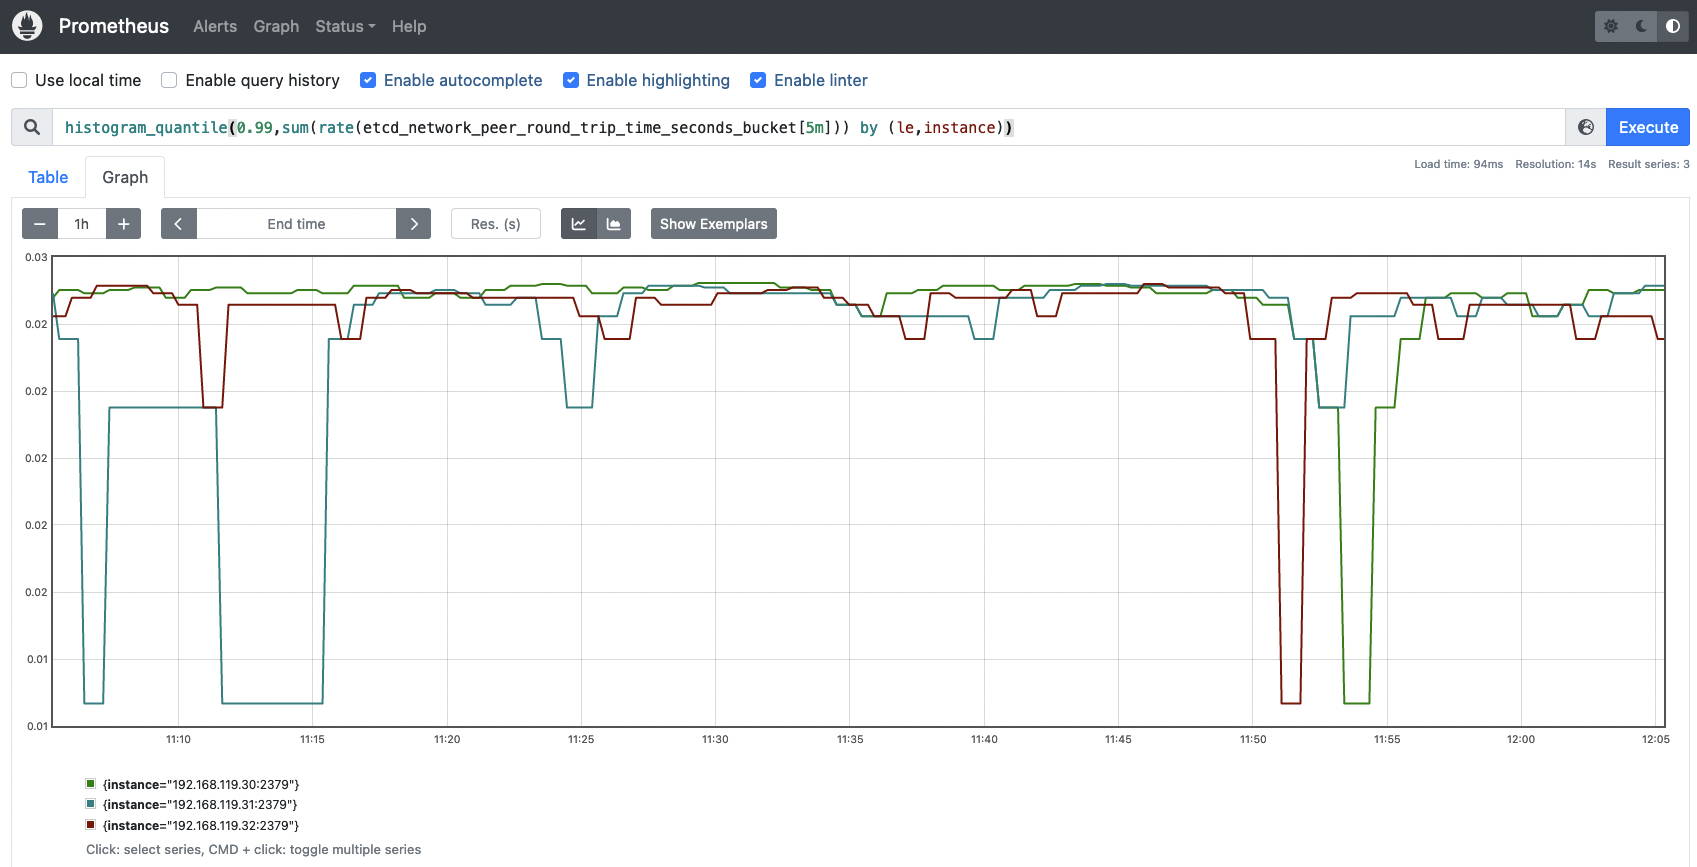
etcd_network_peer_round_trip_time_seconds_bucket: This metric is key and extremely important to measure how your network and etcd nodes are performing. It indicates the RTT (round trip time) latency for etcd to replicate a request between etcd members. A high latency or latencies growing over time may indicate issues in your network, causing serious trouble with etcd requests and even losing quorum. There is one complete histogram per communication (from peer to peer). This value should not exceed 50ms (0.050s).# HELP etcd_network_peer_round_trip_time_seconds Round-Trip-Time histogram between peers # TYPE etcd_network_peer_round_trip_time_seconds histogram etcd_network_peer_round_trip_time_seconds_bucket{To="bf52b1f71736a183",le="0.0001"} 0 etcd_network_peer_round_trip_time_seconds_bucket{To="bf52b1f71736a183",le="0.0002"} 0 etcd_network_peer_round_trip_time_seconds_bucket{To="bf52b1f71736a183",le="0.0004"} 0 etcd_network_peer_round_trip_time_seconds_bucket{To="bf52b1f71736a183",le="0.0008"} 46 etcd_network_peer_round_trip_time_seconds_bucket{To="bf52b1f71736a183",le="0.0016"} 55 etcd_network_peer_round_trip_time_seconds_bucket{To="bf52b1f71736a183",le="0.0032"} 59 etcd_network_peer_round_trip_time_seconds_bucket{To="bf52b1f71736a183",le="0.0064"} 59 etcd_network_peer_round_trip_time_seconds_bucket{To="bf52b1f71736a183",le="0.0128"} 112 etcd_network_peer_round_trip_time_seconds_bucket{To="bf52b1f71736a183",le="0.0256"} 116 etcd_network_peer_round_trip_time_seconds_bucket{To="bf52b1f71736a183",le="0.0512"} 116 etcd_network_peer_round_trip_time_seconds_bucket{To="bf52b1f71736a183",le="0.1024"} 116 etcd_network_peer_round_trip_time_seconds_bucket{To="bf52b1f71736a183",le="0.2048"} 116 etcd_network_peer_round_trip_time_seconds_bucket{To="bf52b1f71736a183",le="0.4096"} 116 etcd_network_peer_round_trip_time_seconds_bucket{To="bf52b1f71736a183",le="0.8192"} 116 etcd_network_peer_round_trip_time_seconds_bucket{To="bf52b1f71736a183",le="1.6384"} 116 etcd_network_peer_round_trip_time_seconds_bucket{To="bf52b1f71736a183",le="3.2768"} 116 etcd_network_peer_round_trip_time_seconds_bucket{To="bf52b1f71736a183",le="+Inf"} 116 etcd_network_peer_round_trip_time_seconds_sum{To="bf52b1f71736a183"} 0.7280363210000003 etcd_network_peer_round_trip_time_seconds_count{To="bf52b1f71736a183"} 116To know if the RTT latencies between etcd nodes are good enough, run the following query to visualize the data in a histogram.
histogram_quantile(0.99, sum(rate(etcd_network_peer_round_trip_time_seconds_bucket[5m])) by (le,instance))
etcd_network_peer_sent_failures_total: This metric provides the total number of failures sent by peer or etcd members. It can help you understand better whether a specific node is facing performance or network issues.etcd_network_peer_received_failures_total: In the same way the previous metric provided sent failures, this time, what is measured is the total received failures by peers.
Conclusion
Etcd is a key component of Kubernetes. Without an etcd up and running, your Kubernetes cluster will not persist any change and no new Pods will be scheduled.
Monitoring etcd is a complex topic. While etcd exposes its metrics endpoint out of the box, there is not much documentation and public knowledge about what the key etcd metrics are, and what the appropriate or expected values you should expect for a healthy environment are.
In this article, you have learned how to monitor your etcd cluster and how to scrape its metrics from a Prometheus instance. In terms of etcd metrics, you have learned more about what you should look for, and how to measure the availability and performance of your etcd cluster.
Monitor Kubernetes and troubleshoot issues up to 10x faster
Sysdig can help you monitor and troubleshoot your Kubernetes cluster with the out-of-the-box dashboards included in Sysdig Monitor. Advisor, a tool integrated in Sysdig Monitor accelerates troubleshooting of your Kubernetes clusters and its workloads by up to 10x.
Sign up for a 30-day trial account and try it yourself!