
After trying several Prometheus exporters, I think I’m ready to fight the final boss: Monitoring a Windows cluster with Prometheus. I need a dashboard where I can monitor all the Windows machines in a single pane of glass. Let’s do it.
Prometheus remote write to the rescue
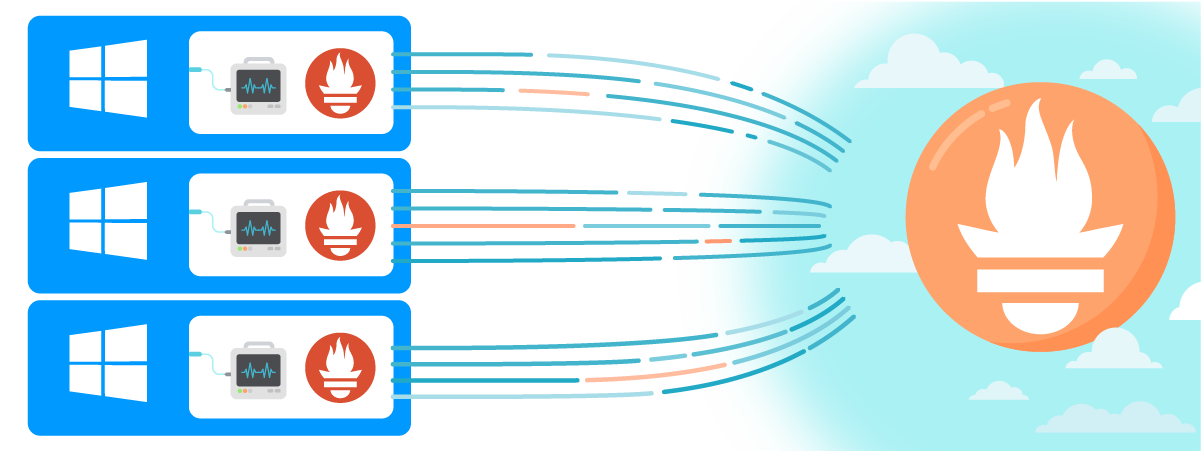
Since I need to centralize all the metrics into one Prometheus server, I’m going to install small Prometheus instances in each Windows machine. These small Prometheus instances will be the clients that send metrics from the exporter to the Prometheus server. This way I’ll centralise all the metrics when monitoring Windows with Prometheus
I love how Prometheus remote write allows the sending of metrics directly to the Prometheus server. You don’t even need a Prometheus in the middle to do this – you just have to send your metrics to an HTTP endpoint. No configuration is needed in the central Prometheus since Prometheus remote write works out-of-the-box.
Another thing I love about using Prometheus remote write is that I can start each client Prometheus with the flag --storage.tsdb.retention.time=1d, so they only store the metrics for one day. This way, I can run Prometheus without worrying about the storage usage on each instance.
Install and configure the exporter
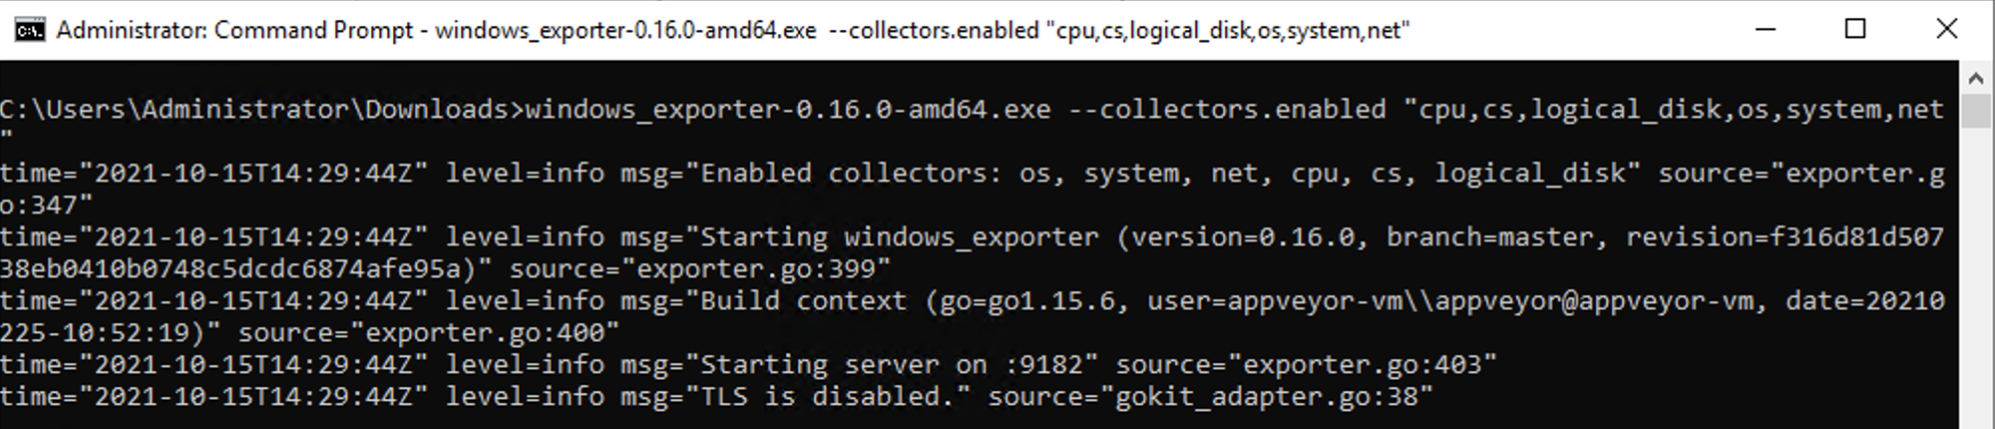
For monitoring Windows with Prometheus, I’ll install the Windows exporter first, which is the Node exporter equivalent for Windows. This exporter will start an HTTP endpoint, exposing all the metrics in the local Windows instance so the client Prometheus can access them.
I just need to download the latest version of the exporter, uncompress it, open the folder in a terminal window, and run the following command:
windows_exporter-0.16.0-amd64.exe --collectors.enabled "cpu,cs,logical_disk,os,system,net"
The exporter is now working. Next, I need to tell Prometheus to scrape the exporter by adding this inside the scrape_configs array:
  - job_name: "windows_exporter"
    static_configs:
      - targets: ["localhost:9182"]
We’re almost there. The next step is to configure Prometheus remote write by adding this in the root config.
remote_write:
  - url: "https://<PROMETHEUS_SERVER>/prometheus/remote/write"
    tls_config:
      insecure_skip_verify: true
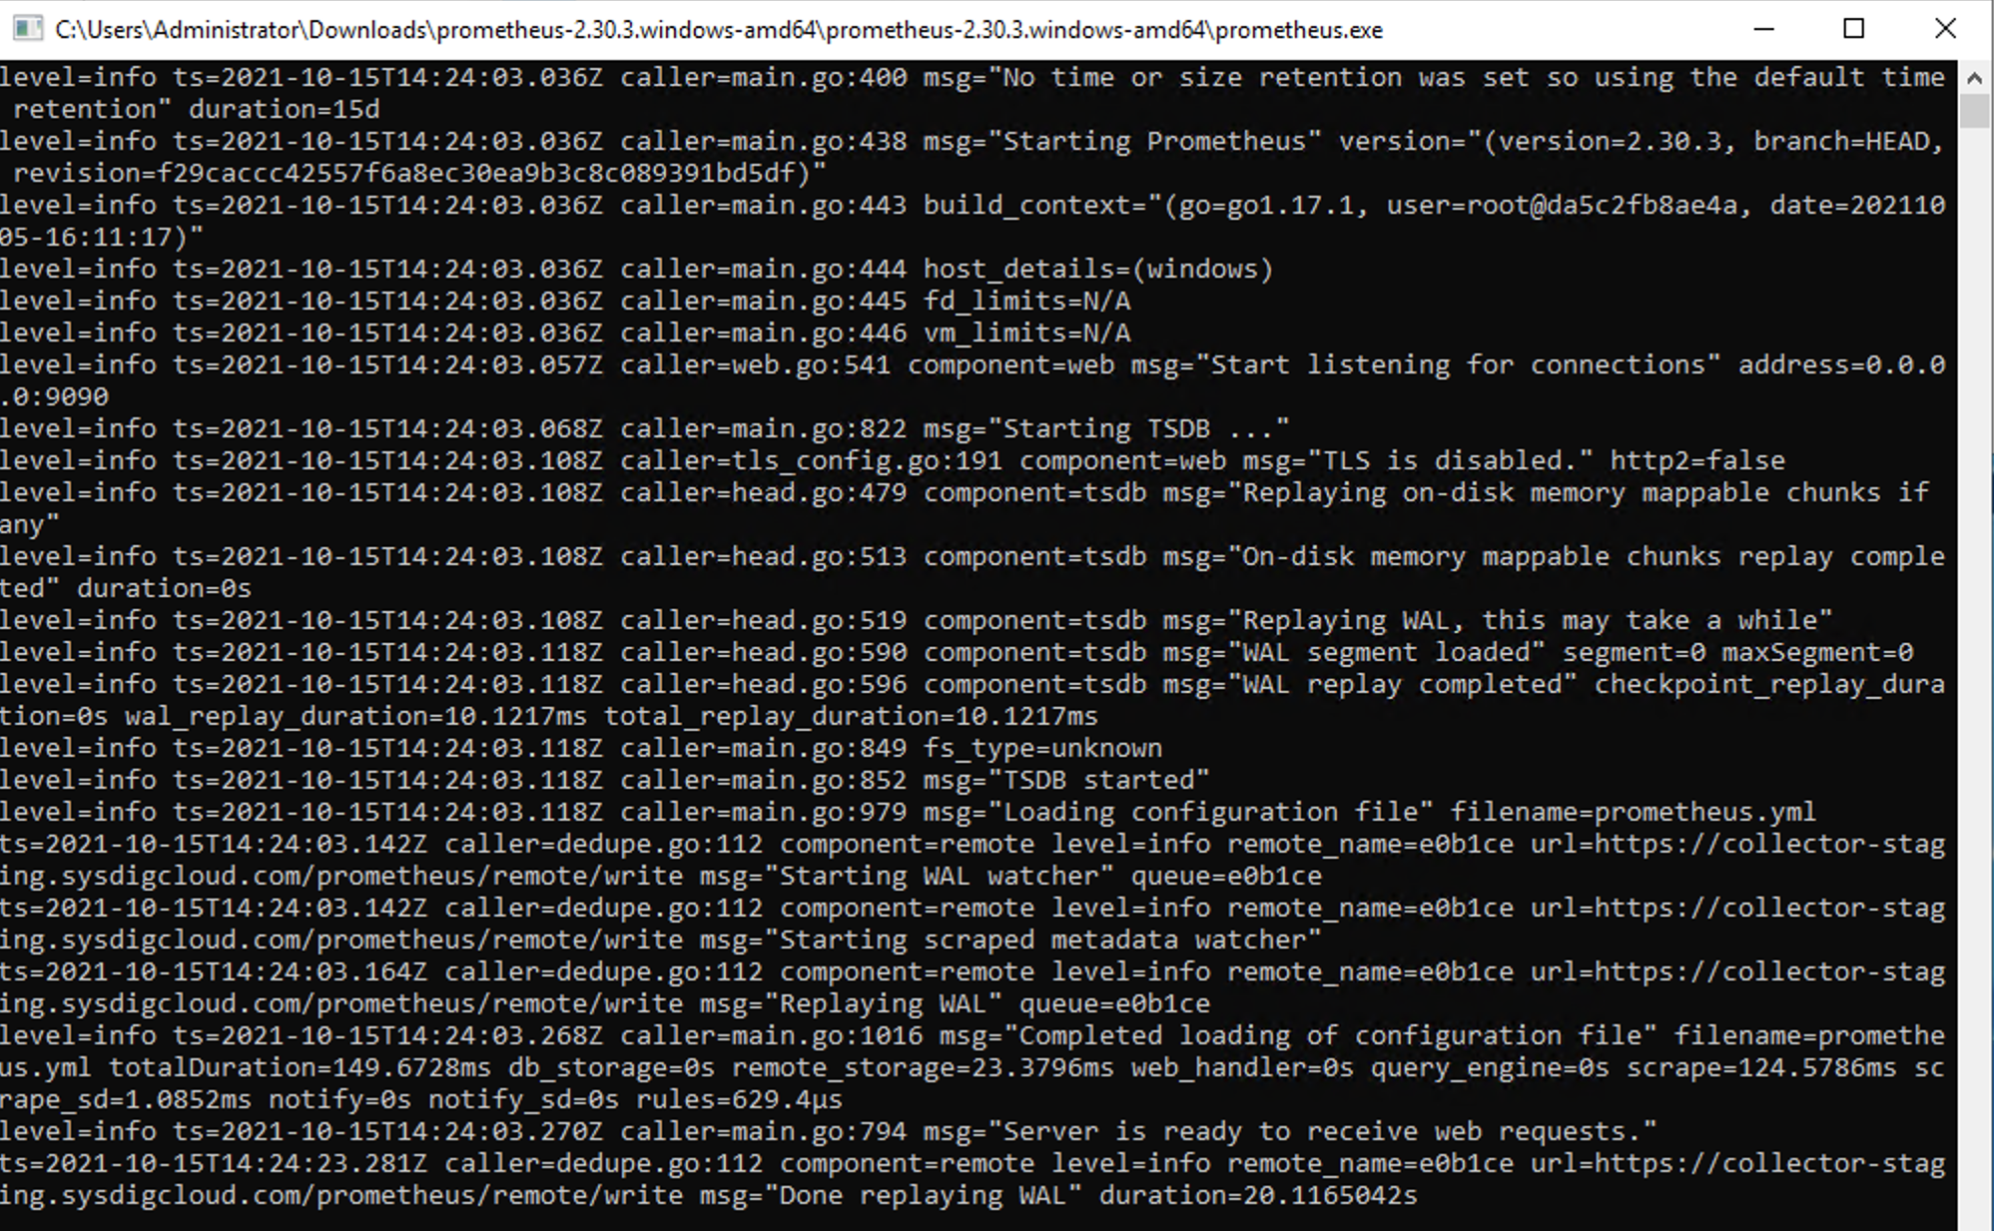
Now, just run Prometheus in the terminal with:
prometheus.exe --storage.tsdb.retention.time=1d
And it’ll start sending all the metrics to the Prometheus server.
Running Prometheus with the
--storage.tsdb.retention.time=1d flag configures retention time for metrics to just one day.
Since I’m pushing all the metrics to the Prometheus server through the remote write endpoint, I don’t need to also store them in each middle Prometheus instance.
Setting the right labels
I want to be smart when creating labels. When I have my dashboard, I want to not only filter by instance but by availability zone, environment (development, staging…), or cloud account.
This is how I’m using external labels to send, with each metric, the information related to the AZ, environment, or cloud account. I’m adding this inside the global configuration:
  external_labels:
    cloud-account: aws-dev-1
    cloud-region: us-east-1
    cloud-az: use1-az1
    environment: staging
Please, remember to restart Prometheus if you change the configuration file.
What do you think?
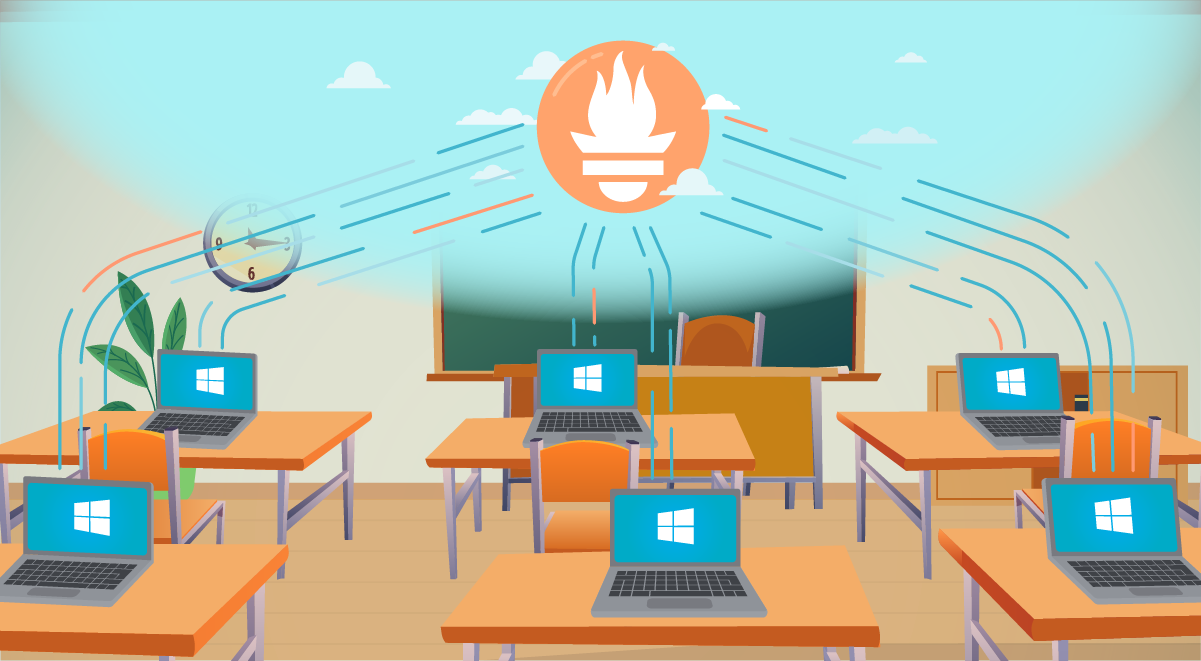
How are you monitoring Windows with Prometheus? In this article, I showed you the best solution I found for this use case. It works well and allows me to have the cluster’s entire information in one dashboard.
Don’t hesitate to ping us @sysdig if you do this differently!
Do you need enterprise-grade managed Prometheus?
Register now for the free Sysdig Monitor trial and start taking advantage of its Managed Prometheus service. Try our Prometheus integrations or send metrics through Prometheus Remote Write in minutes!