
We are really happy to announce that we have released a plugin which allows to take captures using Sysdig in your Kubernetes cluster with just one simple command. And the answer for the next question you are asking yourself, is no. You don’t need to have Sysdig preinstalled in your cluster for this to work! This is our contribution to help you with your Kubernetes troubleshooting efforts. Do you have troubles troubleshooting #Kubernetes deployed applications? Learn how to do it with just one command using our #kubectl capture plugin! Click to tweet Once you have the capture file with a ton of data about your containers and its behavior you will use Sysdig Inspect to debug or doing some kind of performance analysis or even a forensic analysis to fill out a post mortem report and improve you learning and knowledge about how your microservices are behaving.
Installing the kubectl plugin
Before installing, make sure you can use this plugin. Check that you are using a modern kubectl version (1.12.0 or greater). Although plugins were officially introduced as an alpha feature in the v1.8.0 release, the kubernetes folks recommends a 1.12.0 or later version for using plugins. Once you check all prerequisites, the next step is installing the plugin, so you will need to get the repository from GitHub or just the plugin file and place it in your PATH, in this example I’m going to put it under/usr/local/bin.
$ git clone https://github.com/sysdiglabs/kubectl-capture.git
$ cd kubectl-capture
$ sudo cp kubectl-capture /usr/local/bin
Or directly using
wget:
$ sudo wget https://raw.githubusercontent.com/sysdiglabs/kubectl-capture/master/kubectl-capture -O /usr/local/bin/kubectl-capture
$ sudo chmod +x /usr/local/bin/kubectl-capture
Once, the file is in your PATH you can check the installation with the following command:
$ kubectl plugin list
The following kubectl-compatible plugins are available:

/usr/local/bin/kubectl-capture
Hooray, our kubectl plugin is ready.
Troubleshooting a containerized application
As we stated before, troubleshooting a Kubernetes CrashLoopBackOff is one of the most annoying things you can find in a Kubernetes cluster. It’s happened to all of us at least once and as we have no access to troubleshooting tools inside the container, it becomes a real nightmare. Something similar happens with other application errors where we don’t have access to troubleshooting tools inside the container. We have the following application deployed in our Kubernetes cluster:$ kubectl get pod -n ticket-generator NAME READY STATUS RESTARTS AGE ticket-balancer-5967c66fb4-qnzj6 1/1 Running 0 6m ticket-client-68df494585-ntqls 1/1 Running 0 6m ticket-server-56c75bf88b-nqpcs 1/1 Running 0 6m ticket-server-56c75bf88b-wjsw2 1/1 Running 0 6mAnd since our last deployment, as we are monitoring the application, we start noticing about several 502 HTTP errors which are causing problems to our customers. We start digging a bit and we can confirm the 502 errors looking into some logs:
$ kubectl logs -n ticket-generator ticket-client-68df494585-ntqls
...
100   107   0   107 0   0   7642    0 --:--:-- --:--:-- --:--:--  7642
% Total % Received % Xferd  Average Speed   Time    Time    Time  Current
Dload  Upload   Total   Spent   Left  Speed
<html><body><h1>502 Bad Gateway</h1>
The server returned an invalid or incomplete response.
</body></html>
So yes, the 502 error is there, we are going to dig a bit deeper checking the logs of the balancer:
$ kubectl logs -n ticket-generator ticket-balancer-5967c66fb4-qnzj6Great, we don’t have logs from the load balancer. This makes our troubleshooting harder. Let’s go deeper:
$ kubectl logs -n ticket-generator ticket-server-56c75bf88b-wjsw2
...
10.40.1.6 - - [14/Feb/2019 11:05:29] "GET /getticket HTTP/1.1" 200 -
10.40.1.6 - - [14/Feb/2019 11:05:32] "GET /getticket HTTP/1.1" 200 -
Umm, this is strange, we are receiving 200 from the application. What’s happening under the hood, inside the load balancer? The situation is partially under control, we can rollback the deployment and go to a previous version but just looking at the logs don’t have enough data to determine the root cause. We need to address the most important question: Why is this deployment failing? Because of the 502 errors. But why are these errors happening?
Start to capture data with the kubectl plugin
We need to dig deeper for a better understanding of the application and to put some light in the dark world of the load balancer. Let’s do that:$ kubectl capture ticket-balancer-5967c66fb4-qnzj6 -ns ticket-generator -M 30 --snaplen 256 Sysdig is starting to capture system calls: Node: gke-sysdig-work-default-pool-0ed2e258-xtwv Pod: ticket-balancer-5967c66fb4-qnzj6 Duration: 30 seconds Parameters for Sysdig: -S -M 30 -pk -z -w /capture-ticket-balancer-5967c66fb4-qnzj6-1550246858.scap.gz --snaplen 256 The capture has been downloaded to your hard disk at: ~/captures/capture-ticket-balancer-5967c66fb4-qnzj6-1550246858.scap.gzWith just one simple command we have started to capture all activity related to the load balancer, so now it’s time to troubleshoot with Sysdig Inspect.
Capturing system calls using eBPF probe instead of kernel module
As some of you already know, we can use eBPF as core instrumentation technology for capturing the system calls. Extended Berkeley Packet Filter (eBPF) is a modern and powerful technology used in the Linux kernel for a wide variety of applications, including networking and tracing. This is pretty useful in those systems which doesn’t allow to use the kernel module technology. A well known case is a GKE cluster which uses COS instead of Ubuntu image for the nodes. In order to enable eBPF we need a recent Linux kernel (4.14+) with eBPF support and let the plugin to do the rest of magic:$ kubectl capture ticket-balancer-5967c66fb4-qnzj6 -ns ticket-generator --ebpf -M 30 --snaplen 256 Sysdig is starting to capture system calls: Node: gke-sysdig-work-default-pool-0ed2e258-xtwv Pod: ticket-balancer-5967c66fb4-qnzj6 Duration: 30 seconds Parameters for Sysdig: -S -M 30 -pk -z -w /capture-ticket-balancer-5967c66fb4-qnzj6-1550246858.scap.gz --snaplen 256 The capture has been downloaded to your hard disk at: ~/captures/capture-ticket-balancer-5967c66fb4-qnzj6-1550246858.scap.gzAnd that’s all, with just the **–ebpf **flag the plugin uses the eBPF technology.
Augmenting the amount of tracing data
One interesting thing is the--snaplen 256flag. The snaplen allows to capture the first bytes of each I/O buffer. By default only the 80 first bytes are captured but sometimes you are going to need more context in your captures. Use this with caution because it can generate huge trace files. But if you want to go one step further, the kubectlplugin accepts the same parameters that sysdig command line utility does, so you can use all the options available for the command line application, including filters, in this kubectlplugin.
What did happen here?
Under the hood, the kubectl plugin starts a new pod in the same host that the pod we specified in the command line, so that we can see everything that is happening right now in that host. Sysdig has also an awesome support to see what’s happening inside the containers, and we are going to take advantage of that feature.$ kubectl get pod --all-namespaces NAMESPACE NAME READY STATUS RESTARTS AGE default capture-ticket-balancer-5967c66fb4-qnzj6-1550246858 1/1 Running 0 2mNotice that we specified a duration of 30 seconds of the capture and the pod is running more time than the 30 seconds. This is because the pod needs to build the Sysdig Kernel module and it takes some time until the capture starts.
Using the capture to analyze with Sysdig Inspect
Sysdig Inspect is an Open Source application which makes Sysdig shine. Is impressive how it organizes a huge amount of information about system calls, how it correlates activities and how simplifies the troubleshooting activity. Once the capture has finished, it drops the capture file to our local disk. So we can load the downloaded capture in Sysdig Inspect: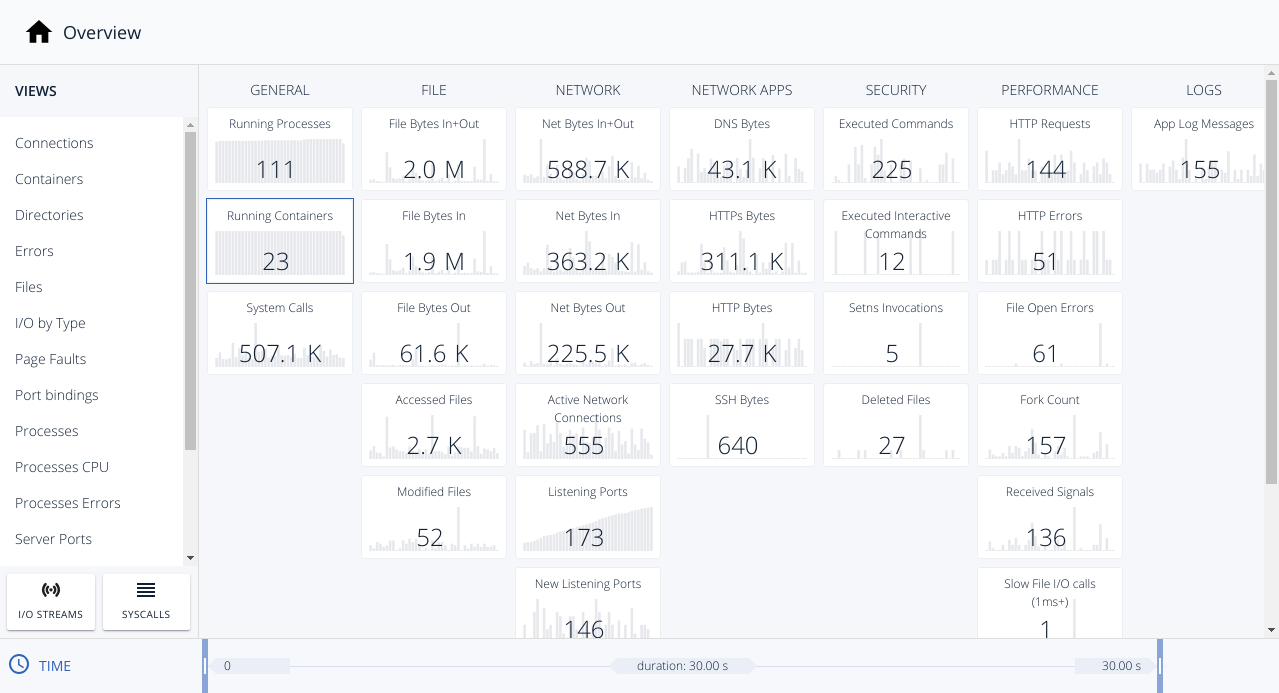 And we are going to filter by containers to reduce the scope to the load balancer.
 And once, we selected the container, we open its I/O Streams and read the conversation using the “Printable ASCII”:
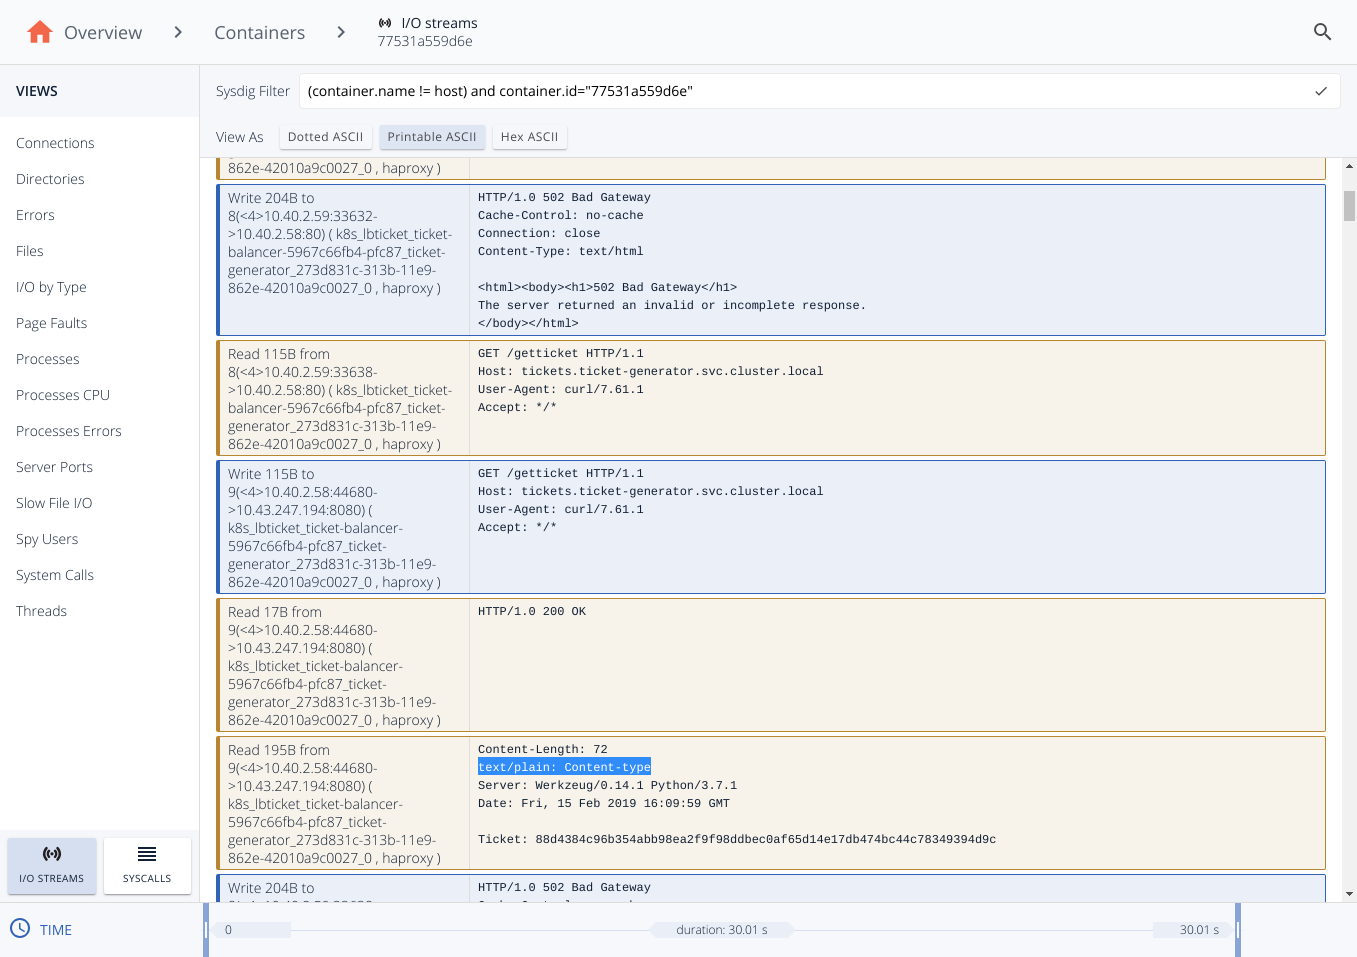 And now we can see the full HTTP conversation that the load balancer container have had with the backend servers, and there’s the clue about the 502 error. Let me explain.
Blue rows mean that we are sending a message, a write syscall, while the orange one represent a received message (a read syscall). So we can reconstruct the complete conversation:
And now we can see the full HTTP conversation that the load balancer container have had with the backend servers, and there’s the clue about the 502 error. Let me explain.
Blue rows mean that we are sending a message, a write syscall, while the orange one represent a received message (a read syscall). So we can reconstruct the complete conversation:
- 1st row: The load balancer sends a 502 error.
- 2nd row: The load balancer reads the request query to the backend.
- 3nd row: The load balancer sends the request query to the backend.
- 4nd, 5th row: The load balancer receives body response from the backend.
- The balancer receives the response from the backend servers. The body is correct but the headers have a format which is not valid. The
text/plain: Content-typeheader should be insteadContent-type: text/plain. - While this is ignored by some browsers (that’s why it worked in the developer’s laptop) and some HTTP proxies will be able to tolerate this invalid message, the HAproxy that we are using doesn’t tolerate this and returns a 502 HTTP error.
- The client receives the 502 Bad Gateway HTTP error.