
Introduction
We announced our support for Cassandra a few months back, but here at Sysdig, our engineering team has been using our Cassandra dashboards since well before the public release. We use Cassandra in our own Sysdig Cloud infrastructure, so our engineers tend to be quite opinionated about what should be included in an effective Cassandra monitoring solution. In this post, I wanted to start by digging into specific metrics that we recommend anyone running a Cassandra cluster should monitor, then I’ll share a real world example of how Sysdig Cloud helped us solve an actual issue within our own Cassandra cluster.
Key Cassandra Metrics to Monitor
Speaking from our own experience monitoring Cassandra, we believe these are the most useful metrics for any Cassandra user to start monitoring today so you can properly analyze the performance of your Cassandra deployment.
Read / Write Requests:
You always need to keep an eye of the read / write activity to make sure that these metrics fall within the limits of how your application typically behaves.
Read / Write Latency:
This shows the time required for a query to be executed. This is important because it gives you an idea of how the app is performing and this is a good leading indicator of system-wide slow downs. Latency can provide an early warning sign for performance issues due to increased load, or abrupt system activity in the environment like a heavy garbage collection or an increased number of compactions.
Disk Used:
This is a good way to analyze disk usage across an entire Cassandra cluster, and you can also view it by node to see if there is an outlier. If one node isn’t keeping up with compactions for example, you’d see disk usage spiking in that case.
CPU %:
This is a pretty general metric, but valuable nonetheless. This metric allows you to view the CPU you are utilizing across your Cassandra cluster or individual nodes.
Network Bytes Activity:
The Network Bytes activity is a good way to surface problems like a misconfiguration in a particular node. NoSQL databases like Cassandra can handle a lot of data, and when bootstrapping new nodes in the cluster at the same time, a whole lot of data can be requested and dispatched to all of the nodes which can easily overload the entire network. You can see when the migration is over, indicated by a big spike in the network that then goes down.
File Bytes:
Similar to network bandwidth, the file bytes chart is useful for analyzing things like the compaction throughput setting you should use. If you take the file bytes throughput as the baseline, a rule of thumb we’re using internally is the compaction setting should be 2-3x that baseline number.
Heap Usage:
This is an important data point since Cassandra is a Java application and you have to be really careful when measuring the heap size. Heap should be allocated to a reasonable amount based on the size of your machine. Keep in mind Cassandra uses a lot of memory for internal caches, so monitoring heap usage across your Cassandra deployment and making sure it stays within a safe distance of your ceiling is of the utmost importance.
Garbage Collection Times:
Using this metric you can spot the difference between garbage collection algorithms and how long they are taking to finish.
Hinted Handoff Pending:
This is an important but often overlooked metric. Hinted handoff pending refers to the data that will be sent to a node once it comes back online after going down. Sometimes when these nodes come back, they generate a huge burst of activity as the hinted handoffs actually get sent to these nodes. Without looking at this type of metric, it would be hard to understand what that burst of activity was caused by.
Compactions:
Since Cassandra by default limits the amount of disk bandwidth it devotes to compaction, viewing this metric can surface compaction configurations that don’t actually keep up with the rate of ingestion, which will negatively impact performance.
Monitoring Cassandra The Easy Way: With Sysdig Cloud
No matter what tool you are using to monitor your Cassandra deployment, these are the top metrics that we highly recommend you keep an eye on. But for Sysdig Cloud users who want to monitor Cassandra, we’ve made it especially easy: we’ve created a custom view that combines all of these metrics into a single dashboard that comes built-in with Sysdig Cloud.
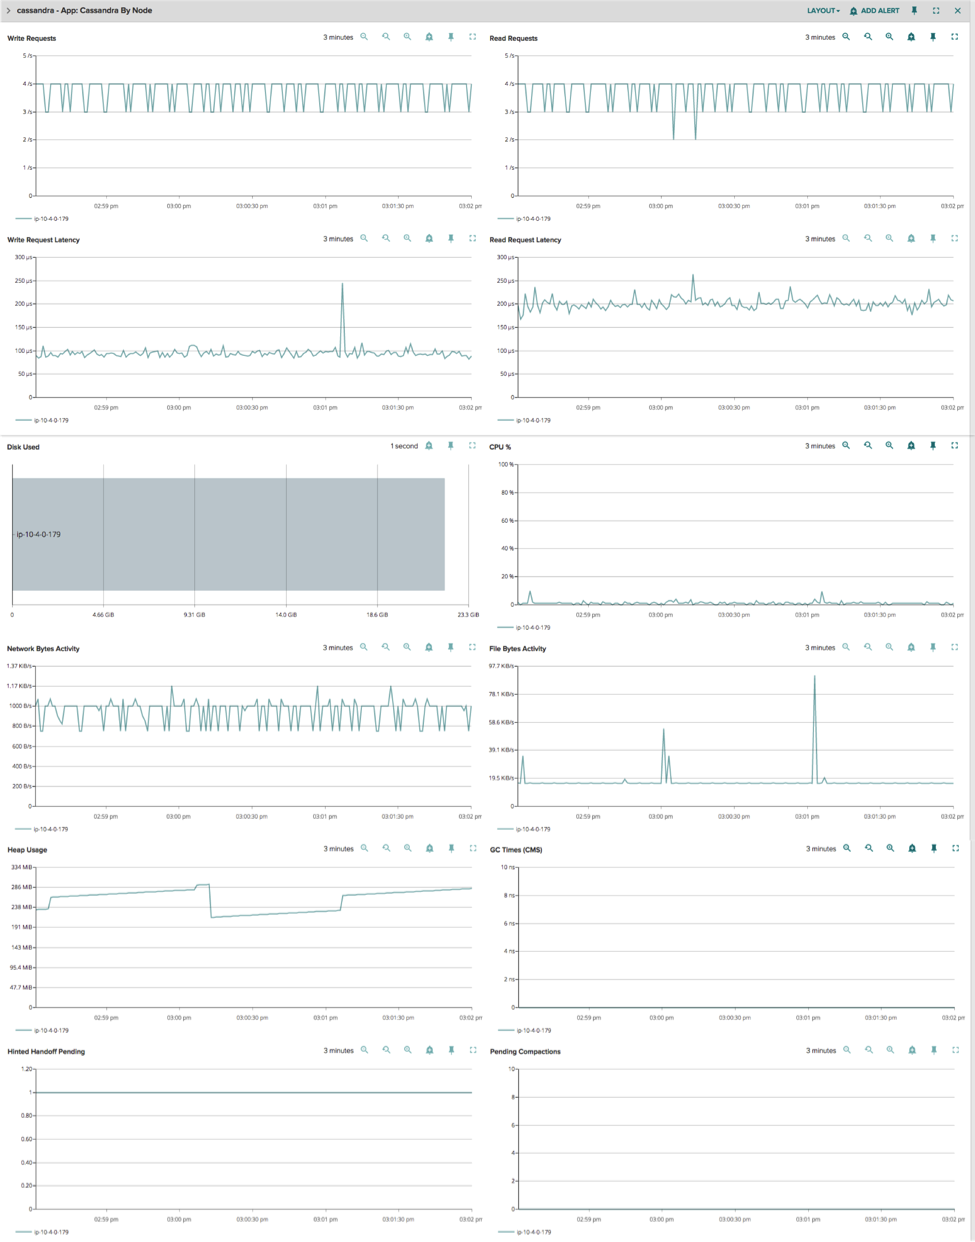
Sysdig Cloud also provides Cassandra users a number of unique features that can make the management of your Cassandra deployment much, much easier:
Segment Cassandra metrics by cluster or node
Sysdig Cloud has pre-built views for Cassandra metrics grouped by cluster and by node. By being able to quickly switch between cluster and node views you can easily identify whether performance issues are happening across your cluster or limited to a single Cassandra node. This is just another way we help users rapidly identify the root cause of performance issues.
Automatic correlation to your applications and the rest of your infrastructure
Because Sysdig Cloud collects metrics from across your environment, we automatically correlate your Cassandra metrics with your application and infrastructure metrics to give you comprehensive visibility across your entire environment. All this without having to install any additional plugins or do any additional configuration. Just install Sysdig Cloud on your host or in a separate container and we’ll automatically detect Cassandra is running and start pulling the appropriate Cassandra-related metrics. You can see these Cassandra metrics right alongside the rest of your performance related metrics to help streamline the troubleshooting process.
It even works in containers!
Running Cassandra in containers? No problem. If you are running Cassandra inside containers, you don’t have to do any extra configuration work for Sysdig Cloud to detect Cassandra running inside the container and automatically start pulling Cassandra metrics. With our core ContainerVision™ technology, we can automatically detect application technologies like Cassandra running inside containers and start collecting the right data. Monitoring your containerized applications has never been easier!
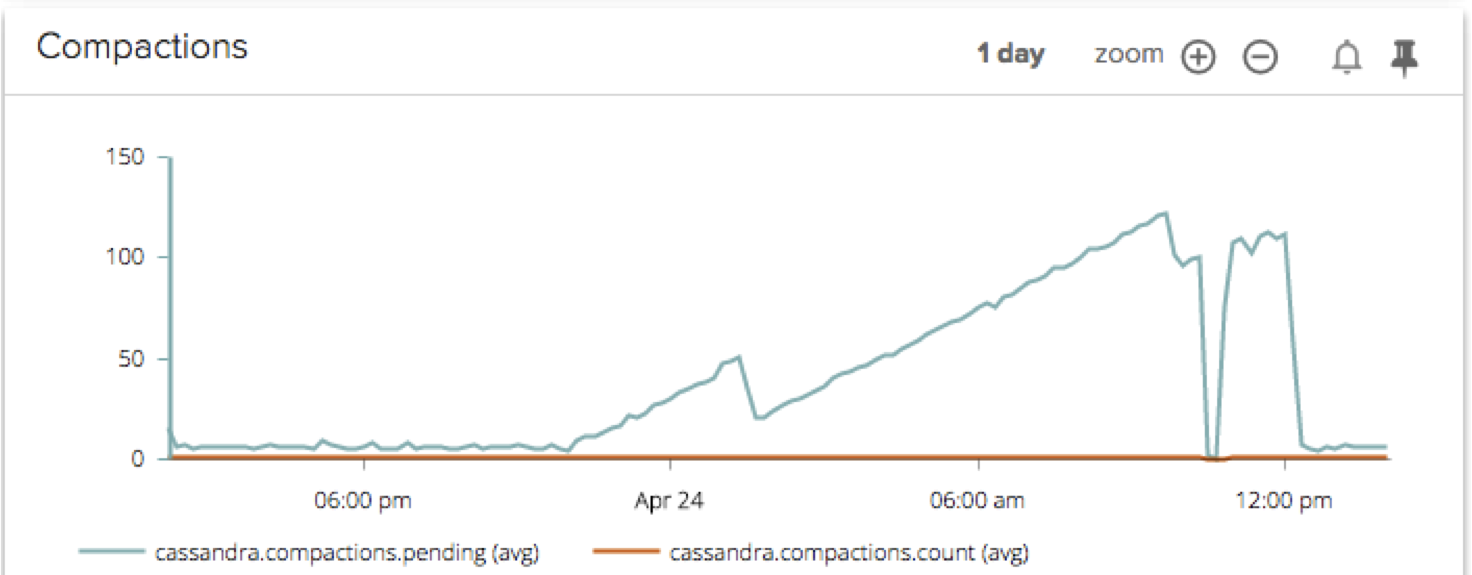
A Quick Example: The Mystery Of The Mysterious Compactions
One day a few weeks ago, we noticed a huge ramp up in compactions across our Cassandra cluster. First step? Well of course: we pulled up Sysdig Cloud’s Cassandra monitoring dashboard to help investigate.
If you’re not familiar with Cassandra compactions, I recommend checking out DataStax’s documentation that explains the details. At a high level, compaction is a way that Cassandra periodically merges SSTables to keep the Cassandra database operating at peak performance.
This compaction issue could be across the entire cluster, or a particular node could be mis-behaving. Because Sysdig Cloud allows you to segment your Cassandra metrics by cluster or by node, it was really easy to identify where the issue was actually taking place.
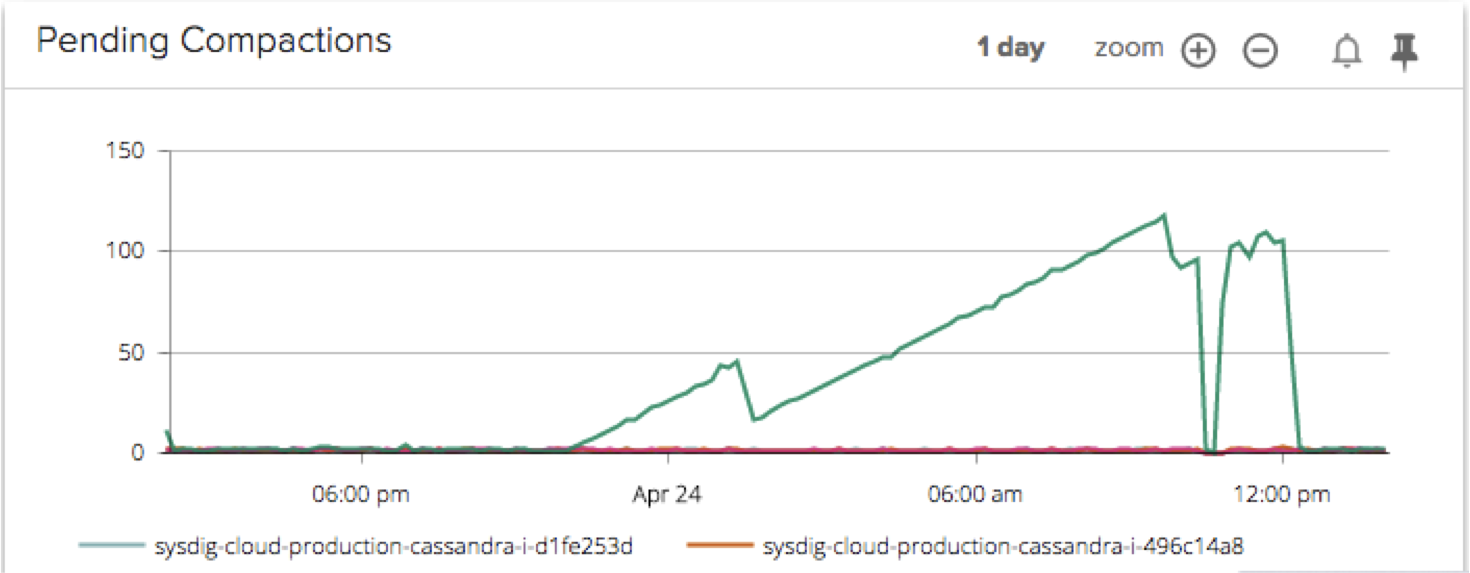
Aha! After segmenting by node, we can plainly see that it was actually only one node in our cluster that was contributing to this huge backlog of pending compactions. Our engineering team investigated the configuration settings on that particular node and discovered that the default compaction limits for disk bandwidth weren’t optimized for the rate of ingestion for this node. We needed to increase the limit so the node could perform the right number of compactions. After a configuration update the problem was solved.
However, our engineers didn’t want this issue to re-appear in the future, and in two clicks, they were able to set up a robust alert based on the chart you see above.
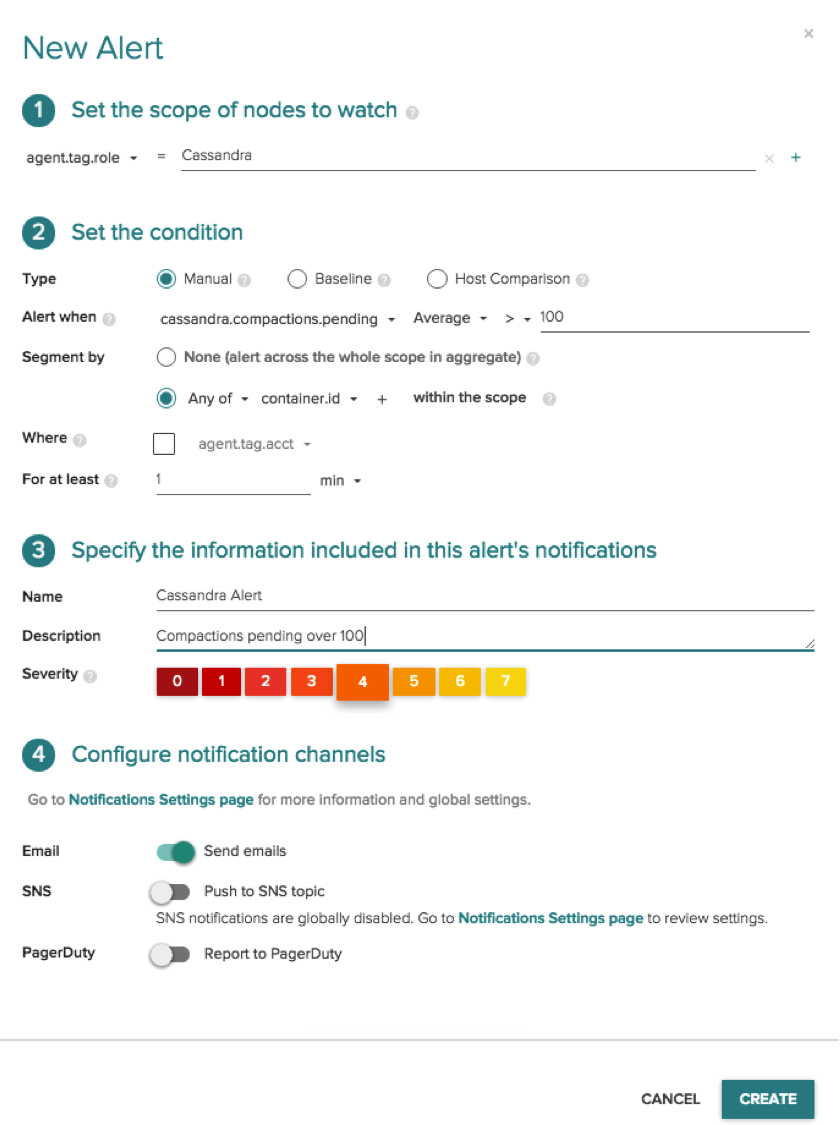
Before Sysdig Cloud, this process would have taken a lot longer. It would’ve been very difficult to identify the issue was limited to one node (which would have likely resulted in lengthy troubleshooting times) and to create an alert on the pending compactions metric (which would help identify this kind of issue in the future). Luckily for our team we eat our own dogfood and had a wonderful Sysdig Cloud dashboard at our disposal to help with this process!
Now, any time pending compactions go over 100 for any of our Cassandra nodes, our engineering team is notified in real time. It’s important to note that this single alert covers our entire Cassandra cluster. As nodes come and go, the alert will automatically be applied with zero configuration and no need to manage multiple alerts. All this with two clicks.
Conclusion
Getting granular visibility inside Cassandra is of the utmost importance when monitoring and managing your deployment. To get the best possible performance from Cassandra, you should be monitoring metrics like:
- Read / Write Requests
- Read / Write Latency
- Disk Used
- CPU %
- Network Bytes Activity
- File Bytes
- Heap Usage
- Garbage Collection Times
- Hinted Handoff Pending
- Compactions
Sysdig Cloud has great Cassandra dashboards that help provide this granular visibility – if you are interested in trying these Cassandra dashboards out for yourself, sign up for a free 14-day trial today!