
Here at Sysdig, we’ve talked a lot about how hard it can be to get proper visibility into a containerized environment. When you’re running Docker, monitoring just doesn’t work the same as in a traditional virtualized environment. Even basic resource utilization metrics can be very hard to get at on a container by container basis. This includes CPU, memory and network level metrics. But one class of metrics has always been particularly hard to obtain from within containers: file I/O and file system metrics.
The challenge is this: containers actually have their own file systems that are hidden inside a mount namespace. So visibility into the container’s file system is closed off to the host system and any other containers running on the system. Without dropping into the container itself, it’s nearly impossible to see into the filesystem of the container. This can be a huge pain, of course, because fill system activity can be super important. Without this visibility, you won’t even know basic intel like if a container has used up all of its allocated disc space!
Enter Sysdig Cloud. Thanks to the Docker stats API, many tools can now report on at least a few metrics like CPU, memory, and network usage by container. But with Sysdig Cloud, we pride ourselves on offering way, way more container level metrics than any other tool on the market. All right out of the box, with no configuration. And with some recent updates to our ContainerVision technology, I’m happy to announce that this now includes full visibility into container-level file system metrics!
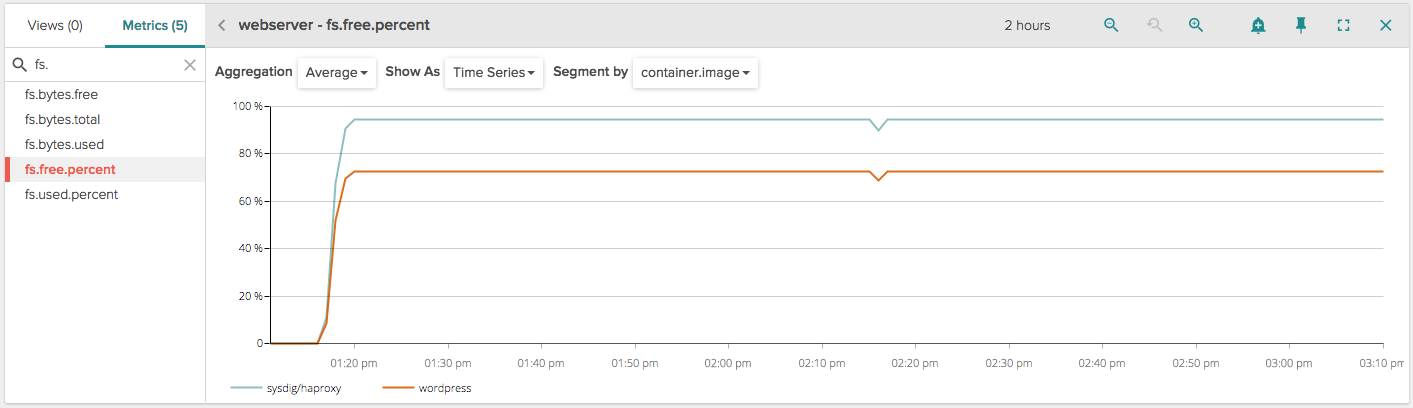
Core file system metrics such as the following can now be explored, dashboarded, and alerted on, on a container by container basis, in Sysdig Cloud: * File system size: free, used, and total bytes * File system usage: free and used percentages * File system type * File system mount directory * File system device
Sysdig Cloud also offers detailed file I/O metrics like the following for your containers: * Top files by size and activity * File I/O bytes: in, out, and total * File IOPS: in, out, and total * File I/O time: in, out, and total * File errors: open and total * Open file count
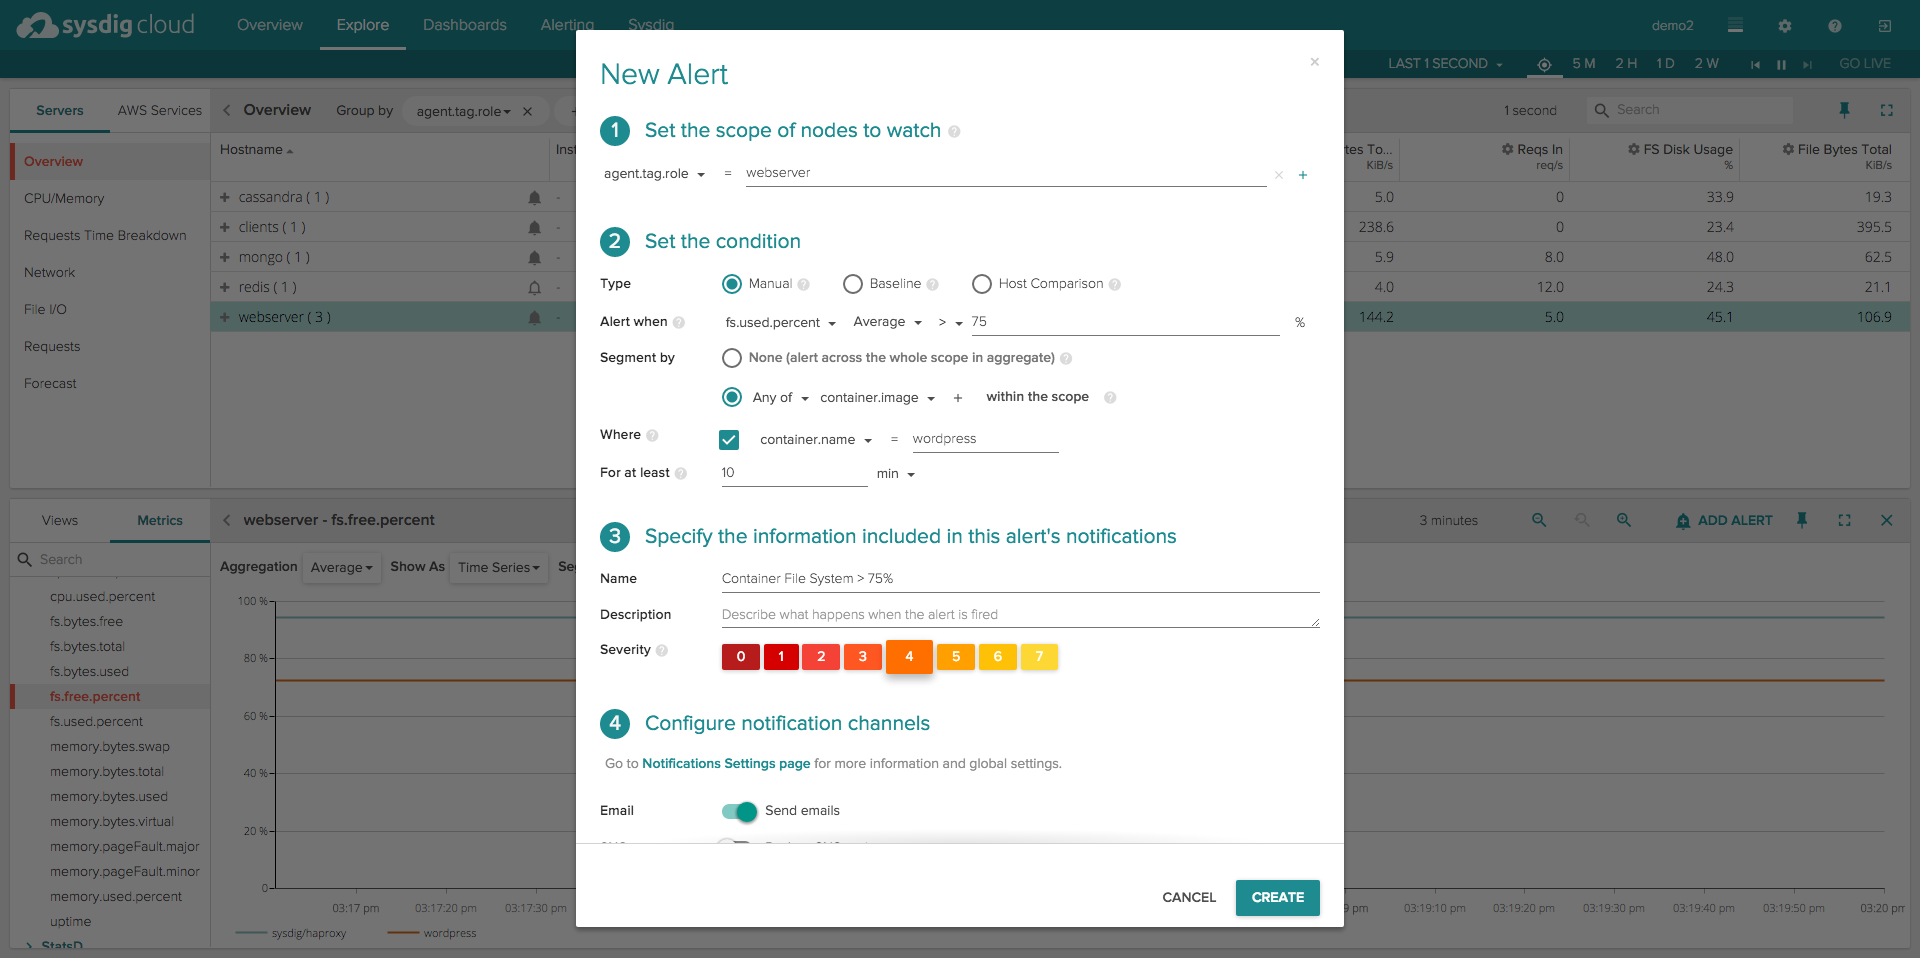
How could you actually use this info? Well just as one example, it’s now dead simple to create an alert if your container’s file system is filling up. Just click the “Alert bell” icon on any chart in Sysdig Cloud to automatically create an alert based on that chart. Here I’ve created a threshold-based alert on file system usage for all of my wordpress containers:
You can also easily do deep troubleshooting in your containerized environment, since Sysdig Cloud retains all of this data historically. No more trying to ssh into production environments and drop in and out of individual containers to get to root cause.
If you’re looking for visibility into your containers and microservices, including file I/O and file system metrics, I hope you’ll give Sysdig Cloud a shot. Sign up above for a two week free trial today!