
The first system for native rkt monitoring
![]() First off, we’d like to offer the whole CoreOS community a big congratulations for releasing rkt 1.0 today. Here at Sysdig, our goal is to help you innovate in your infrastructure with new container and microservice technology, without sacrificing the visibility you’ve come to expect in your production environments. To that end, we’ve been working closely with the rkt team to provide the first (and to our knowledge, the only) native rkt monitoring and troubleshooting solution. Today we’re happy to announce general availability of this functionality in both our open source projects, sysdig and csysdig, and upcoming support in our container monitoring platform, Sysdig Cloud.
First off, we’d like to offer the whole CoreOS community a big congratulations for releasing rkt 1.0 today. Here at Sysdig, our goal is to help you innovate in your infrastructure with new container and microservice technology, without sacrificing the visibility you’ve come to expect in your production environments. To that end, we’ve been working closely with the rkt team to provide the first (and to our knowledge, the only) native rkt monitoring and troubleshooting solution. Today we’re happy to announce general availability of this functionality in both our open source projects, sysdig and csysdig, and upcoming support in our container monitoring platform, Sysdig Cloud.
What is rkt? Why does it exist?
Rkt is an alternative to Docker, LXC, and other container runtimes. It was designed with security and composability in mind. CoreOS has created a number of docs to compare rkt to other container runtimes, so we’ll just give you the high level here. Some of the features that rkt 1.0 highlights:
- Container isolation: Users can manage the isolation level of their containers. For example, rkt has the ability to launch a container as a virtual machine for greater isolation. Rkt also has cluster- and network-wide management and configuration capabilities.
- Stable interfaces: rkt has a refined CLI with easy integration points.
- Intel Clear Containers certification: rkt is implemented as pluggable “stages” of execution which complies with Intel Clear Containers’ model. So rkt containers can be launched with security rooted in hardware.
For teams that are looking for a container approach built around security, rkt might be a good project to check out. Read CoreOS’s blog post for more.
How does Sysdig fit in?
If containers are going to be truly viable in production environments, they need production-quality monitoring and troubleshooting. That’s what we do. Our open source projects, sysdig and csysdig, give you deep visibility into a single host with advanced troubleshooting capabilities. Meanwhile Sysdig Cloud extends this technology across your distributed system, giving you centralized performance monitoring and real-time alerting on your applications, infrastructure, and systems.
And starting today: all Sysdig products offer full support for rkt containers as first class citizens. That means you get full rkt visibility without any instrumentation required inside your rkt containers.
Let’s dig in and see Sydig at work.
Troubleshooting with open source sysdig and csysdig
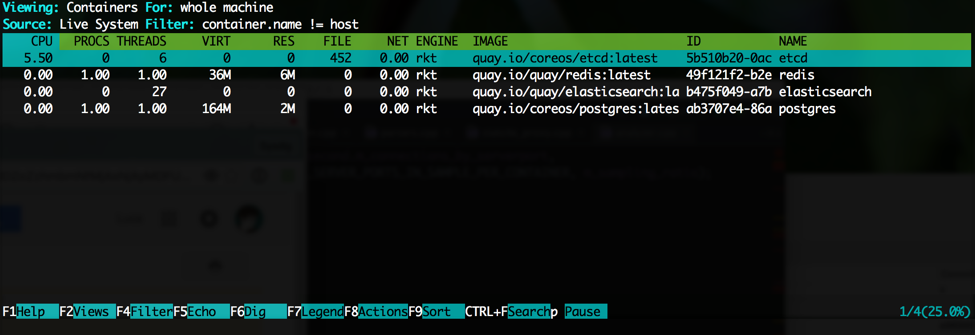
Csysdig lets you interactively troubleshoot rkt containers on a host.
Sysdig is an open source command line utility. Simply install sysdig on your host where you are running your rkt containers, and dig in from there. Sysdig will automatically detect all the rkt containers running on the host, and begin capturing and surfacing all the activity happening inside those containers. This includes system resource utilization (memory, CPU, etc), network traffic, file I/O, logs, and much more.
Both sysdig and csysdig also now support rkt metadata such as container name, ID, and image – right out of the box, with no configuration. You can also filter sysdig data to show only rkt information in hybrid environments:
container.type = rkt
In a nutshell: the go-to toolbox of linux troubleshooting tools – everything from top to ps to netstat to wireshark – tends to break down in container environments. With sysdig you’ve now got a single swiss army knife for all your deep rkt troubleshooting needs.
For more details on using sysdig for visibility into your containers, read this post. And for a detailed view on using sysdig to get visibility into the applications running inside containers, check this out.
Using Sysdig Cloud to Monitor rkt Containers
Sysdig Cloud leverages open source sysdig technology to provide a best in class monitoring, alerting, and dashboarding platform for containerized environments – and soon including rkt of course! At a high level, it is as simple as this: with Sysdig Cloud you get full visibility inside every container across your entire operating environment. With Sysdig Cloud, you can do things like:
- rkt monitoring for your containerized applications with no plugins needed
- Inspect deep application activity like URLs, HTTP error codes, and database queries with no instrumentation
- Automatically map the topology of your containerized environments to highlight dependencies and bottlenecks
- Analyze process execution, file system activity, and network activity inside your rkt containers in a single view
Again, all of this is achieved without needing to instrument your rkt containers OR your application code. Monitoring rkt just entails adding the Sysdig Cloud container to your environment.
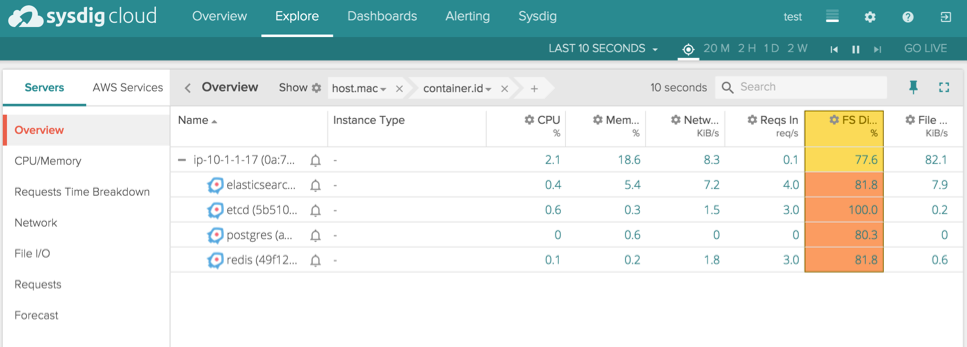
Hierarchical grouping makes monitoring even large, dynamic infrastructures natural and intuitive. Insights are available at every level of granularity – so you can, for example, easily see resource utilization or application performance for an entire cluster of rkt images. Grouping is based on zero-config tags, that are automatically pulled from your cloud provider or generated based on your orchestration and scheduling tools.
Switch to our topology view, and you can zoom in on any part of your infrastructure – starting at the highest level and drilling all the way down to a particular process inside a rkt container.
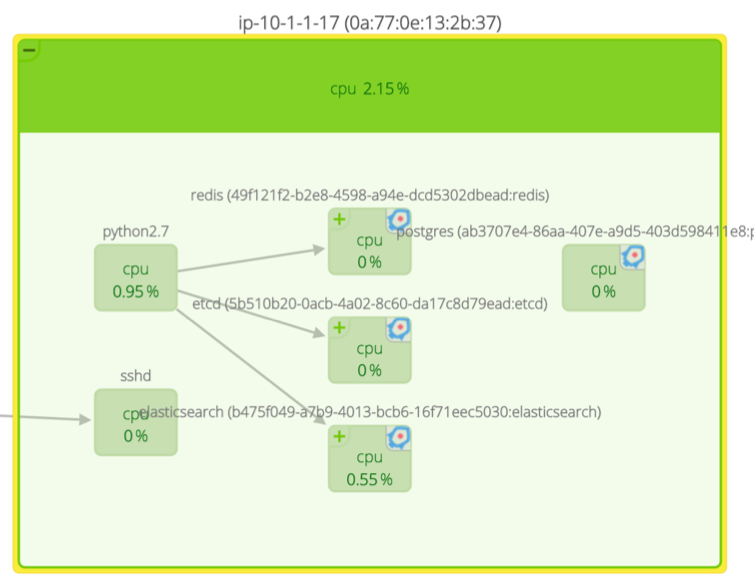
Note that Sysdig Cloud automatically discovers the containers in your environment, groups them logically within a multi-tiered grouping hierarchy, and understands the dependencies of each container in the context of your overall environment.
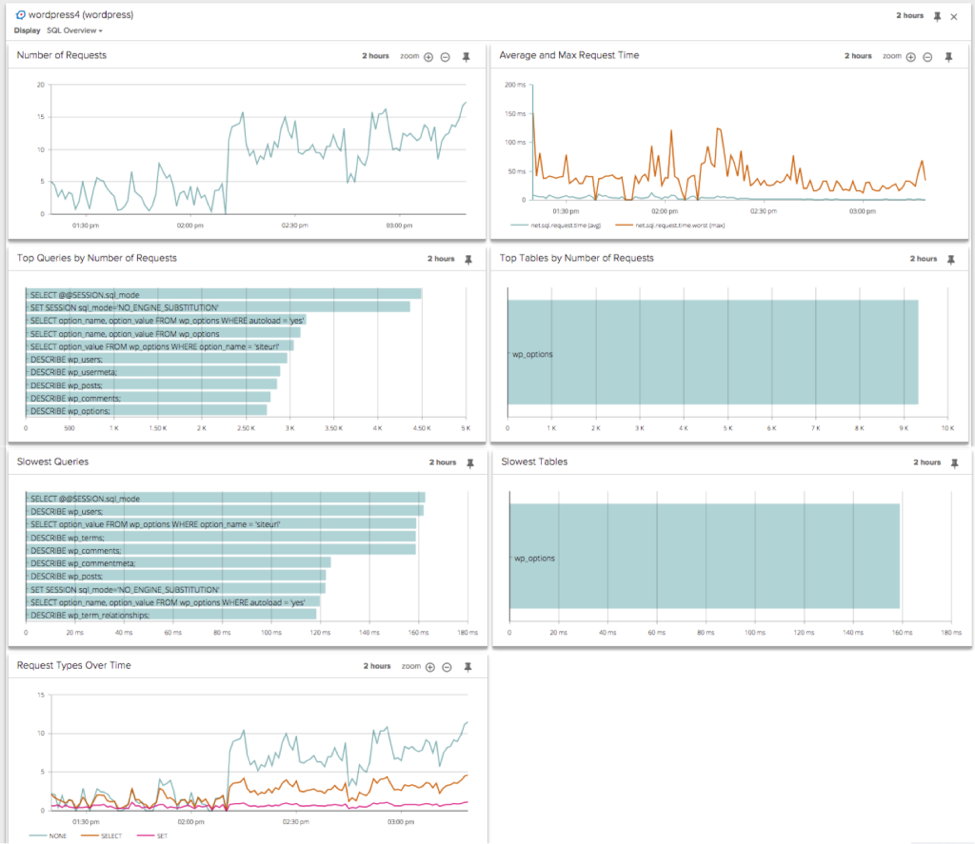
You can also easily see inside your rkt containers to understand what your applications are doing. A couple quick examples: you can see SQL activity to understand the number of requests, response times, top queries, and slowest queries:
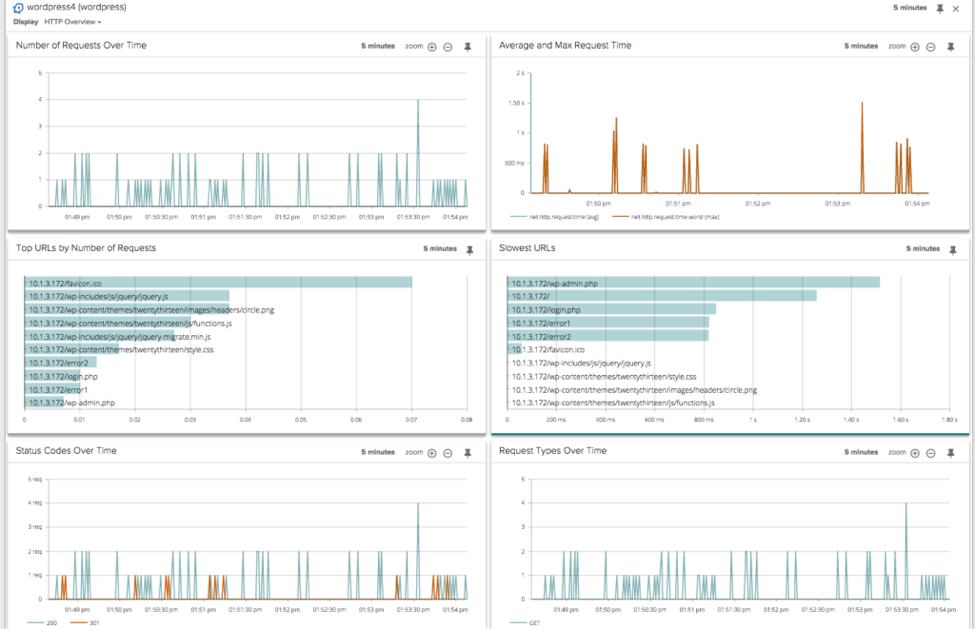
You can monitor application performance and response time over HTTP through things like top URLs, slowest URLs, and status codes:
And finally, Sysdig Cloud can give you insight down to the network as well. Here is a network connections table that shows network activity flowing through a group of rkt containers.

Keep in mind that all of this information is available live, in real-time, but also going back in history. This is extremely important when you’re trying to troubleshoot issues in a dynamic environment where problematic nodes might not even exist anymore by the time you want to investigate them. With Sysdig Cloud, you can still get to the root cause, and prevent the issue from happening again.
Summary: Taking rkt into orbit with Sysdig monitoring & troubleshooting
Ok, we made it this far into the post without a single wordplay off rkt, but you know it had to happen! Seriously though, we know that building a production-ready container infrastructure isn’t easy. It requires serious effort from development as well as ops across dev, build, and monitoring with an eye towards the security and reliability of your software. We hope that rkt helps you accomplish that. And, if you’re thinking about building the capability to monitor, troubleshoot, and analyze your container infrastructure – rkt or otherwise – we hope you’ll consider Sysdig. You can always start a free trial to see what Sysdig can do for you. Onwards and upwards!