
Our engineering team has been busy building some awesome new functionality and on behalf of the entire company I am thrilled to announce a number of Sysdig Cloud enhancements. This release is jam-packed with cutting edge functionality that we think will greatly improve visibility into complex environments by introducing brand new metrics and views that automatically correlate application and infrastructure data.
Let’s go ahead and take a closer look at the different improvements we’ve made.
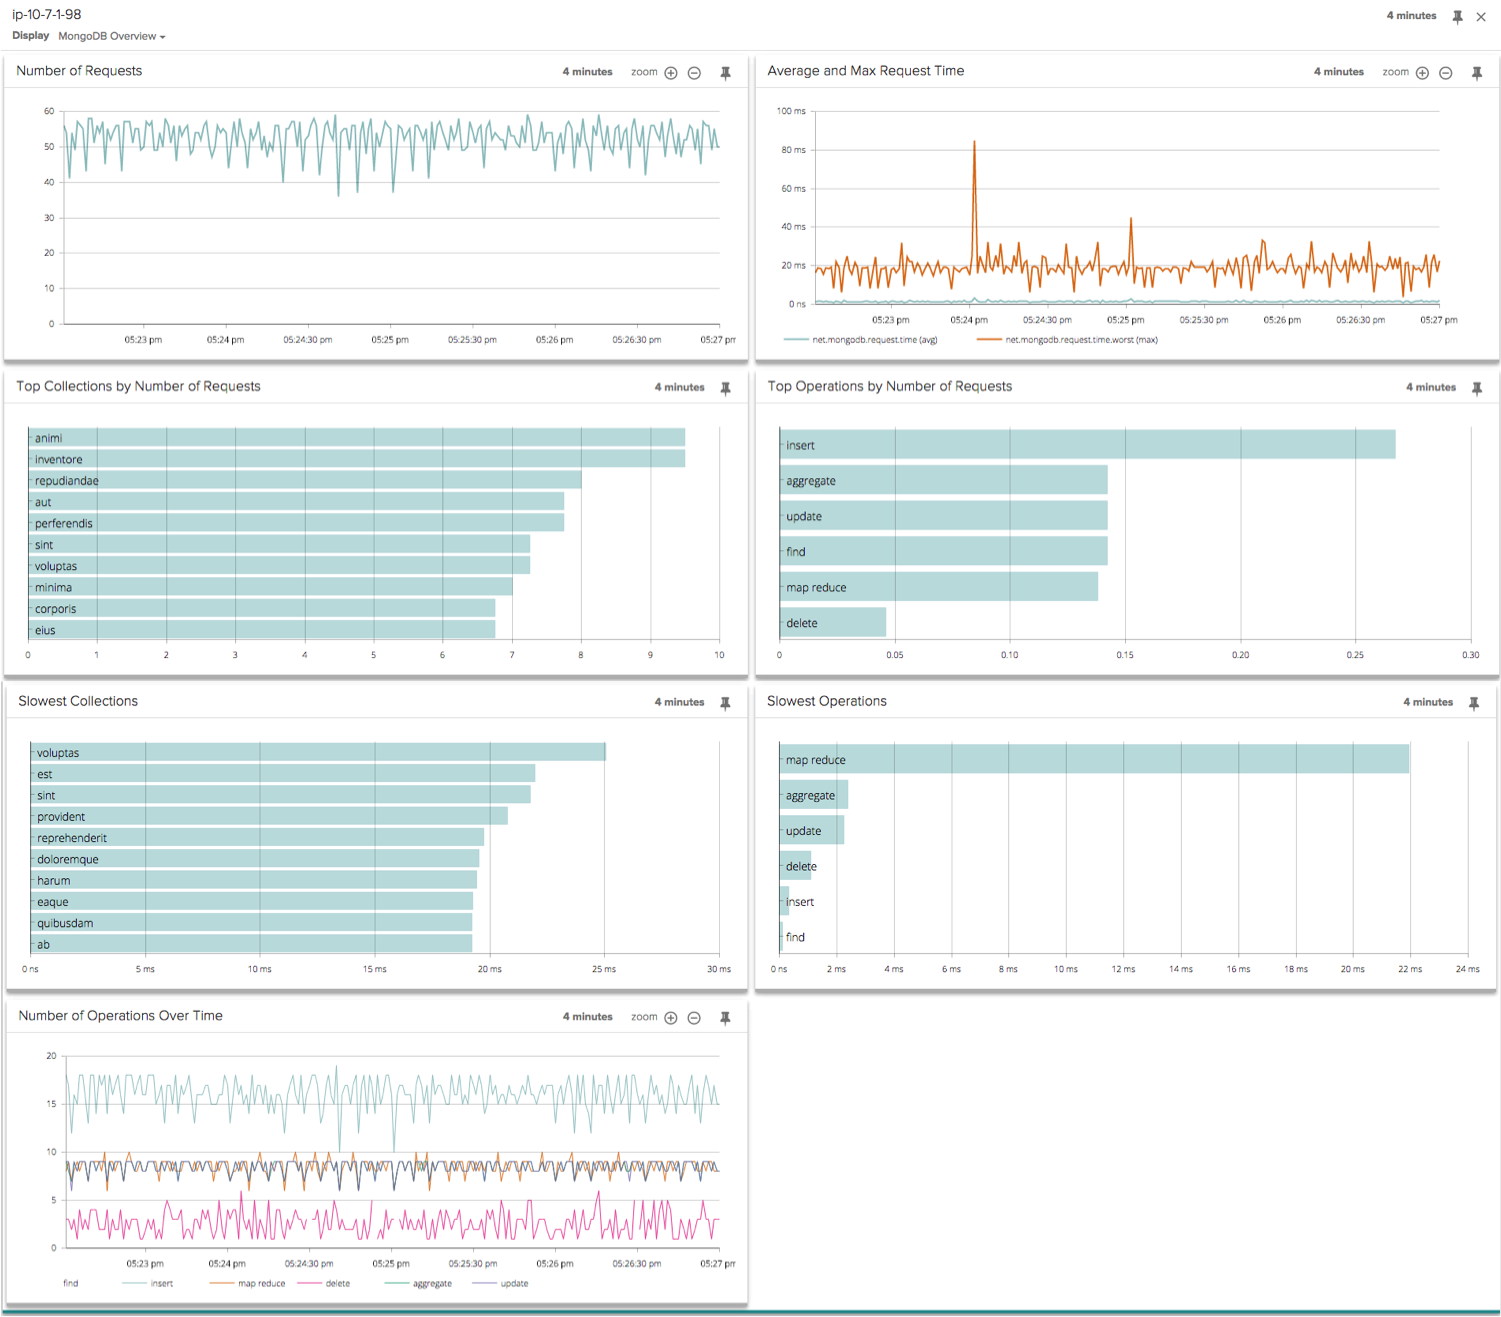
Zero-config MongoDB supportWith Sysdig Cloud’s new MongoDB support, our agent now collects and analyzes a number of MongoDB metrics out of the box including:
- net.mongodb.error.count
- net.mongodb.request.count
- net.mongodb.request.time
- net.mongodb.request.time.worstWe’ve also added two new options to group by, net.mongodb.collection and net.mongodb.operation. By providing deep visibility into MongoDB without any additional configuration or installation of plugins, Sysdig Cloud enables ops teams to easily gain access to MongoDB metrics, with the same one-second granularity that users are leveraging to monitor the rest of their environment.
Improved process discovery
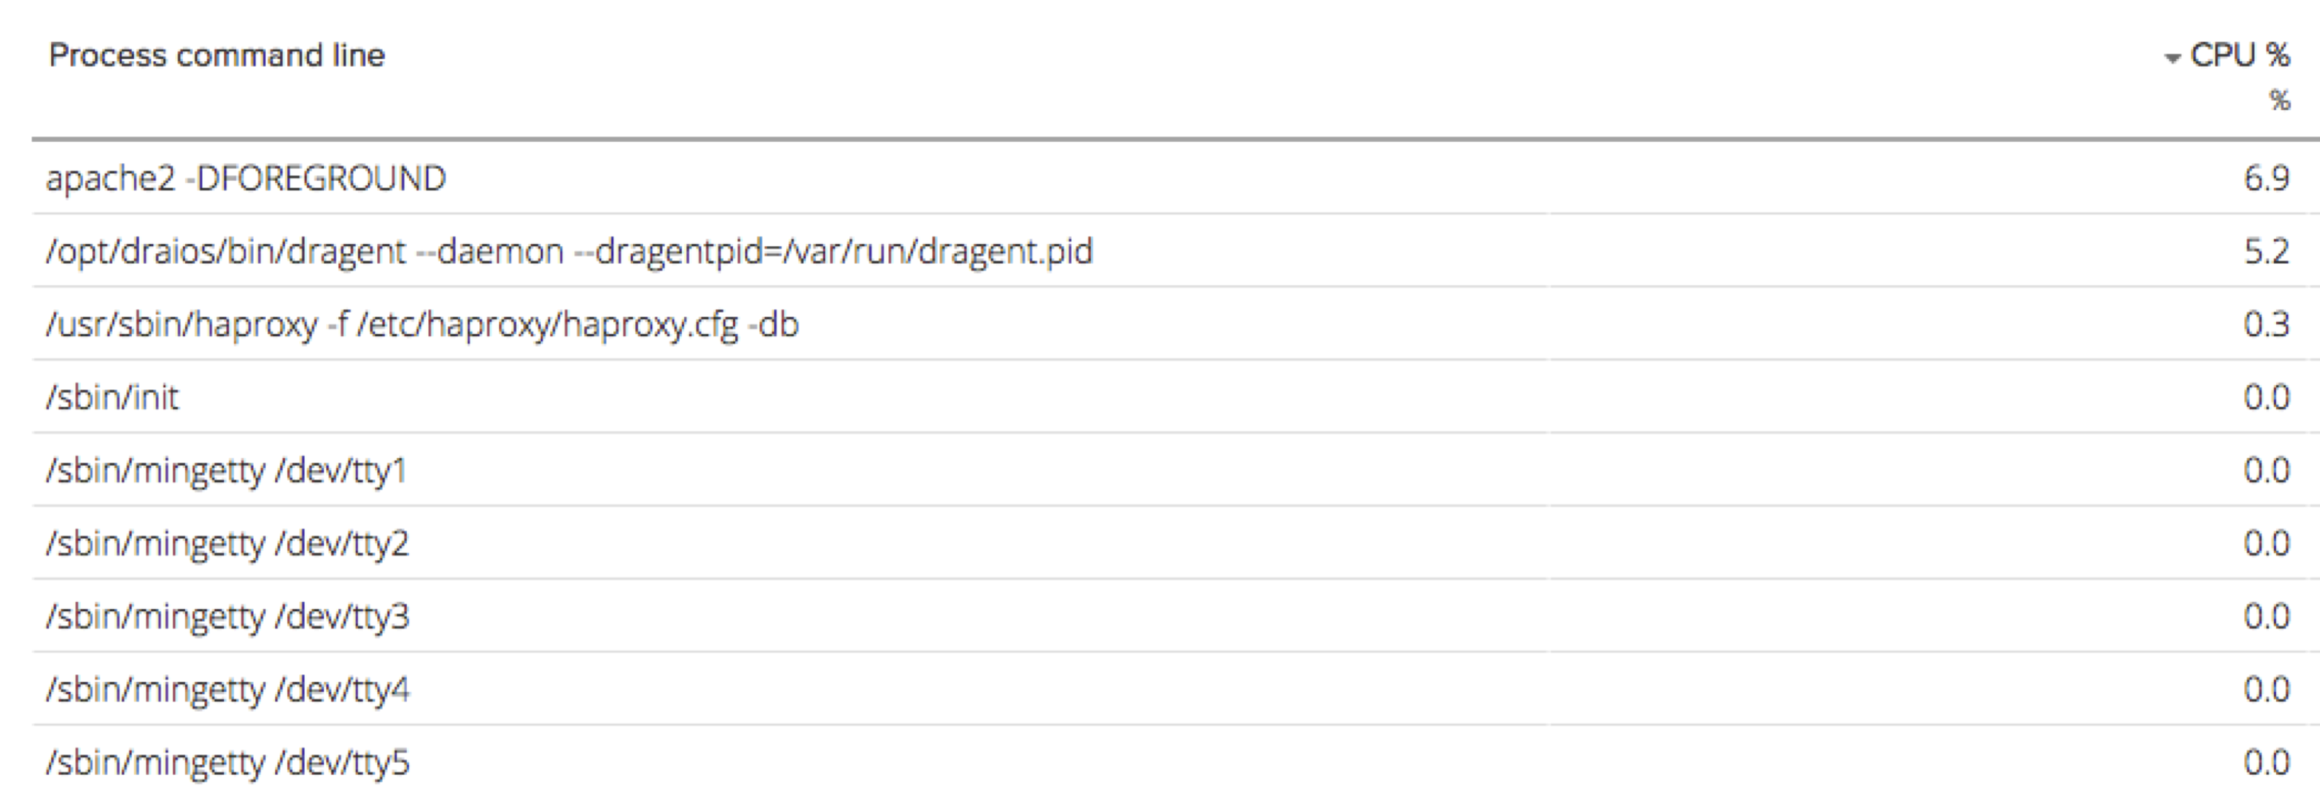
Surface command lines with full argumentsIn some cases, process-level information that gets surfaced to operations teams isn’t helpful without additional command line information. For example, if you have Java processes running on a machine, it might not be helpful to see all of those processes rolled up to a single process titled “Java”. Now, in Sysdig Cloud, users can easily view the process command line without having to SSH into the machine to get the next level of detail that can help show what processes are being executed on a particular host in real time or in the past. Think of this as having top for any of your machines, or groups of machines, from an explorable centralized interface.
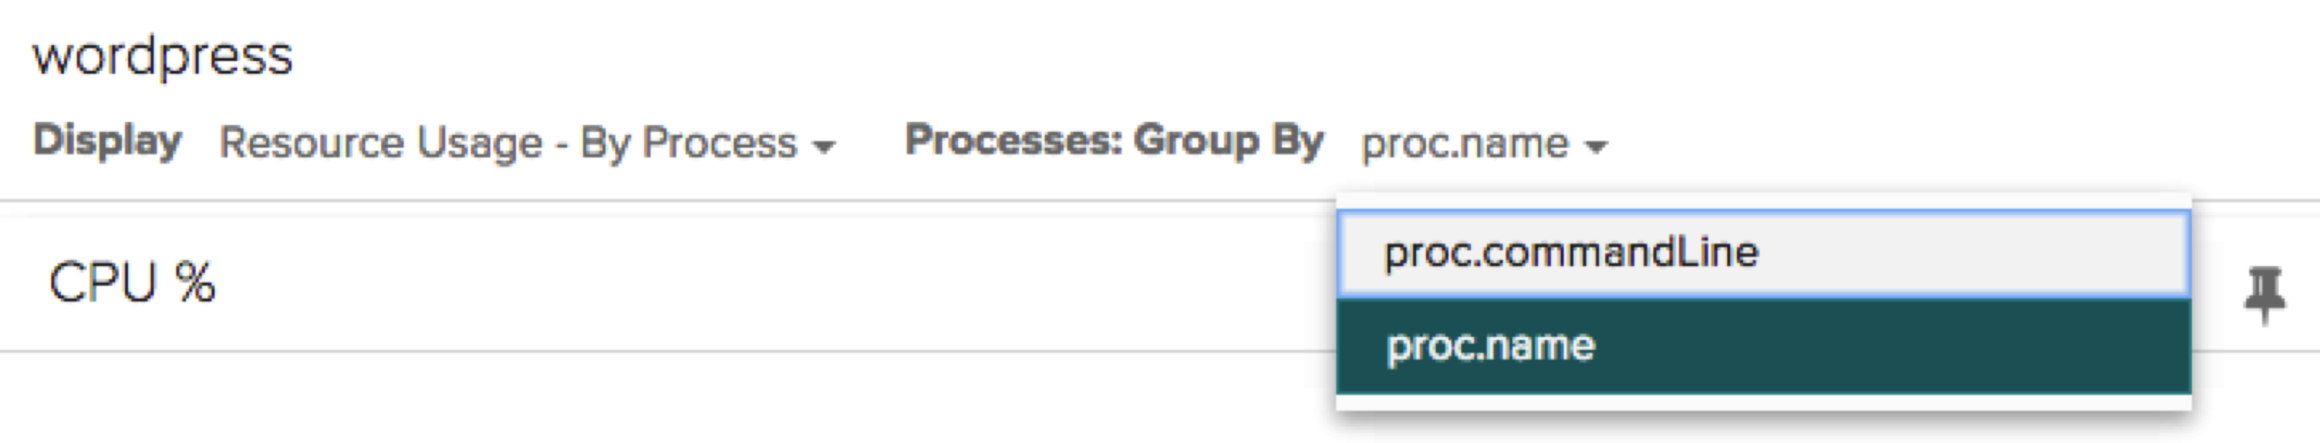
Ability to group data by process name or by command lineBuilding on the process command line capability, users now have the ability to group any view or table that contains process data in it by process name or by process command line. By providing full control of how users view and consume process-level information, Sysdig Cloud allows users to quickly iterate between different views to uncover the information they need.
New built-in views
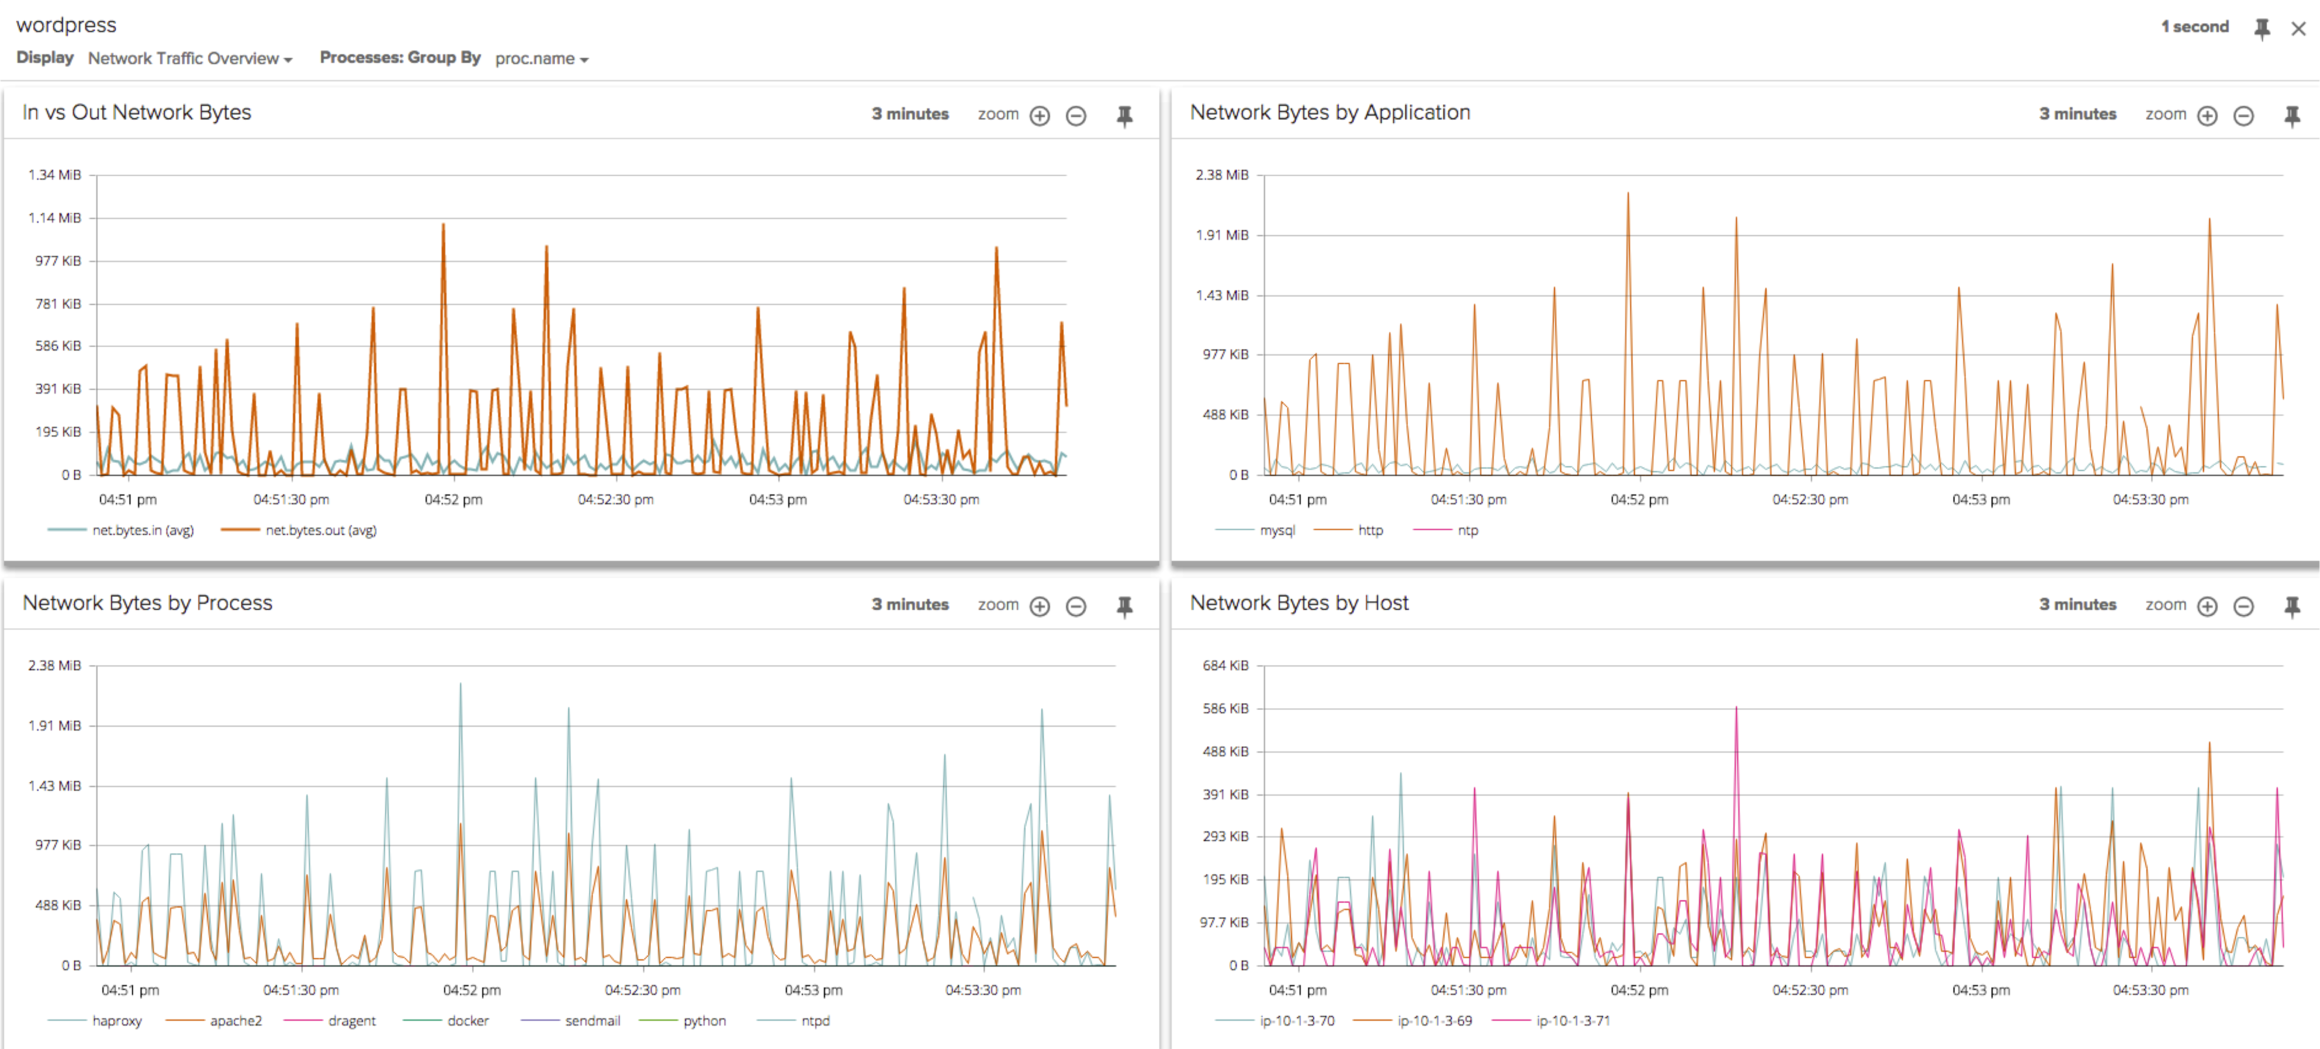
Network traffic overviewThe network traffic overview exposes network metrics for components of the infrastructure. With this view, Sysdig Cloud users can now get visibility into in vs out network bytes, network bytes by application, network bytes by process, and network bytes by host. Monitoring network traffic activity is a key part of managing modern infrastructure environments, and instead of having to pull metrics from silo’d tools and manually correlate them, Sysdig Cloud allows users to explore this information alongside system and application metrics all in one unified view. This improved visibility empowers operations to see network metrics in the context of a particular host machine, tier, availability zones, regions, etc. to gain yet another way of analyzing system performance.
Response time mapWith the response time map, users can now visualize and measure application response times without needing to instrument the application code. This topological view of the requests flowing through the environment enables ops teams to understand the end user experience without needing to configure or install any additional agents or having to manually correlate this data coming from another tool.

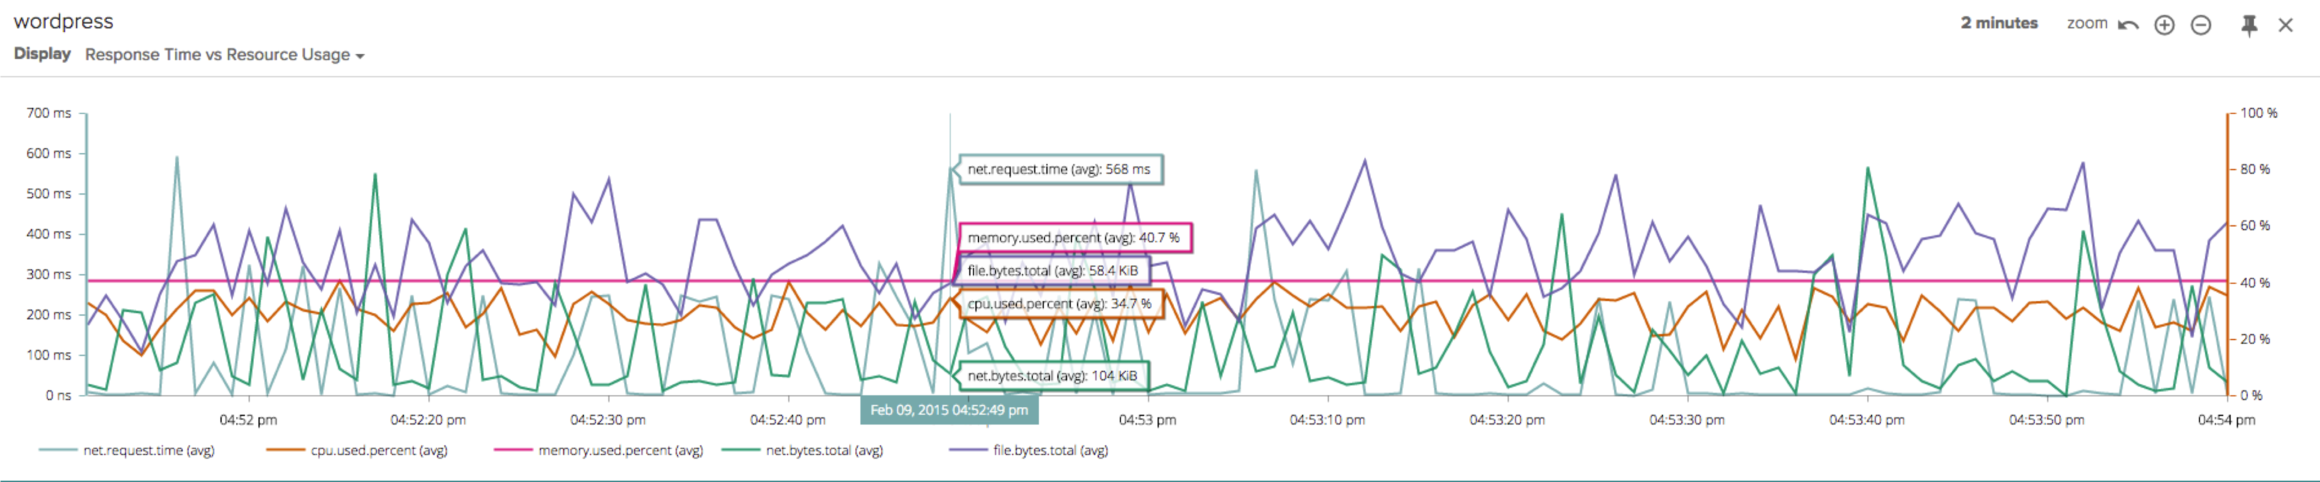
Response time vs resource usageThe response time vs resource usage view shows response time correlated with CPU utilization %, memory utilization %, average network bytes, and average file bytes. Automatically correlating system, network, and application metrics lets users see the underlying cause of spikes in response times. Being able to quickly pinpoint hardware issues behind potential bottlenecks should drastically reduce the time spent searching for the root cause of performance issues.
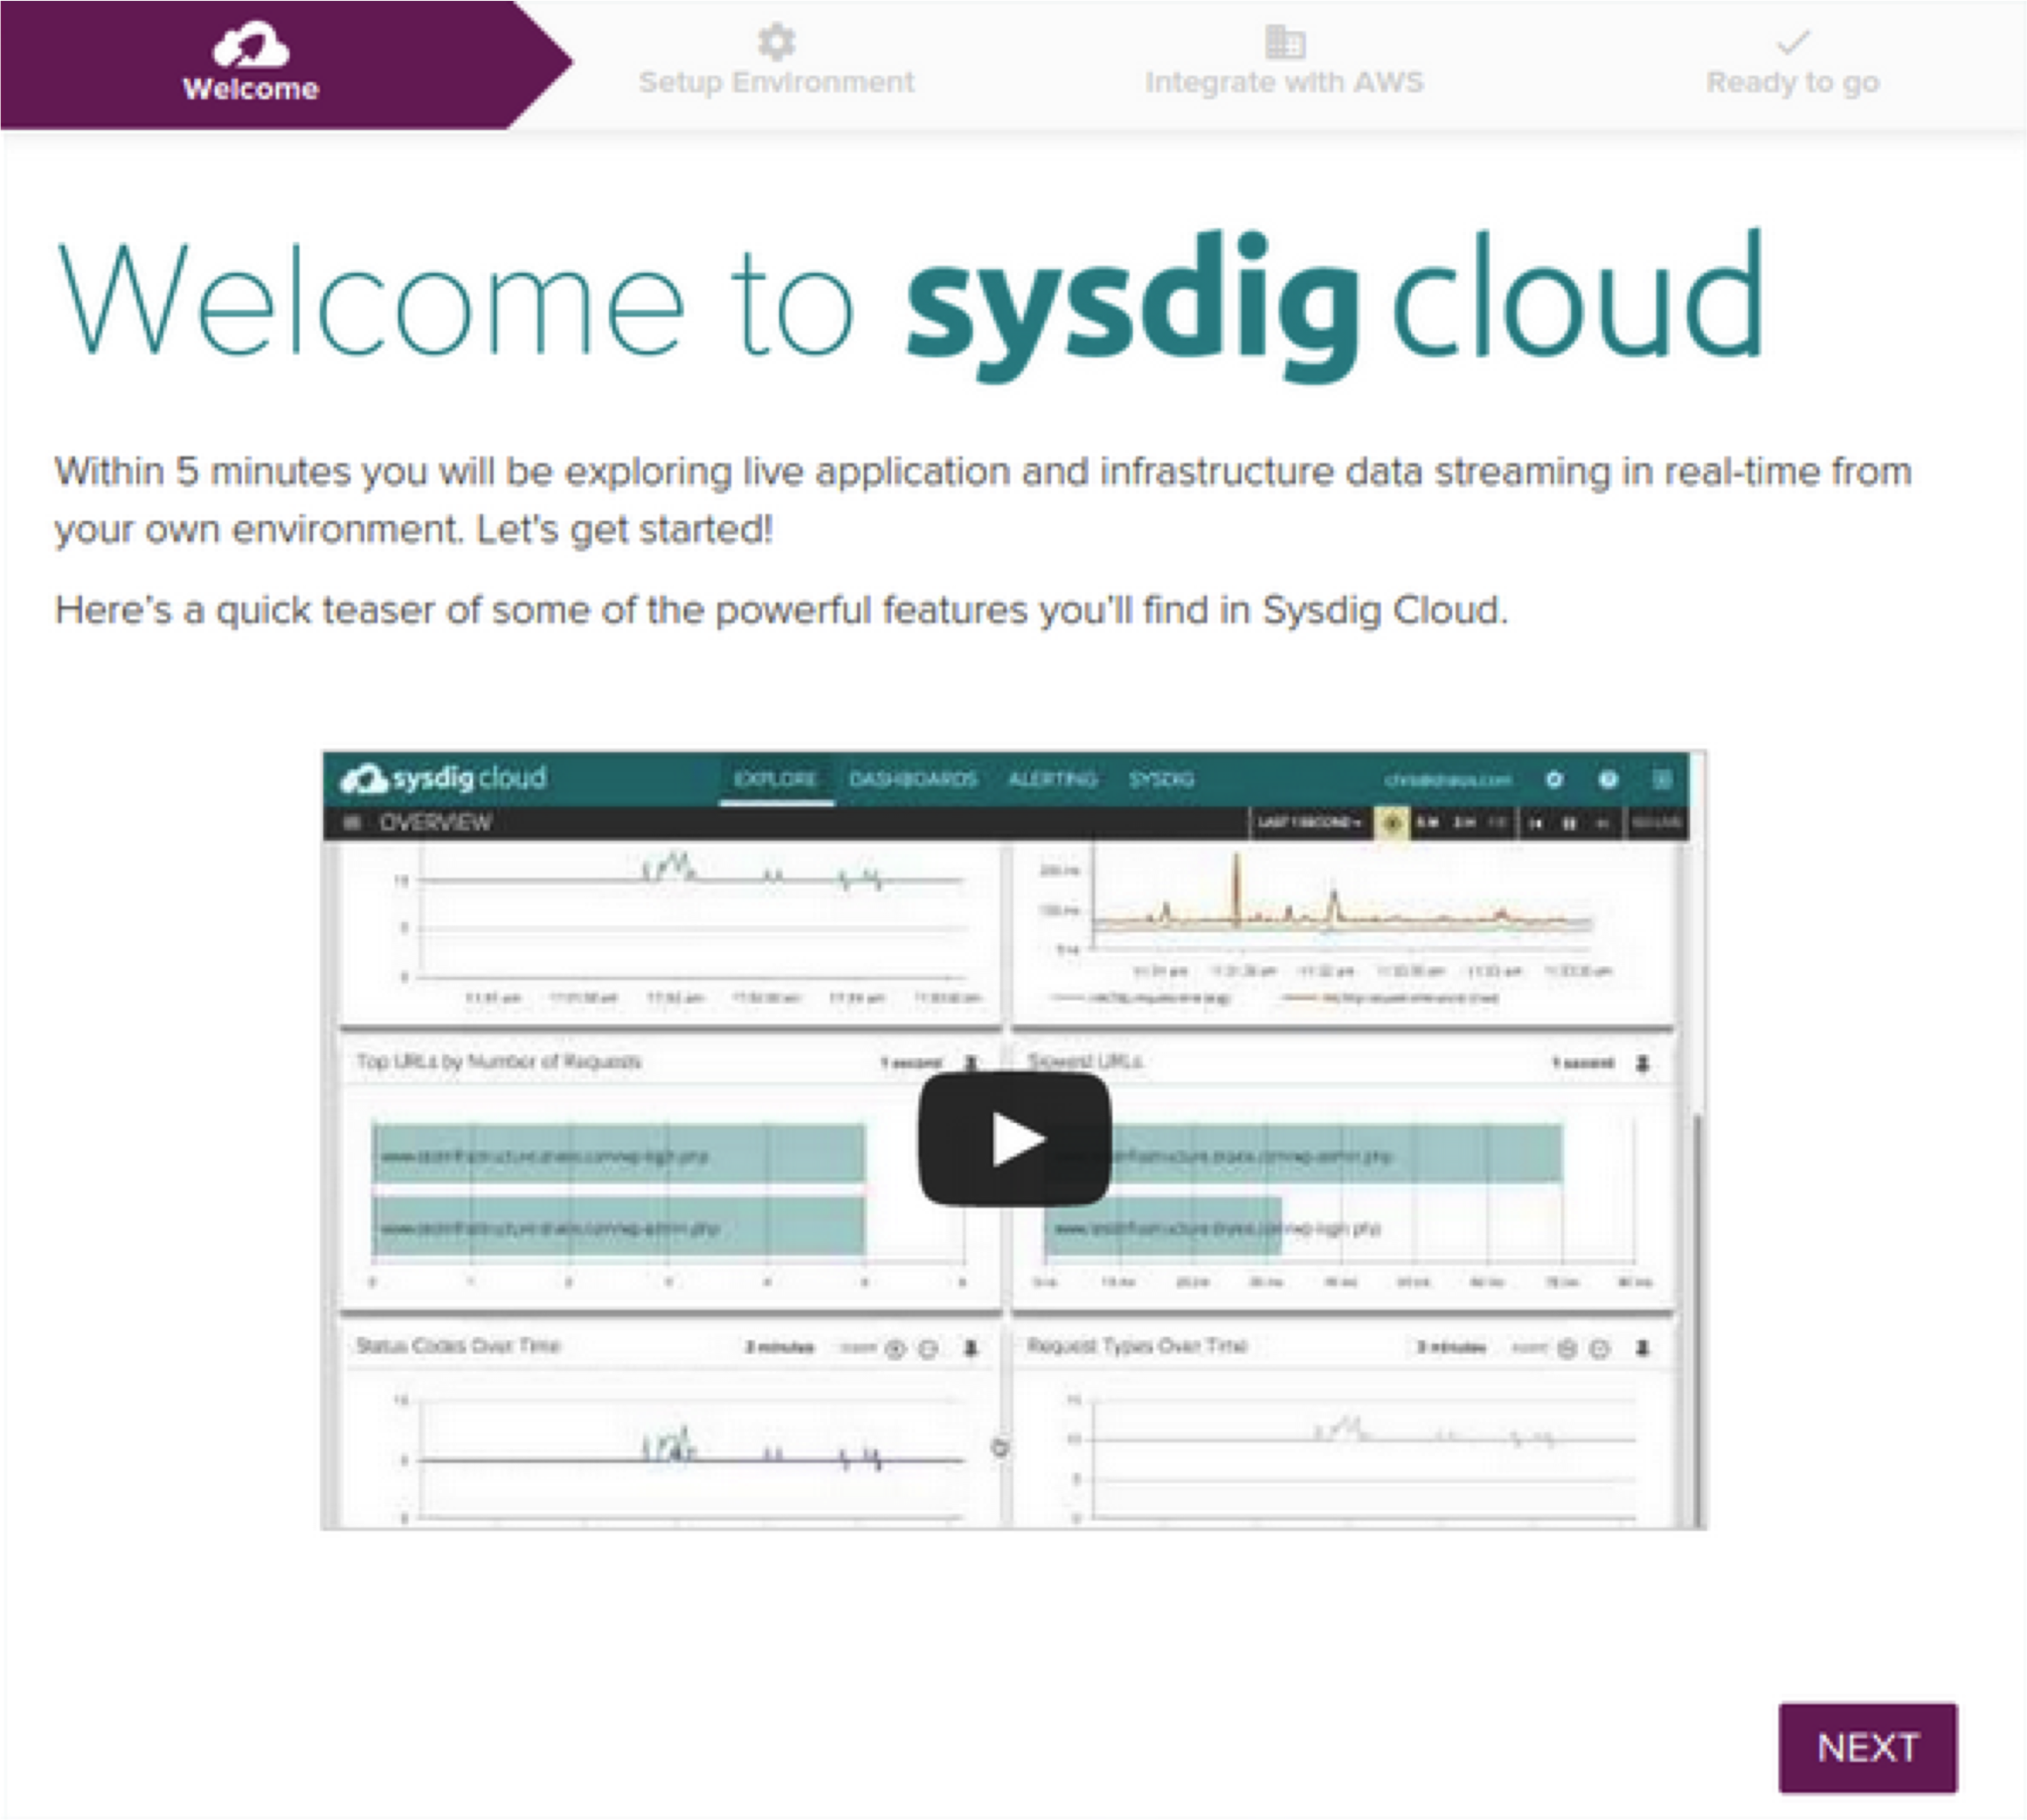
New setup wizard and video walkthroughsWhether you are new to Sysdig Cloud or are an existing user, we’re confident you’ll gain value out of our new setup wizard and detailed video walkthroughs. We are always focused on delivering value to customers, and this feature surfaces the information you need to start monitoring your environment or install additional agents across your infrastructure in minutes.
If you haven’t already done so, I encourage you to sign up for a trial of Sysdig Cloud to try these new features out for yourself!