
50 Shades of Systems Calls introduces Sysdig and csysdig system call profiling to monitor code performance inside Docker containers with spectrograms. This article has appeared on Hacker News on Feb 24, 2016 and Jul 19, 2016. Also has been featured in Reddit a few times.
Sysdig spectrograms technology is used in Sysdig Monitor, providing native container monitoring for Docker, Kubernetes or DC/OS Mesos.
Don’t want to read? Just watch this 30 second screen capture of spectrogram drill-down in csysdig.
Background on the Sysdig spectrogram
Around a year ago I published a Visualizing AWS Storage Latency with Real-Time Spectrograms featuring a new Sysdig chisel called spectrogram. I suggest you go read it, but if you don’t have time here’s a recap of it works:
- It captures every system call (e.g.
open(),close(),read(),write(),socket()…) and it measures the call’s latency - Every 2 seconds it organizes the calls into buckets ranging from 1 nanosecond to 10 seconds
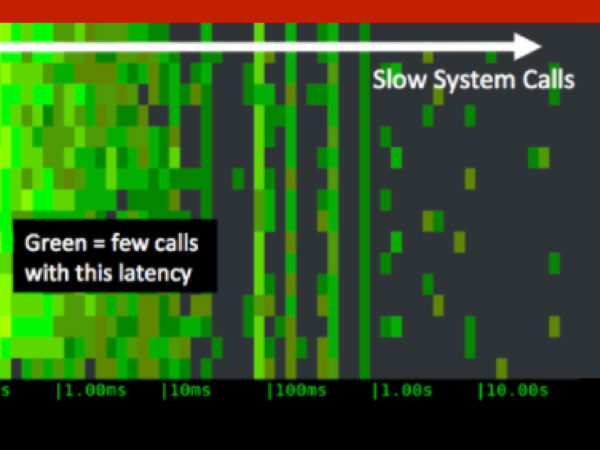
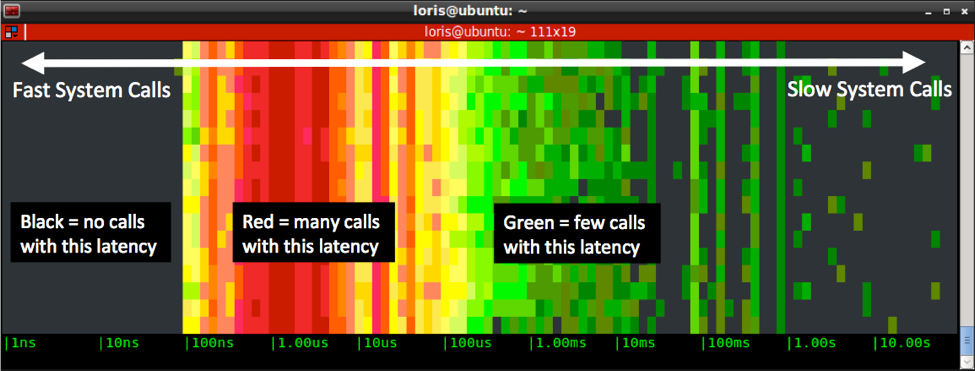
- The spectrogram uses color to indicate how many calls are in each bucket
- Black means no calls during the last sample
- Shades of green mean 0 to 100 calls
- Shades of yellow mean hundreds of calls
- Shades of red mean thousands of calls or more
As a consequence, the left side of the diagram tends to show stuff that is fast, while the right side shows stuff that is slow.
The spectrogram is great at showing patterns and outliers in the behavior of a system or application. But until now you are left to your own devices to troubleshoot what is causing this spot in the chart?
With a little more work, I was able to include it in csysdig, Sysdig’s command line ncurses UI, and also enhance it to be more useful.
Interactive spectrograms in csysdig
Including the spectrogram in an interactive UI like csysdig makes it possible to enrich it in a couple of nice ways: arbitrary selections and drill-down into events.
The spectrogram can now be applied very easily to arbitrary selections in csysdig by clicking on F12 (for a full spectrogram) or SHIFT+F12 (for a spectrogram that includes file I/O activity only). As an example, you can easily view spectrogram information for a process, a directory, a file, a container or, thanks to csysdig’s Kubernetes monitoring with pods, services, deployments, etc. Having such a visualization just one keyboard stroke away makes it easy to use it for exploration and troubleshooting.
Even more interestingly, now you can use the mouse to drag over areas of a spectrogram and observe the events that belong to that area in the spectrogram.
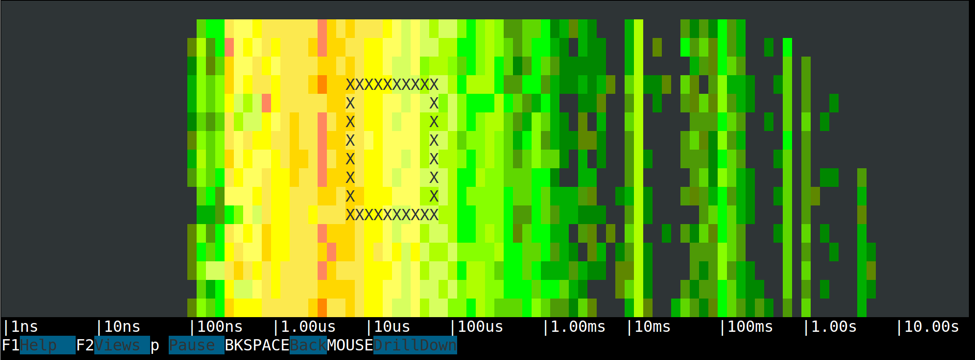
A rectangular selection in the spectrogram isolates events that belong to a latency range (the width of the rectangle) in a given interval in time (the height of the rectangle).
Once a selection is made, you are brought to a page showing the events that respect the criteria of the selection.
Besides being positively fun, this drill down functionality tends to be very useful. Now your answer is just one mouse drag away.
Here’s an example.
Writing To Disk in C, fwrite() vs write()
We are going to profile the following two simple C programs:
They both do exactly the same things: they perform 5000 writes of increasing sizes to disk. The first one (on the left) works at the file descriptor level, while the second one uses the C standard I/O library.
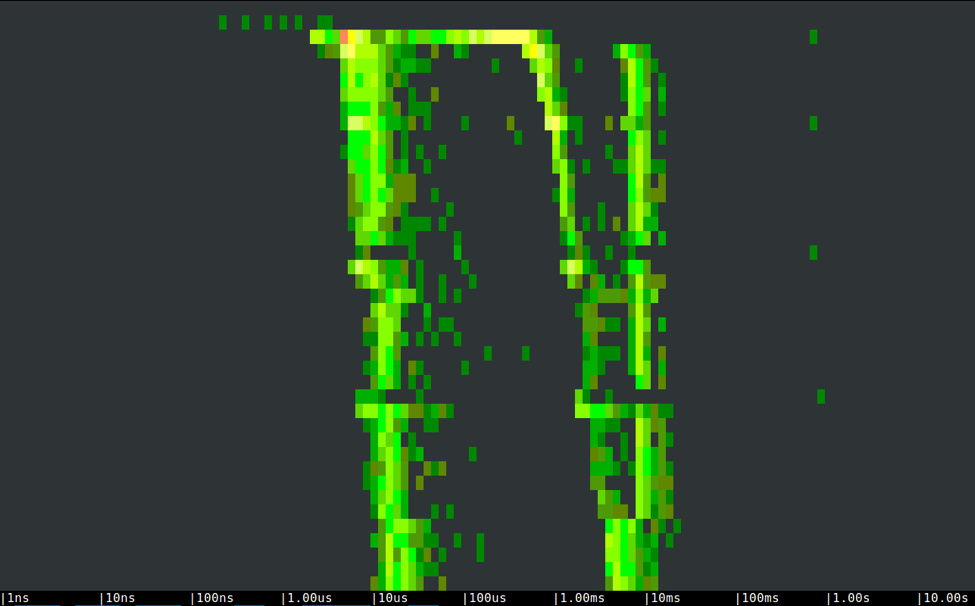
Let’s take a look at the spectrogram of the first program:
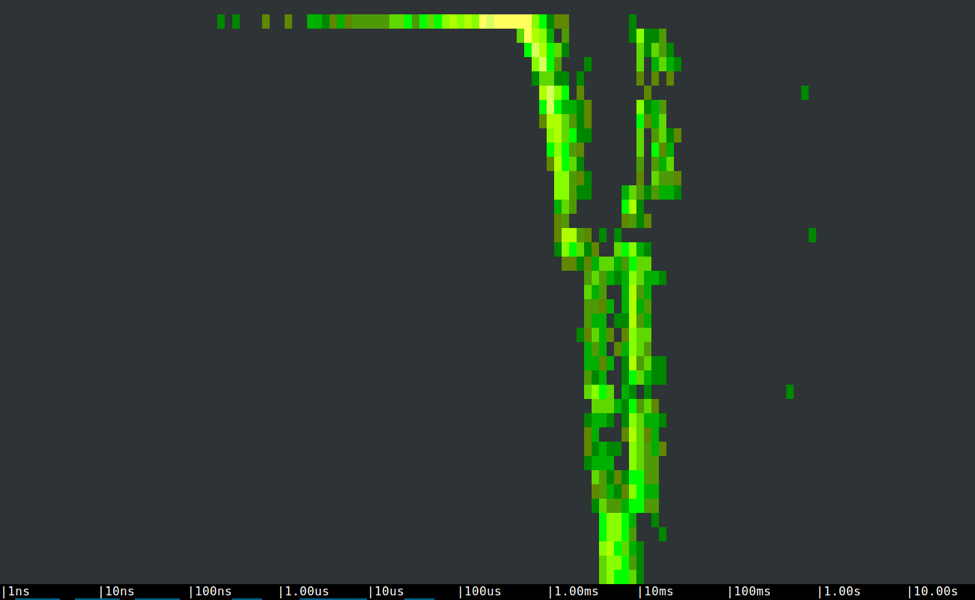
As expected, latencies increase with write buffer sizes, at a pretty regular pace. If we observe the size of the disk writes by drilling down from any portion of the chart, it’s easy to see that they correspond to the ones that the program specifies.
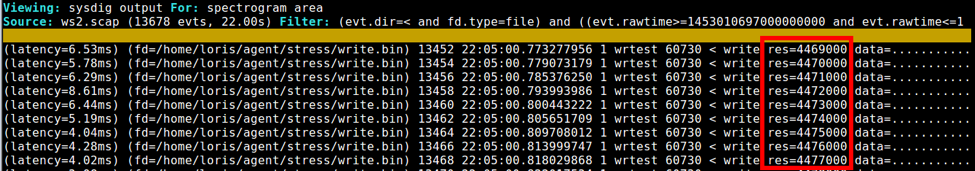
The three isolated dots on the right of the spectrogram are slow writes that take between half a second and a second, likely because of OS cache flushes.
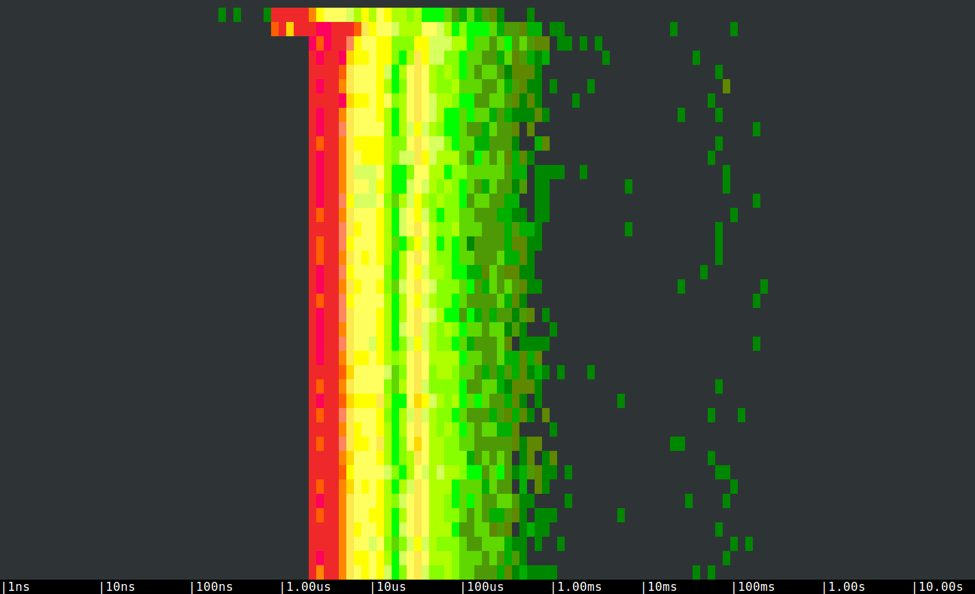
Now let’s looks at the spectrogram of the second program:
In this case, we clearly see a bimodal behavior, with an activity area in the tens of microseconds and another one between 1 and 30 milliseconds. What’s going on?
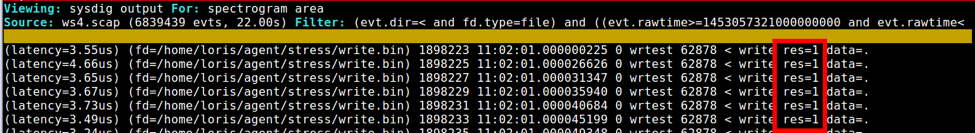
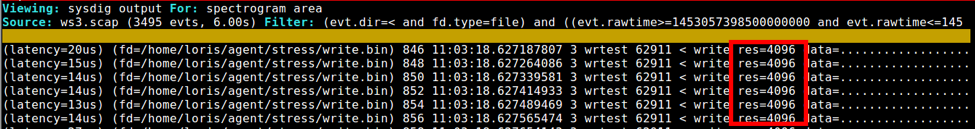
The right side contains a bunch of increasing size writes that sort of match the buffer size specified by the user in the call to fwrite(), but just a bit smaller. If we select an area in the left side of the chart, on the other hand, we can clearly see that these are all 4096 bytes disk writes.
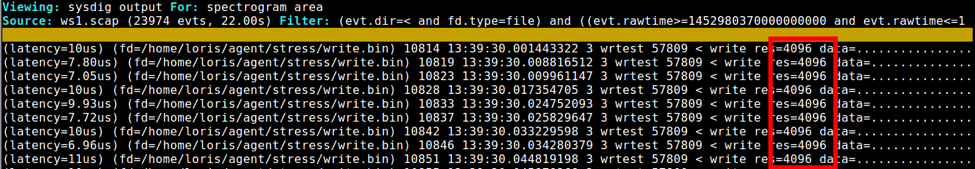
These writes are fast because they are smaller. This bimodal behavior is caused by the additional layer of buffering introduced by fwrite(). Data is stored by fwrite() before being flushed to disk, the first 4KB are written right away and then the rest of the buffer is flushed in (typically) a single second write.
Which way is the best one? Buffered or unbuffered?
Well, as usual it depends. In the case above, with big and sequential writes, avoiding the additional buffering offers more predictable latency and slightly better performance. On the other hand, check out what happens when we do many tiny 1-byte writes:
This is the spectrum of the left program:
As you can see, a lot write system calls cause the program to take tens of seconds to complete, and generate quite a bit of system stress:
This, on the other hand, is the spectrum of the second program:

Pretty short, eh? Everything is coalesced into few 4096KB buffers, the number of system calls is very low and the program complete in less than half a second.
Conclusions
Decisions that can seem negligible, like choosing which API you use when writing to disk, can have a big impact on the performance of your application.
The complexity of modern systems often makes it hard to determine what the implications of these decisions are. Measuring things tends to be extremely important, especially when paired with the right visualizations and the ability to drill down and investigate.
Luckily, sysdig and csysdig are very easy to install and can be a valuable aid.
50 Shades of System Calls https://t.co/uNXb9XbhMz pic.twitter.com/8cKgn9oCKo
— Sysdig (@sysdig) February 23, 2016