
Every sysadmin, operator, and even app developer has been there. There’s a spike in your dashboard and your #alerts Slack channel is firing off. Something has gone wrong, and you’re about to go into Perry Mason mode to track down the offender.
That’s hard enough in a typical environment, but often in a containerized environment you can’t even access data from the containers that were on the fritz. So you’re stuck with the well established, and well loved solution of killing the container to stop the issue.
The problem now is that your troubleshooting data is gone, and you have absolutely no clue as to the root cause of the alert. And let’s be honest – that dashboard that spiked? It was a great tip off, but in most cases it won’t hold the answer. Troubleshooting may start with a dashboard notification, but it certainly doesn’t end there.
Before We Begin:
Typical monitoring tools stop at alerts and leave you to SSH into the host, to grep logs (if you have them), drop into linux to use some combination of strace+htop+a hundred other tools to search for the data and get to the bottom of an issue. Not to mention sshing is also not feasible or even permissible in production environments for many users, and as many have learned, you often can’t even ssh into containers. Hopefully now you’re thinking “Hey, wouldn’t it be nice if I could automatically get a trace of 100% of what was going on in my system as soon as an issue started?”
Setting Up Automatic Captures With Sysdig Cloud
Luckily sysdig has some pretty powerful and comprehensive alerting capabilities, so setting up a Sysdig Capture is as simple as flipping a switch at the bottom of our alerting pane.
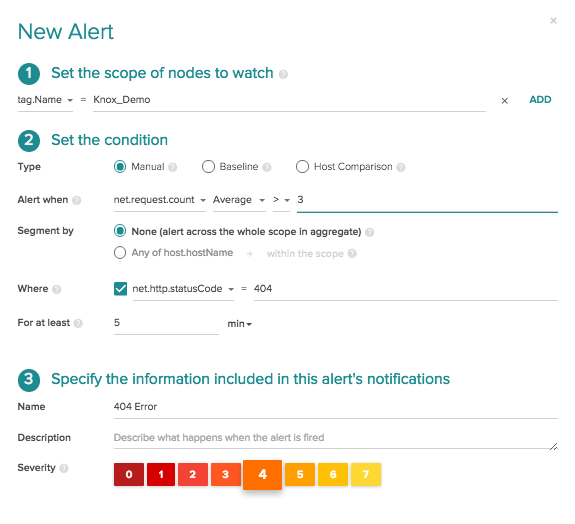
As you can see in the image below we have a simple status code alert set up to fire if the average 404 errors count is greater than 3 across my service. (The hidden beauty of this alert is it dynamically adapts based on the scope of my Frontend service, whether it’s on 2 hosts or across 20, but that’s another blog post!)
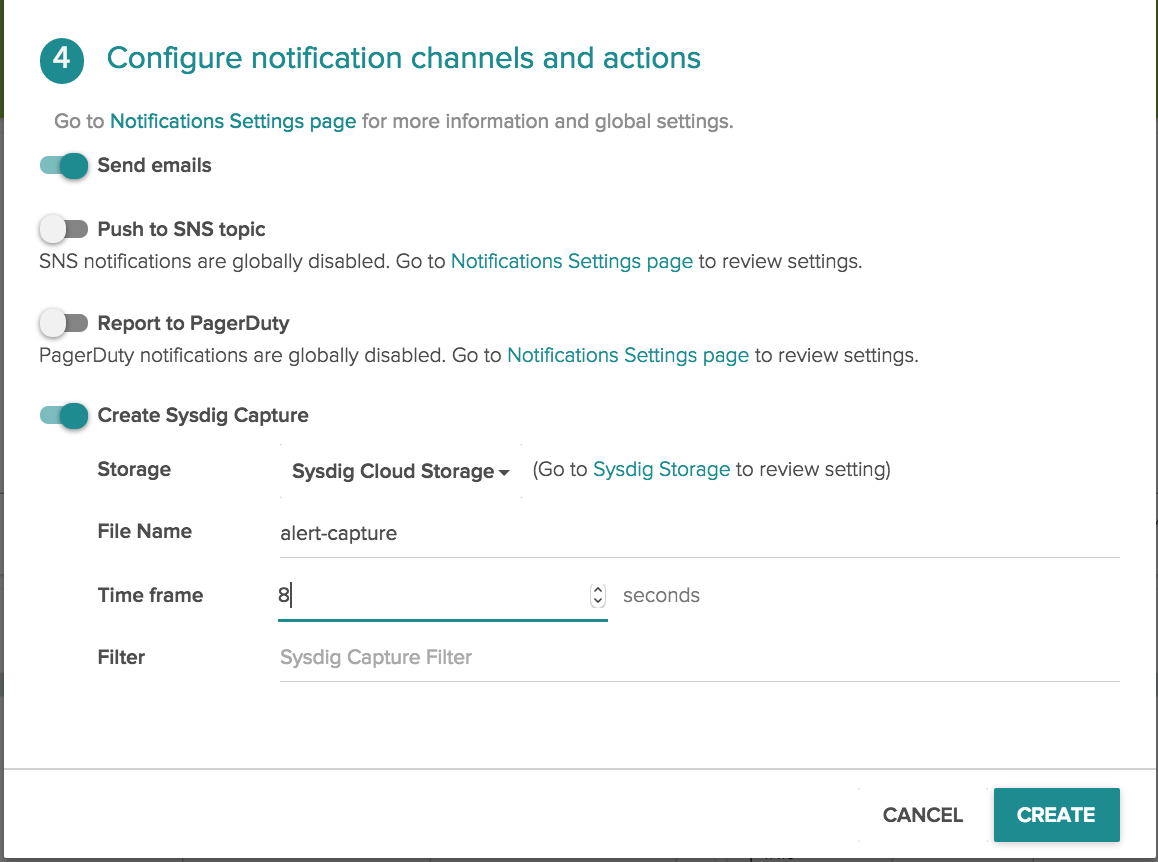
When we flip the sysdig capture switch, a dropdown menu appears where we can select the storage endpoint, the name of the sysdig capture file, and the amount of time that we want the sysdig capture to run.
A Walkthrough of the 404 Error Capture with csysdig
Now that we’ve created an sysdig capture based on an alert, let’s walk through troubleshooting that capture file to figure out the root cause of what went wrong. We’re going to use csysdig, the ncurses based UI that can run on top of sysdig.
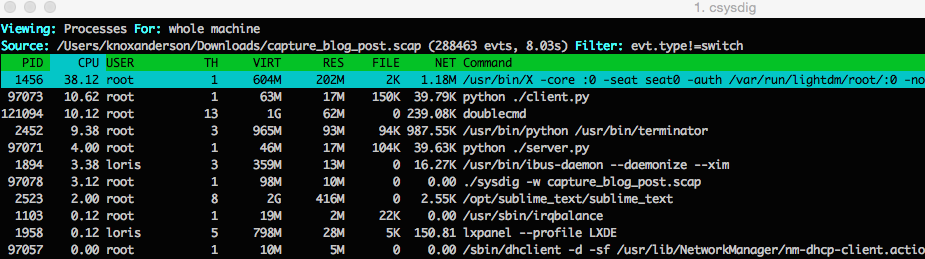
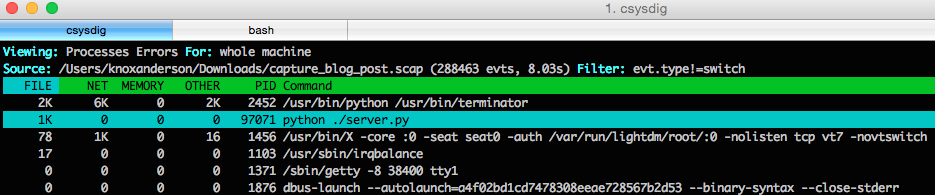
This first screenshot of below csysdig is the unfiltered output of a per process resource utilization view from sysdig trace file that ran for 8 seconds when the 404 status code alert fired.
csysdig has a range of different views to filter your capture based on common use cases. For this case we’ll want to use the Process Errors view to filter based on errors. Looking at all this view we can tell the python server is generating a ton of errors.
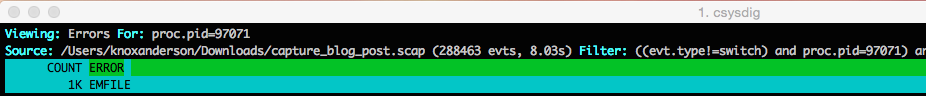
Next when we click into the python server we can see that there are over a thousand file not found errors. So next we’ll want to dig down and see what all the errors are.
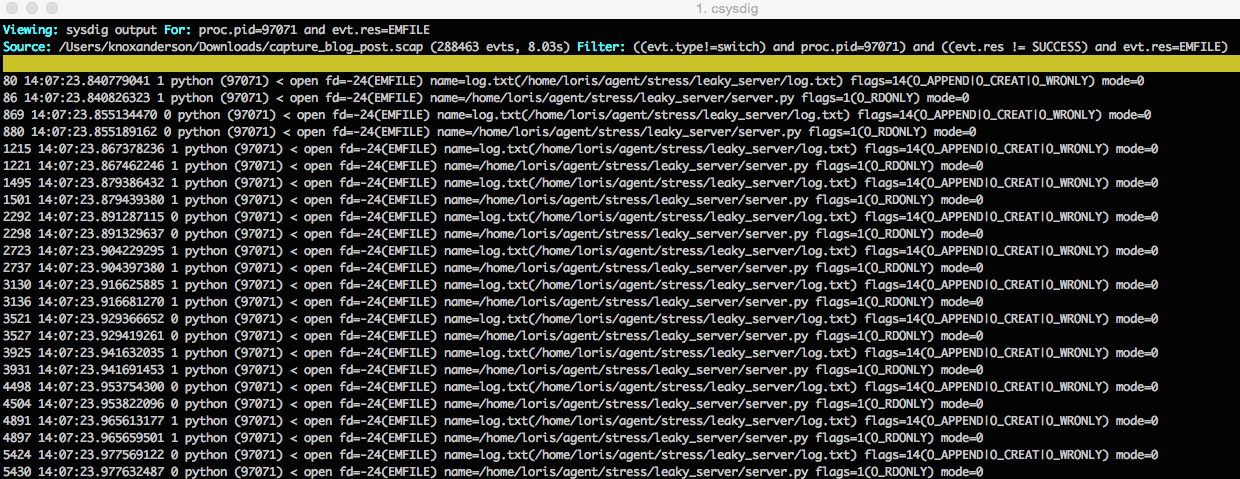
Using the dig command we can see that it’s always the same file that is being opened. So now we know the process can no longer open the log.txt file to write to it, and as a consequence the requests are failing. Now we’re cookin’ :)
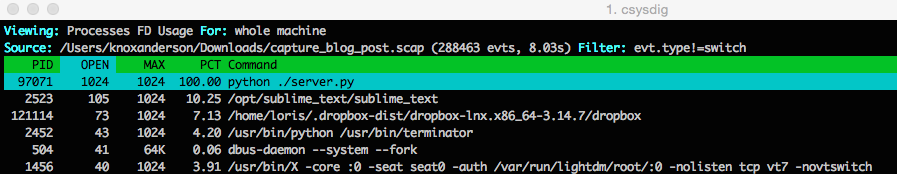
As a next step we can use the Processes FD Usage view and from there we can clearly see that the process has the maximum number of files open 1024/1024 . Now it’s pretty obvious that this process is stuck because of this issue.

Now we’ll want to figure out what is actually causing the file leak. To do this let’s switch out of csysdig and jump in sysdig. Here we can take the same trace capture and apply the chisel lsof to see a list of all open files and then finish up by filtering by the process name python to isolate the python server.

When we read the capture file we can see there’s a bunch of log.txt files open and that it’s the same file that we couldn’t open and write to earlier. Now we know that happened because each time this process is kicked off it’s not closing the file and will quickly hit the process file limit.
If you liked what you saw with sysdig and csysdig here’s a handy cheatsheet that has useful commands to filter for Network, File system, Security, Logs, and general systems use cases.
Conclusion
Sysdig Cloud automatic capture not only makes troubleshooting easier, but it make troubleshooting possible in your ephemeral containerized environments. And instead of troubleshooting just being limited to a spike on a dashboard, we wanted to give you deep deep tools to actually help isolate the problem.
Too often the approach has been for the Ops team to kill the problem container, and then go back to the developers and say something went wrong. You can still choose to do that, but now with the ability to give your development team a sysdig capture file where they can drill down and see every single process that was going on at the time the alert fired. This deep visibility that is something we find quite useful, but more importantly perversely fun. Give it a shot with Sysdig Cloud, and let us know what hole you dig yourself out of.