

In the following tutorial I will show how to monitor Docker Swarm using Sysdig Monitor. Docker Swarm is the Docker Engine feature for container orchestration and cluster management. It’s a fundamental component of Docker’s platform – their Enterprise Edition also relies on Swarm as the orchestration scheduler.
We have previously discussed the importance of leveraging container orchestration platform metadata to effectively monitor services running on top of moving containers. In an orchestrated environment, we want to understand how services operate globally by aggregating data effectively, but at the same time when troubleshooting an issue we must be able to drill down to specific container or process metrics. This complex process breaks many legacy monitoring tools due to the large number of discrete containers and the multiplicative effect of having of dozens of pieces of metadata for every single metric you collect.
Sysdig Monitor now can automatically import and understand Docker Swarm metadata providing best in class Docker Swarm infrastructure and service monitoring capabilities for production users. We can leverage this metadata across host, container, network, and application data, including custom metrics. Before we dive into the details of monitoring Docker Swarm, let’s talk about Docker Swarm metadata. How to monitor #Docker #Swarm: metrics and alerts for nodes, tasks and services Click to tweet
Monitor Docker Swarm resources and metadata
How can a monitoring tool understand the different pieces that comprise your infrastructure, and how your services are architected? Let’s go through Docker Swarm’s main concepts and resources and see how we can use them as metadata from a monitoring perspective:
Monitor Docker Services, stacks, tasks
Applications are deployed in Swarm using services. Creating services can be done directly invoking the docker service command, for example:
$ docker service create --name wordpress
--replicas 2
-p 80:80
--network wpnet
--env WORDPRESS_DB_HOST=mariadb
wordpress:php7.1-apache
But we can use also docker stack that deploys the services defined in a docker-compose like file:
version: "3"
services:
  wordpress:
    image: wordpress:php7.1-apache
    ports:
      - 80:80
    networks:
      - wpnet
    depends_on:
      - mariadb
    deploy:
      replicas: 2
      update_config:
        parallelism: 2
        delay: 10s
      restart_policy:
        condition: on-failure
    environment:
      WORDPRESS_DB_HOST: "mariadb"
      WORDPRESS_DB_NAME: "wordpress"
      WORDPRESS_DB_USER: "wordpress"
      WORDPRESS_DB_PASSWORD: "changeme"
networks:
  wpnet:
    external: true
#    attachable: true # not implemented
# run instead: docker network create --driver overlay --attachable wpnet
And then deploy it:
$ docker stack deploy --compose-file wp-stack.yml wordpress
Stacks group a number of services that compose an entire application. For example the WordPress stack above, it would also include the MariaDB database definition.
Docker Swarm schedules tasks as the unit of work across the different computing nodes. These tasks finally run the Docker containers. We can find some similarities between Docker Swarm tasks and Kubernetes pods.
Sysdig Monitor makes the following new labels available through the Explore tab, graphs and dashboards, alerts and also teams. As I’ll show you in the examples below, this allows you to dynamically group your infrastructure and drill down in any pattern that makes sense for your issue at hand.
All this metadata is automatically collected from Sysdig agent using Docker API, and requires no additional instrumentation from the user. This is especially powerful since Docker Swarm may be moving or scaling tasks at any time. If you must manually collect metadata, you’ll never be in sync with your infrastructure.
swarm.service.name: the service name. You can see your defined services withdocker service ls.swarm.service.id: unique service identifier. You can find it doingdocker service inspect your_service.swarm.task.id: unique task identifier.swarm.task.state: the state of the task, that can be running running, shutdown, and accepted.swarm.service.label: contains the labels for the service, including custom ones you might create like thisdocker service update --label-add environment=production wordpress_wordpress.swarm.service.label.stack.namespace: this label is particularly interesting because contains the stack name if the service was deployed via stacks.swarm.service.task.running: the number of tasks (and therefor containers) running for that service.swarm.service.task.desired: the number of replicas we want to have running for that service.
Monitor Docker Nodes (managers and workers)
There are also a number of properties available for nodes. Most of these attributes are also present in the output of docker node ls and docker node inspect the_node.
swarm.node.name: the name of the node, typically matches the hostname.swarm.node.id: unique node identifier.swarm.node.role: role of the node, either manager or worker.swarm.node.state: if the node is ready or down.swarm.node.availability: if the node is ready to accept new tasks, or is being drained or paused.swarm.node.version: the Docker Engine version.swarm.node.label: contains the labels for the node, including custom ones you might create like thisdocker node update --label-add provider=aws your_node.swarm.manager.reachability: if the manager Raft status is reachable.
Exploring and Monitor Docker Swarm cluster infrastructure
Using the Sysdig Monitor Explore tab we can browse across your entire infrastructure. A new pre-built grouping is available for Docker Swarm that shows your hosts and containers grouped using swarm.service.name > swarm.task.id > container.id.
 You can fully customize the grouping, for example by adding a top level with the label
 swarm.service.label.stack.namespace.
 You can also customize the columns shown in the explore table, adding some useful information like
 swarm.node.role, swarm.node.state or swarm.node.availability.
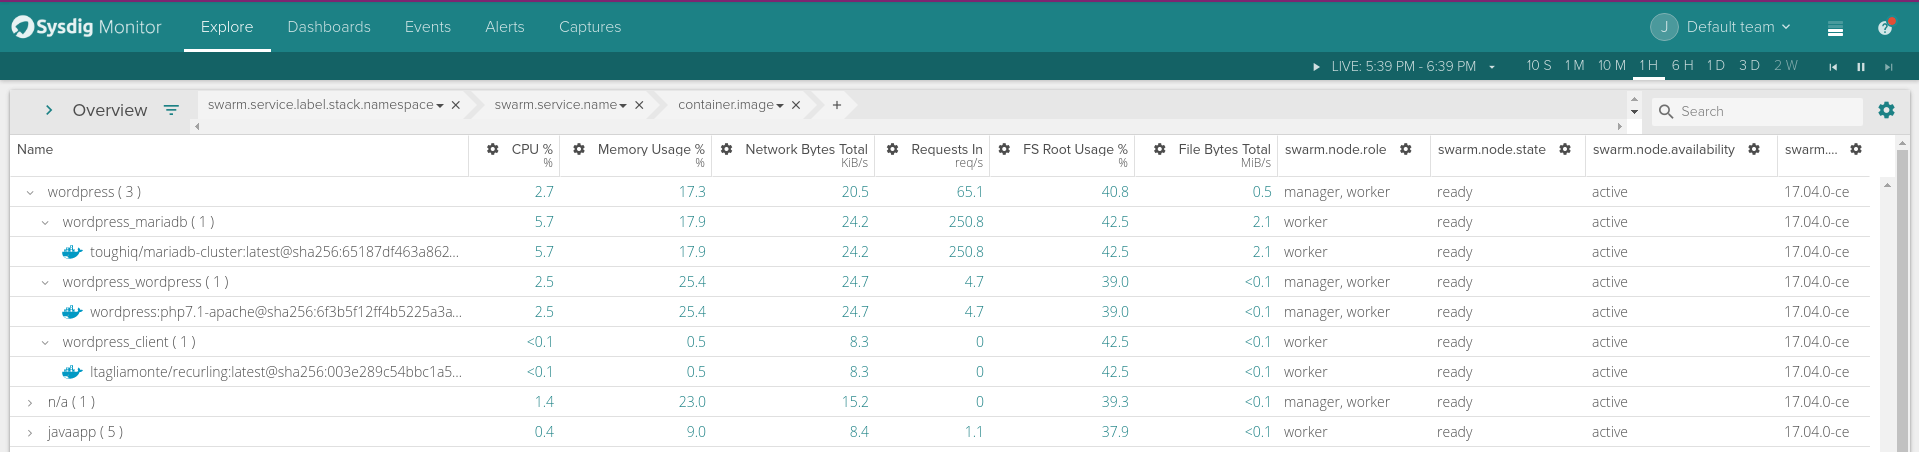 While the top view gives us a look at our physical infrastructure in terms of nodes, the lower view give us a logical understanding of our applications as deployed by Docker Swarm. We’re now in a place where we can monitor Docker swarm from a physical and application perspective.
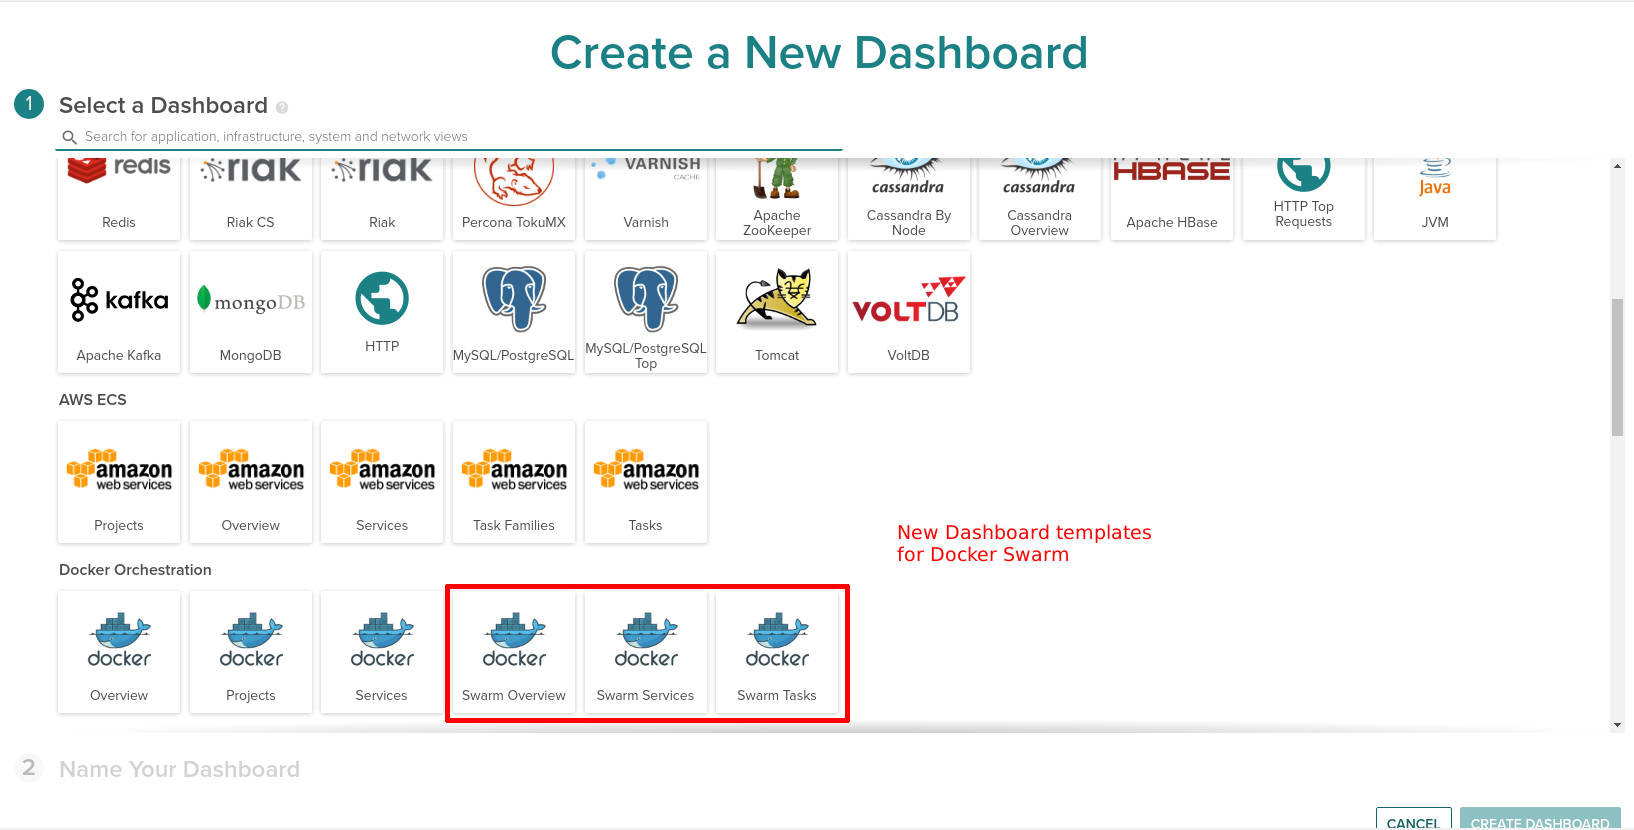
Docker Swarm monitoring views and pre-built templates
In addition of Docker Swarm metadata, we wanted to provide some pre-built views of your Docker Swarm cluster: Swarm Overview, Swarm Services and Swarm Tasks.
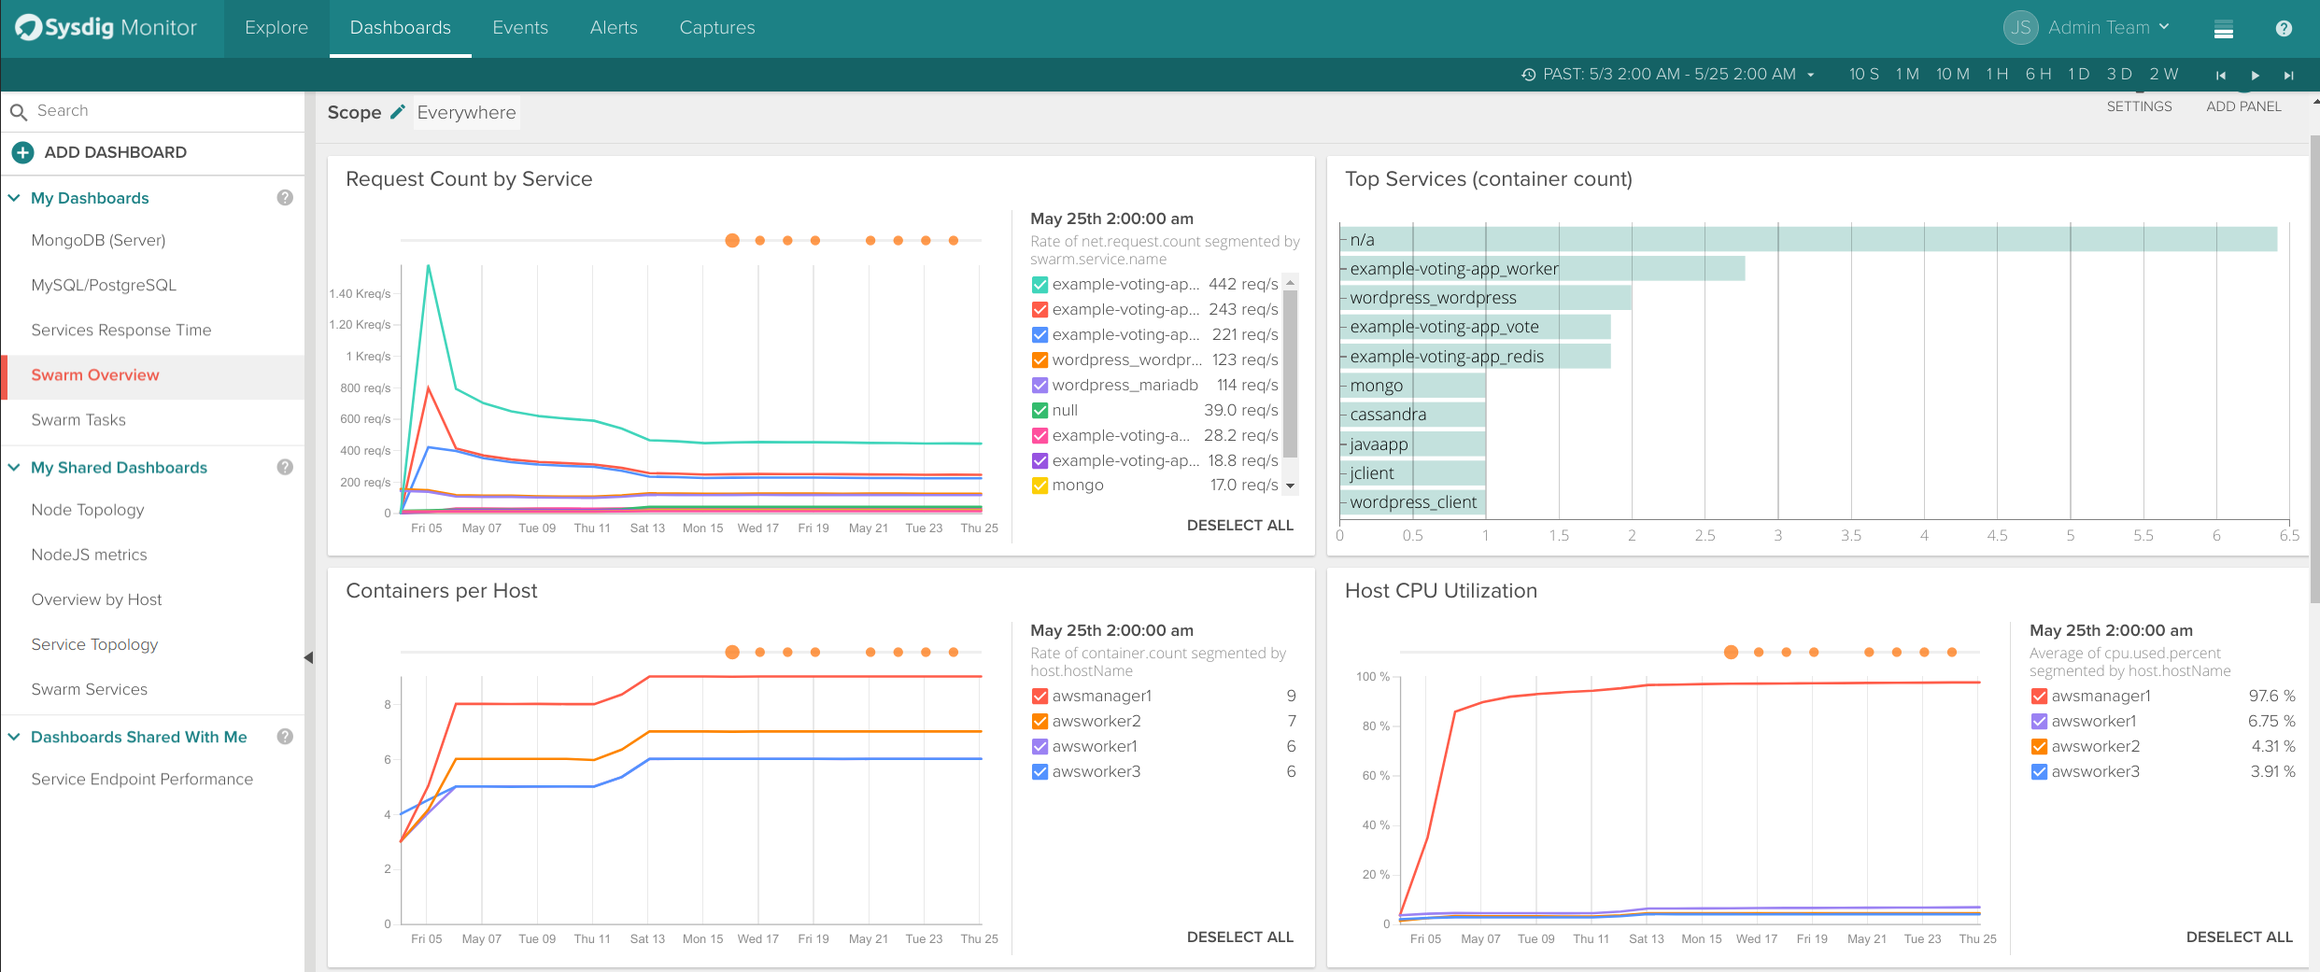
 The Swarm Overview dashboard includes relevant metrics like request count by service, top services, containers per host, CPU usage, etc.
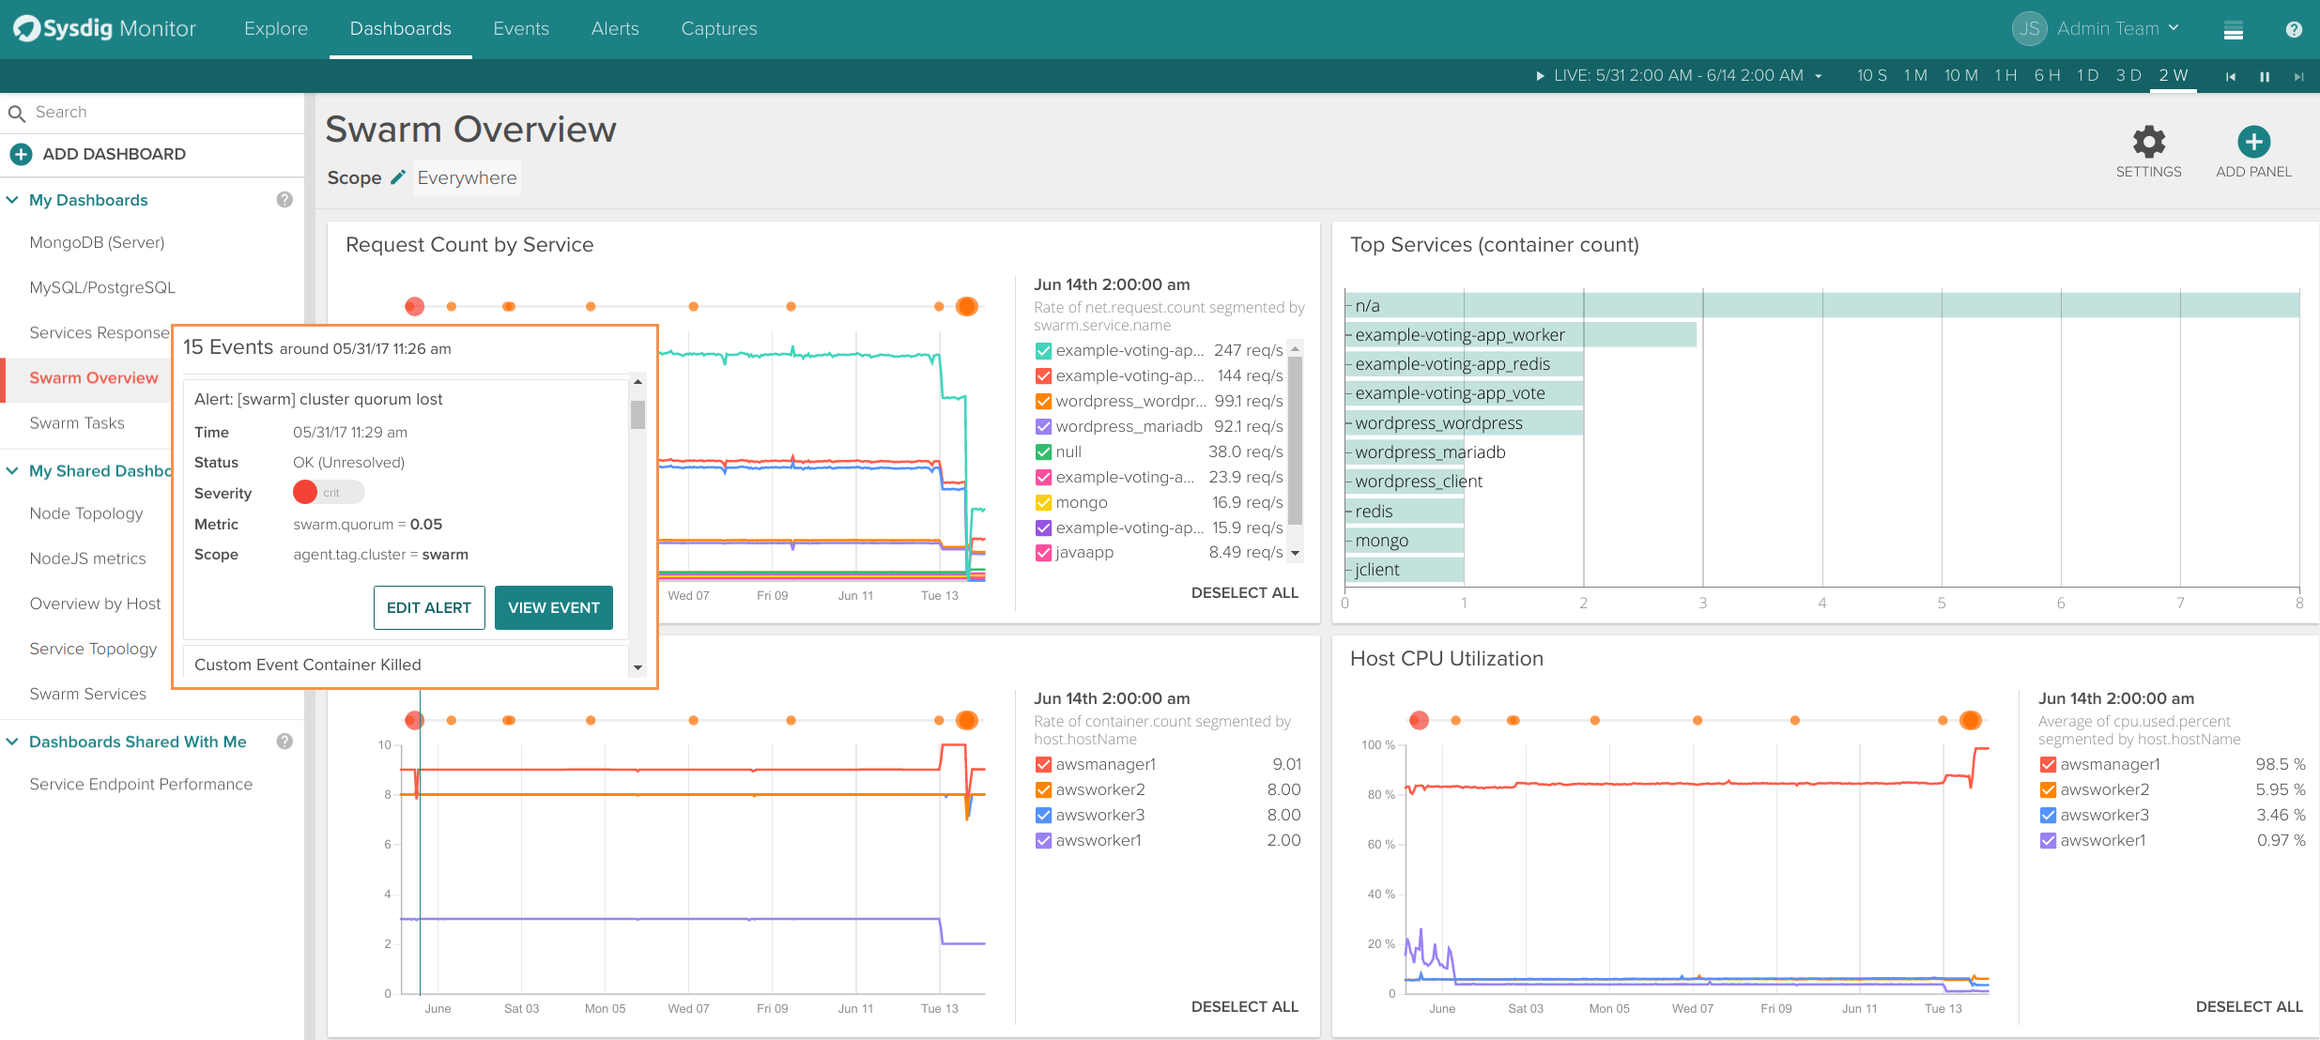
 The Swarm Services dashboard includes more service specific metrics like container count, request time or request count. Events from Docker Engine (like a container being killed) and alerts appear overlayed in the time series graphs.
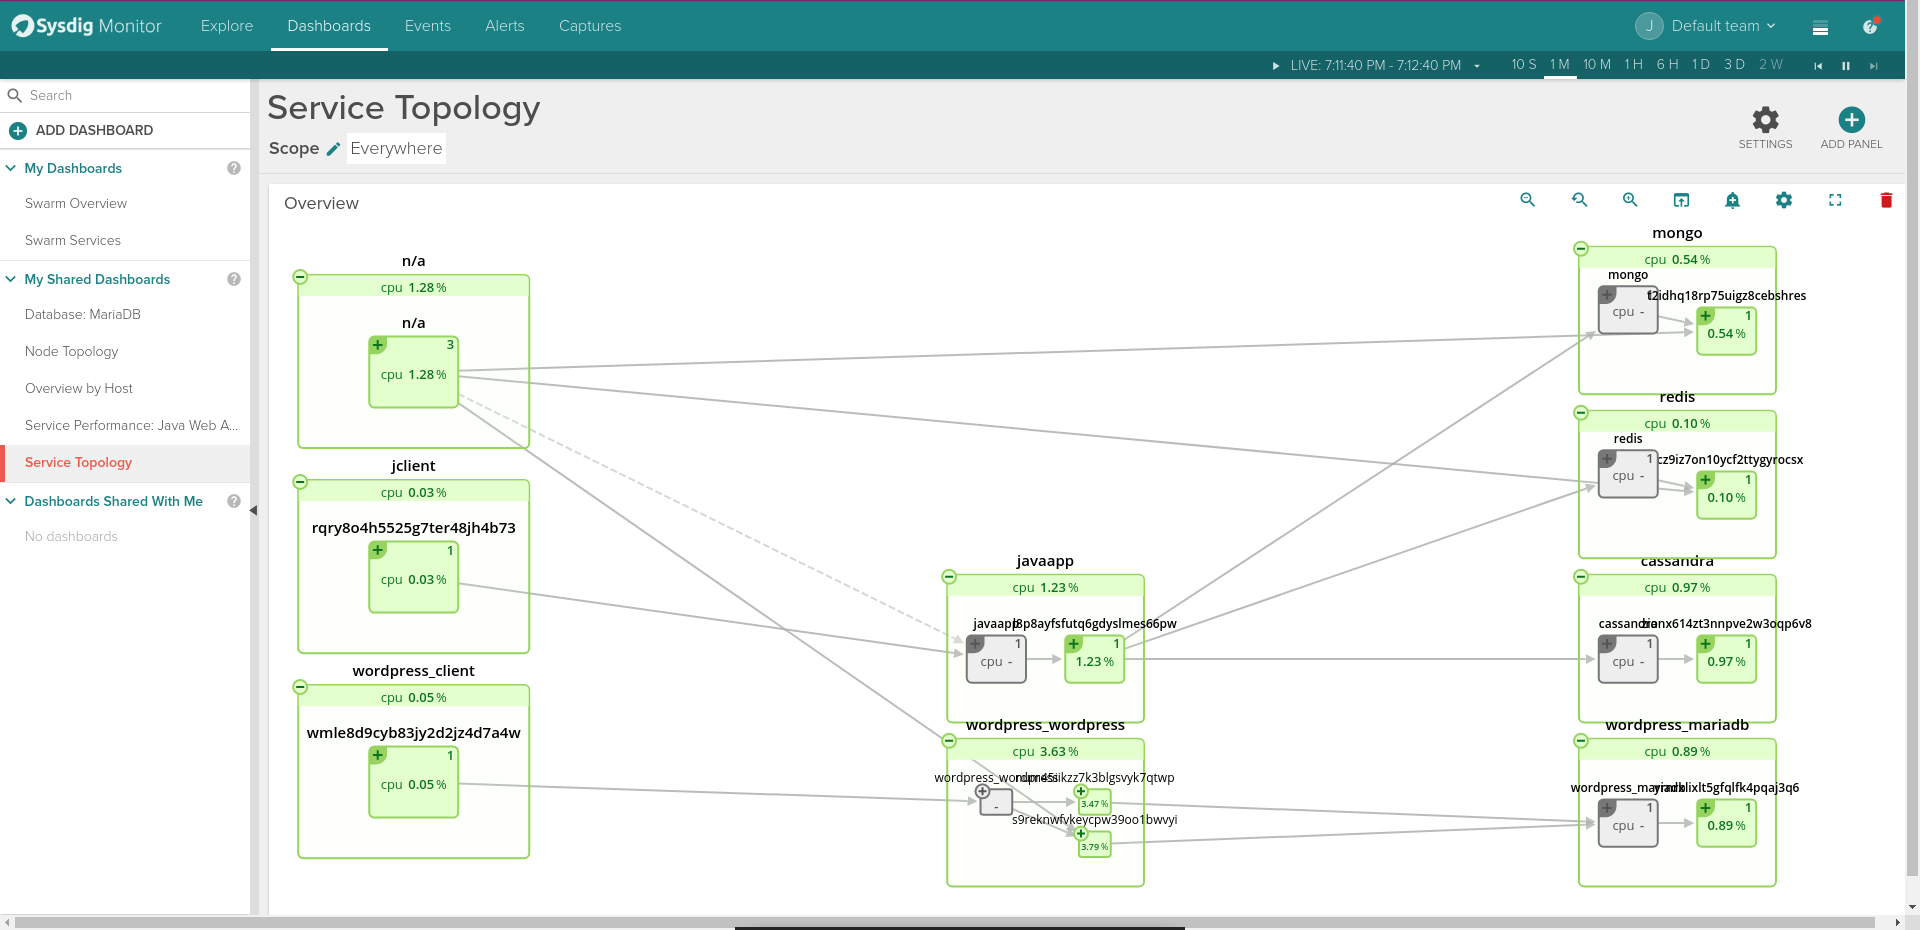
 Obviously we couldn’t miss one of our most visually appealing features: the topology maps now support Docker Swarm metadata. The following example shows 2 applications: a wordpress service talking to a mariadb service and a java app with 3 databases backends.
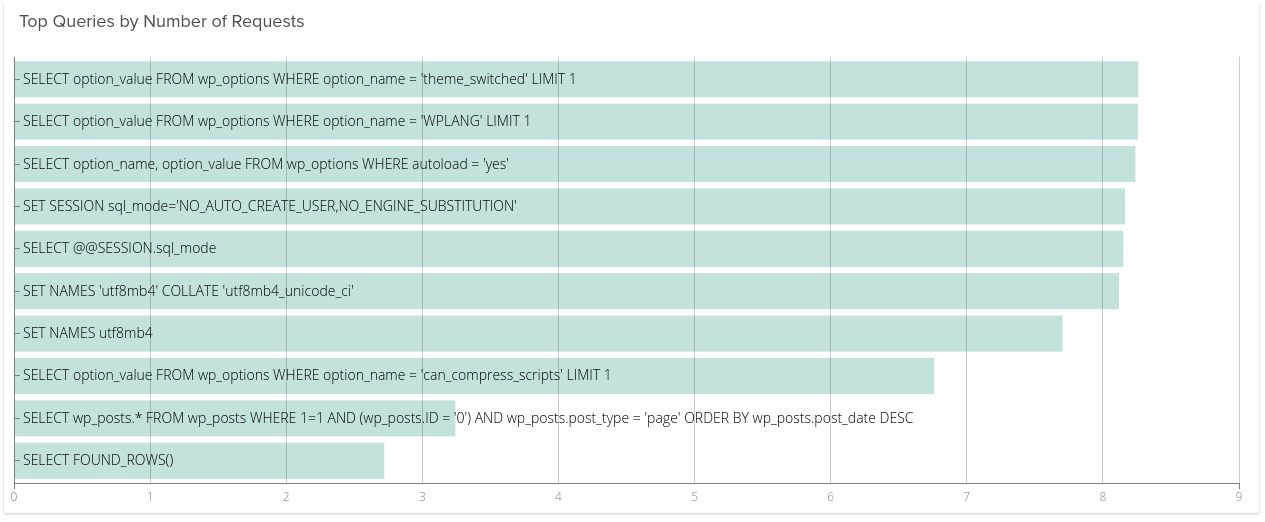
 Finally, the beauty of the Sysdig approach is that we don’t just see containers and tasks, but we also see your application components running inside your containers, without requiring application code changes. For example here are the slowest queries from our MariaDB service:
Monitor Docker Swarm alerts
All this metadata information is available to define alerts and notify us through email, Slack or any other of Sysdig supported channels. Let me show you my 4 favourite alerts for Docker Swarm:
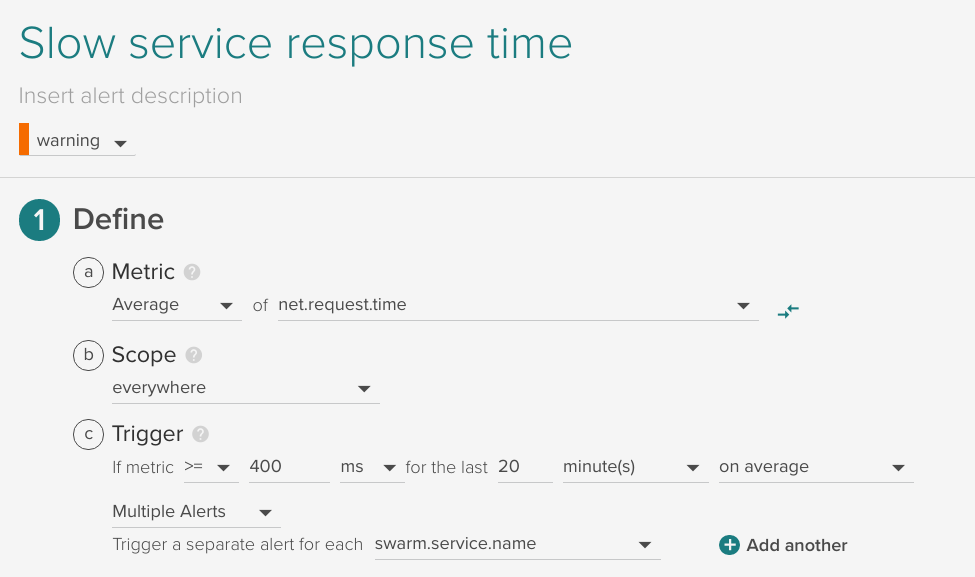
Slow service response time
Trigger an alert when the any given Swarm Service has an average response time that exceeds a threshold. This is applied automatically to any service defined in Swarm:
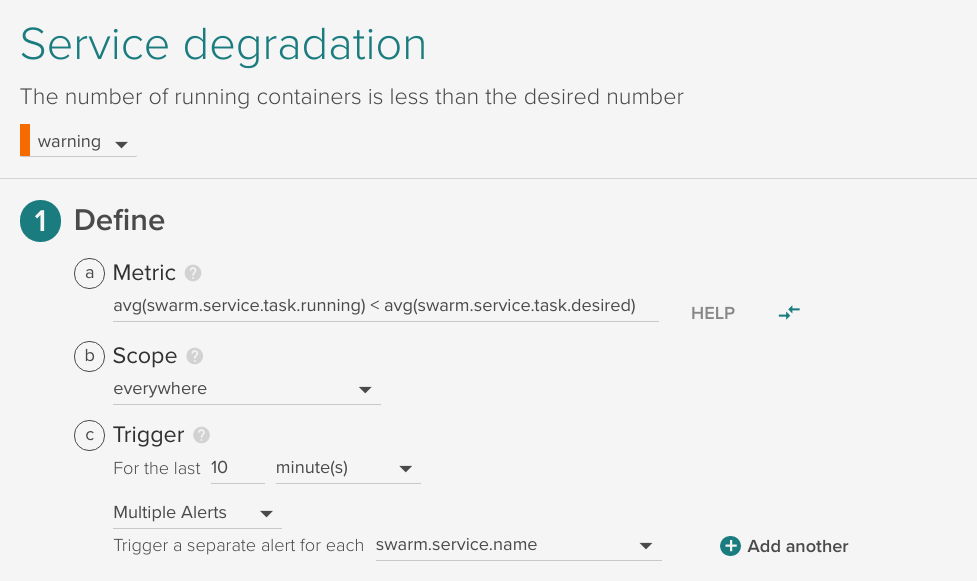
Service degradation
Trigger an alert when the number of running tasks is less than the desired for 10 minutes, applied automatically to any service defined in Swarm:
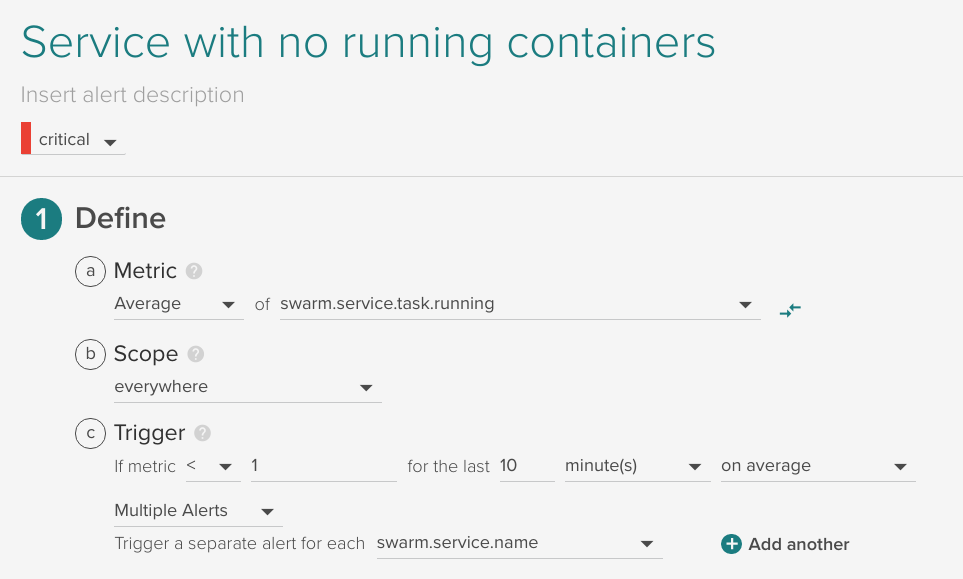
Service with no running containers
Trigger an alert when a defined service has no running containers, applied automatically to any service defined in Swarm:
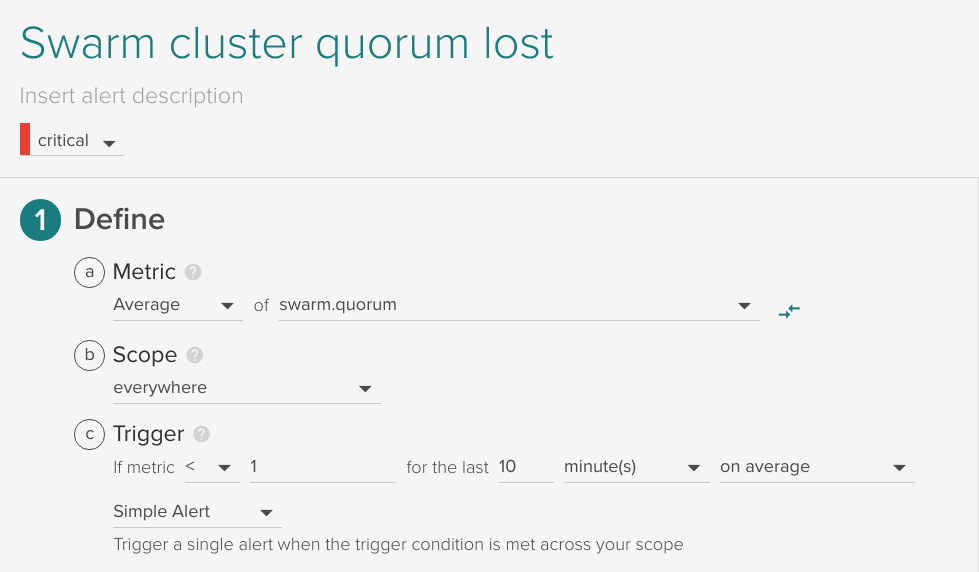
Swarm cluster quorum lost
If the Docker Swarm Raft quorum is lost, trigger an alert. This is calculated already as a metric swarm.quorum.
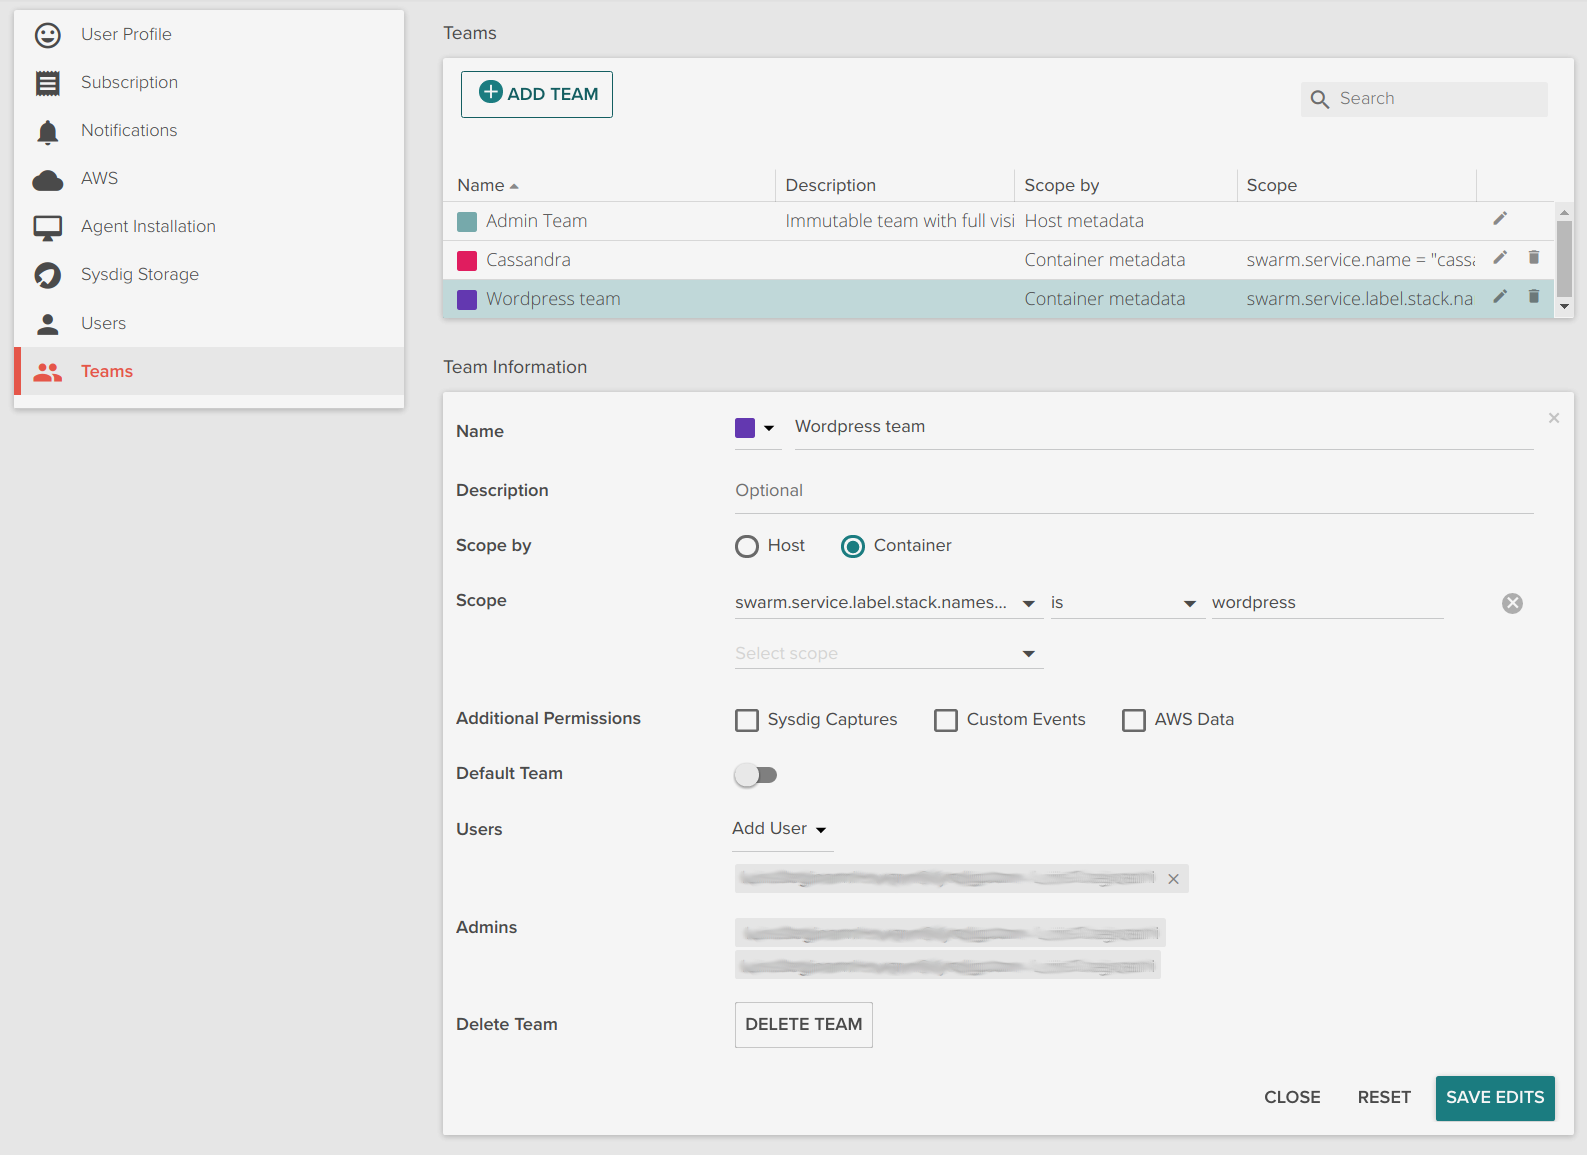
Docker Swarm multi-tenant teams
Sysdig Monitor’s multi-tenant feature known as teams can also use Docker Swarm metadata to limit the visibility of users. The following is an example of a WordPress team that has access only to the wordpress application defined via a stack.
Get started!
Monitoring Docker Swarm with Sysdig is extremely easy, and provides deep visibility inside containers. Because Sysdig understands Swarm metadata, it can immediately provide the right metrics in the appropriate context and grouping. You are just 2 steps away from monitoring your Docker Swarm cluster:
- Sign up for a 15 day Sysdig Monitor free trial
Deploy Sysdig agents across your Swarm cluster running:
docker run -d --name sysdig-agent --privileged --net host --pid host-e ACCESS_KEY=YOUR-ACCESS-KEY -e TAGS=example_tag:example_value -v /var/run/docker.sock:/host/var/run/docker.sock -v /dev:/host/dev -v /proc:/host/proc:ro -v /boot:/host/boot:ro -v /lib/modules:/host/lib/modules:ro -v /usr:/host/usr:ro sysdig/agent
From there you’ll see your host, container, application, and network metrics all in one place. You’ll also be able to correlate Docker events with your metrics so you can get the full picture.