
In this article we are going to show how to set up Nginx alerts associated with common failure points and early risk mitigation when running on Kubernetes. This is the second part of the How to monitor Nginx on Kubernetes post.
How to monitor Nginx
On the first part of these Nginx monitoring posts we saw the Nginx stub_stats module configuration, the relevant metrics (active connections, requests per second, etc) and how to work with them using Kubernetes metadata labels, illustrated with several examples:
- Nginx stub_status configuration in the Nginx Docker image running as Kubernetes pod using a ConfigMap.
- Monitoring Nginx metrics from service level metrics like requests per second to HTTP protocol metrics status code and service response time.
- Nginx Dashboards that give you an overview of your Nginx health and performance.
- Using Kubernetes labels to monitor Nginx. Several monitoring and troubleshooting use cases and examples applying the context-aware Kubernetes labels.
Now that we have laid the foundations to monitor a Nginx deployment on Kubernetes, let’s configure the some of the most relevant alerts.
Nginx alerting
Taking the Nginx deployments described in the last post as a starting point, we have to consider the most critical and/or most frequent failure scenarios. This is our checklist when configuring the most important alerts in a typical Nginx deployment on Kubernetes:
- Kubernetes failing to deploy or run the Nginx service.
- Nginx image failing: PodCrashLoopBackOff?
- Nginx is dropping user connections.
- Degraded service quality / response time.
- Web backends reporting HTTP error codes.
Running #Nginx on #Kubernetes? These are the 5 alerts that you should setup! Click to tweet
Alert on Nginx Kubernetes deployment
Probably the most urgent and obvious case would be the loss or unavailability of your Nginx pods in the Kubernetes cluster.
Let’s configure this basic alert:

Average of kubernetes.replicaSet.replicas.running over the last 2 minutes.
You may be wondering Why a threshold of 0.8?. Take into account that this is an average value over a fixed time slot and that we want to alert as soon as possible. For this metric to be exactly 0 it needs to be 0 during the entire period.
Typically, you will specify the number of Nginx replicas that you want to keep running using a ReplicationController or ReplicaSet. Kubernetes will spawn new nodes when required to meet your criteria. With this alert we want to check that absolutely none of our Nginx pods are running.
What if Kubernetes fails to deploy new Pods but existing ones keep running? This might happen on a rolling deployment or when having auto-scaling. Then you need to also compare the current running and desired parameters. You can do that using an advanced alert like this one:
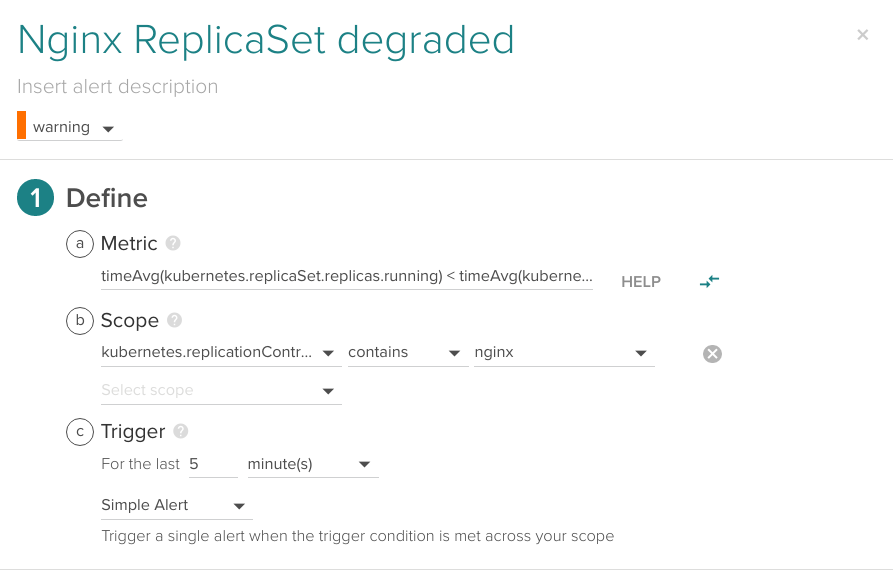
Comparing timeAvg(kubernetes.replicaSet.replicas.running) < timeAvg(kubernetes.replicaSet.replicas.desired) for the last 5 minutes.
If you want to know more about how to configure advanced alerts in Sysdig Monitor using time aggregation and optionally group aggregation, advanced alert syntax is described here.
Nginx image failing to run
There are several reasons why the Nginx image deployment may not be able to run. Maybe the most common one is misconfiguration (errors in the config files of the pod services) but there are other cases like unmet image requirements or capacity limits.
If you happen to deploy a container with any of these issues, it will fail and be restarted by Kubernetes in a loop. This is called CrashLoopBackOff. You want to be alerted of this failed deployment as soon as possible:
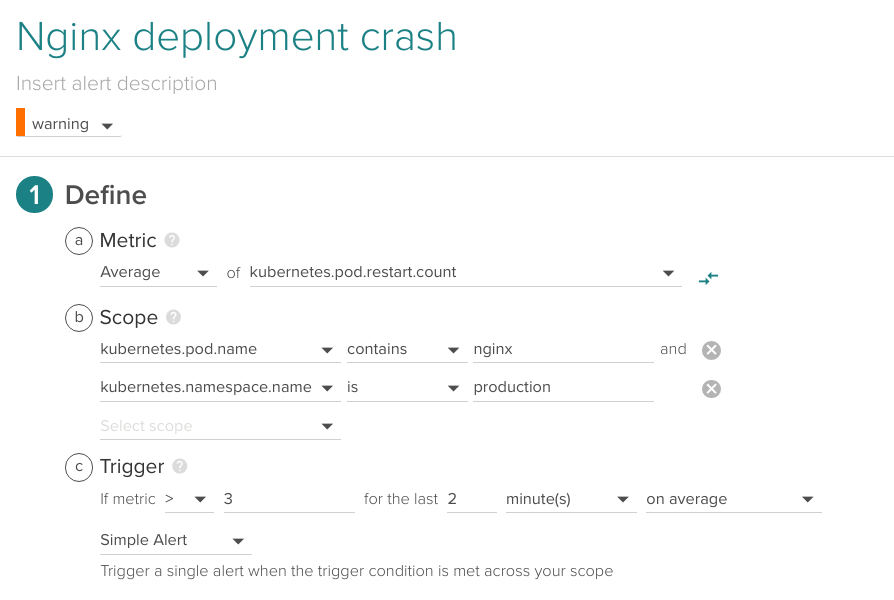
Average of kubernetes.pod.restart.count higher than 3 for the last 2 minutes, production Kubernetes namespace.
Another way to detect problems with your image deployment is using the Kubernetes and Docker event alerts.
In Sysdig Monitor you can see these events as circles added on top of any time series graph:
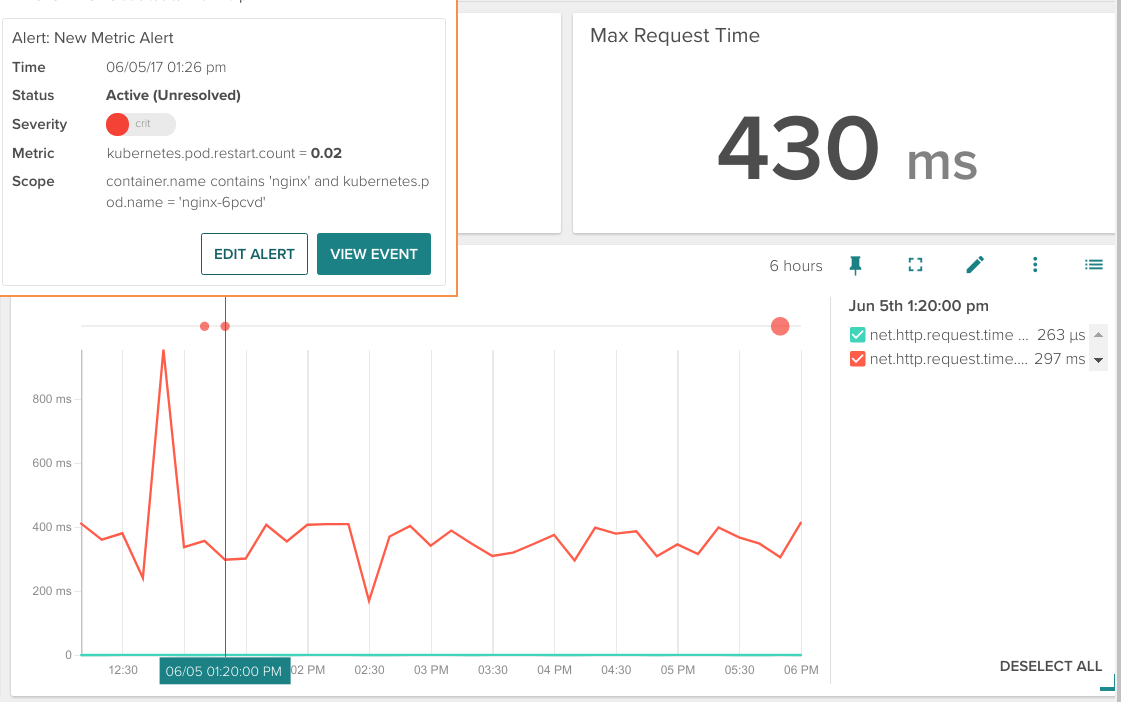
Hovering your mouse cursor over the event circle will show you a more detailed description.
You can also create an event-based alert using the Container killed filter since it will happen repeatedly if Kubernetes is not able to bootstrap the image:
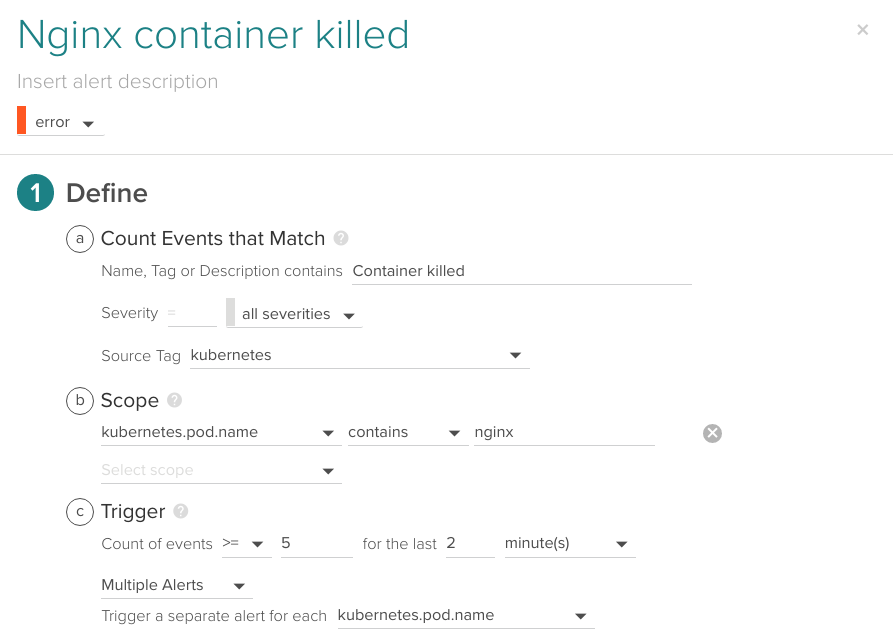
Kubernetes event contains the “Container killed” string, this event happens at least 5 times in the last 2 minutes.
Take into account that a single Container killed may be harmless or even expected depending on your deployment (for example Kubernetes rescheduling the pod in a different node). That’s why we alert when the ratio of containers killed per minute is unusual.
Troubleshooting Nginx CrashLoopBackOff
This scenario is one of the multiple cases when the Sysdig Capture in Sysdig Monitor together with Sysdig open-source shows its potential to debug the underlying issues. Even after the containers that originated that error are gone and everything is back to normal again.
You can enable it configuring these parameters on section 3 of the alert configuration form:
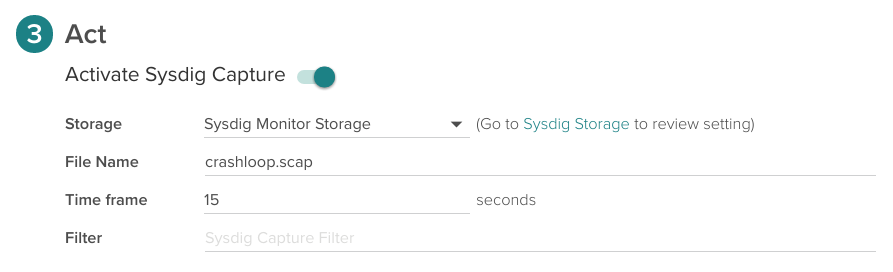
And retrieve the captures later on from the Capture tab in Sysdig Monitor interface.
Using the sysdig and csysdig tools you can then inspect the system calls capture file.
For example, listing the containers present in the capture file:
$ sysdig -r crashloop.scap -c lscontainers
The replica declares only 3 concurrent pods, but there are a lot of short-lived Nginx pods (see the full output here).
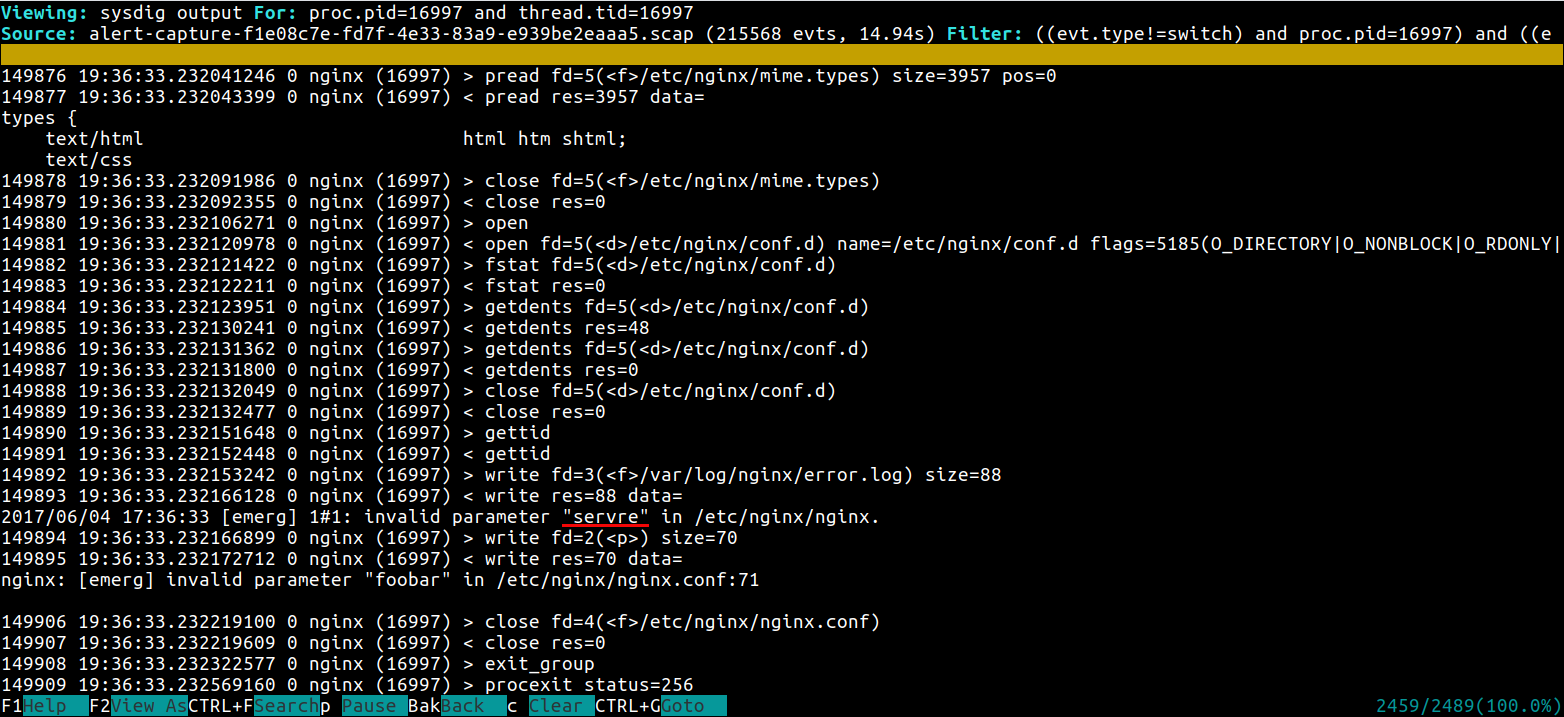
Can you get the standard error output of a process that doesn’t exist anymore? Using Sysdig, you can!
$ sysdig -r crashloop.scap -A -c stderr proc.name=nginx

    nginx: [emerg] invalid parameter “servre” in /etc/nginx/nginx.conf:71
Let’s use the visual csysdig ncurses tool now that we have a pretty good clue of where is the error:
$ csysdig -r crashloop.scap
This time it was just a small typo error in the config file, but having total visibility of the system calls in a manageable interface where you can filter, search and visualize the dump data can help you debug much harder problems.
Nginx Dropped connections
If Nginx is dropping connections maybe it’s just malformed client requests, but if it’s happening frequently it may signal other issues like an anomalous requests overflow surpassing your Nginx configured limits (DDoS attacks, for example) or resource limits on the pod.
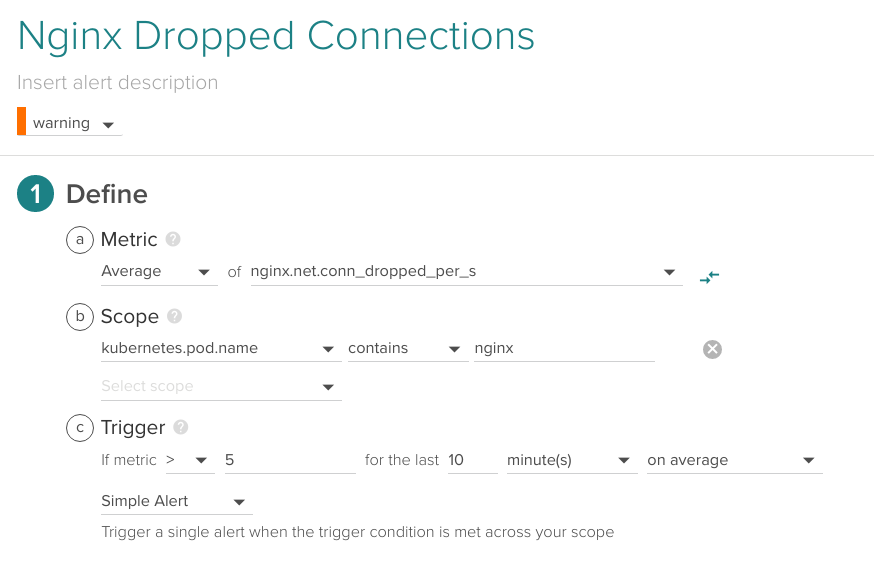
Average of nginx.net.conn_dropped_per_s higher than 5 for the last 10 minutes.
Nginx Service Quality
It is probably a good idea to fire an alert when your users are experiencing unresponsiveness, service response time metrics and HTTP service response time is available without code instrumentation for any microservice in your Kubernetes when using Sysdig Monitor:
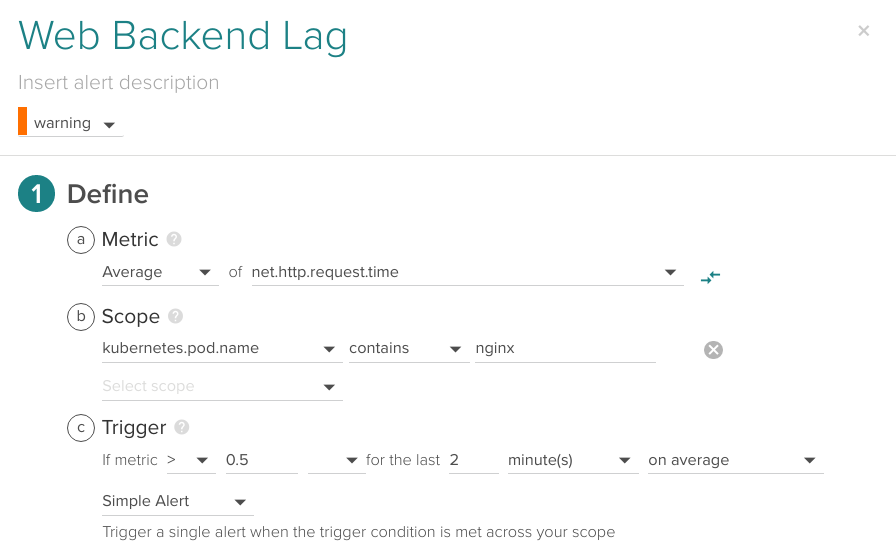
Average of net.http.request.time higher than 0.5 seconds for the last 2 minutes.
Nginx HTTP error codes
As we mentioned in the previous chapter, using Sysdig Monitor you can retrieve the HTTP response codes out of the box. The 4xx (client errors) and specially 5xx (server errors) are clear symptoms of backend problems.
You probably want to raise an alarm if the amount of HTTP error codes raise above a certain limit specific to your scenario.
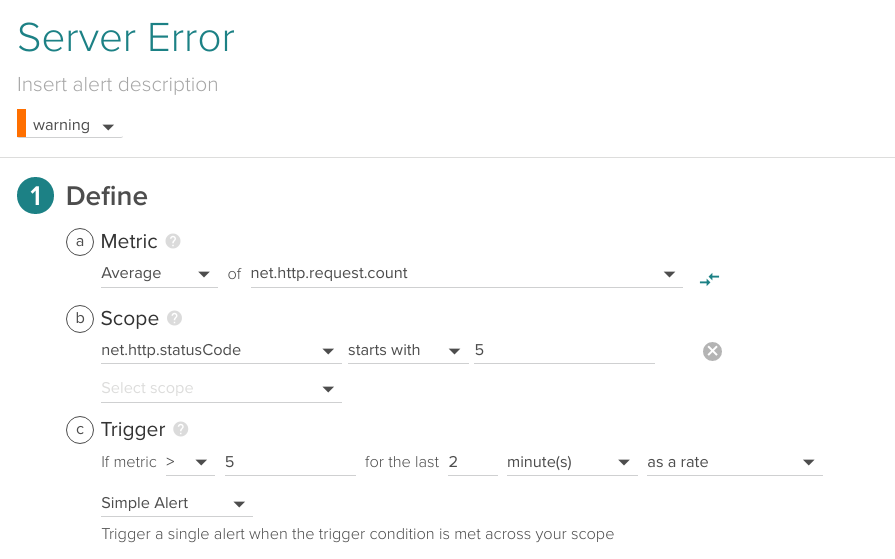
Average of net.http.request.count with net.http.statusCode starting with ‘5’ (5xx) higher than 5 for the last 2 minutes.
In the alert above, we will perform a separate check over each different Kubernetes service but you can also define an specific Pod or Kubernetes service in the Scope section. Using the scope conditions you can easily group several HTTP codes or just alert on specific ones.
Imagine that instead of the 5xx catch-all described above, you want to alert specifically on 500 Internal Server Error and 503 Service Unavailable for a specific URL.
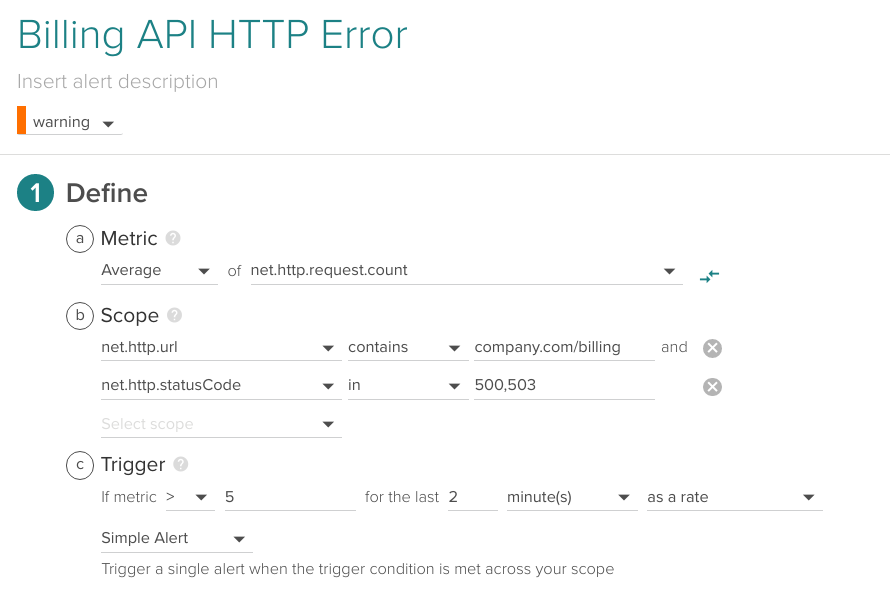
Average of net.http.request.count for net.http.url “company.com/billing” and net.http.statusCode 500 or 503 higher than 5 for the last 2 minutes.
Conclusions
In this article we have covered the common failure or service degradation scenarios for the Nginx server in a Kubernetes deployment context.
Being able to use any combination of:
- Lower level operative system metrics (memory or CPU usage, etc),
- HTTP parameters (return status code, URL, method, etc),
- Nginx metrics (connections per second, active connections, waiting connections, etc),
- Orchestrator-level information (Kubernetes and Docker events, CrashLoopBackOff status, metadata tags like namespaces, services deployments, replicaSets, etc),
Provides a great deal of flexibility and meaningful context to fine-tune your alerting and notifications. Out of the box, no code instrumentation, no libraries, modified binaries or modified container images adding weight and complexity to your neat deployment. Haven’t tried yet? Jump to our 15-day free trial!