


Falco Feeds extends the power of Falco by giving open source-focused companies access to expert-written rules that are continuously updated as new threats are discovered.

CrashLoopBackOff is a Kubernetes state representing a restart loop that is happening in a Pod: a container in the Pod is started, but crashes and is then restarted, over and over again.
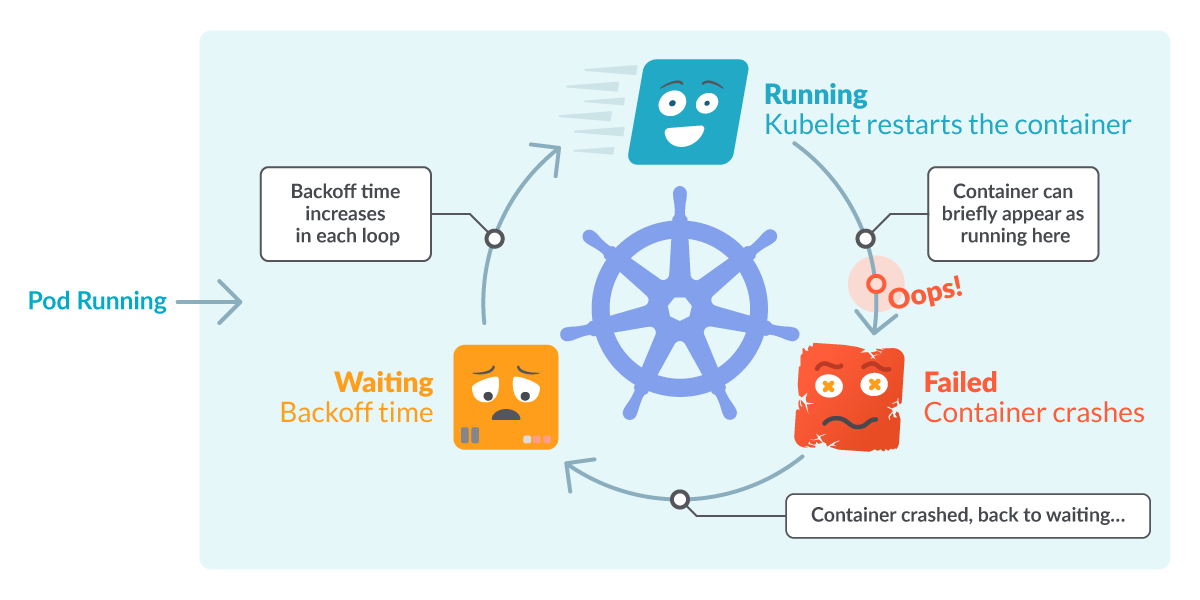
Kubernetes will wait an increasing back-off time between restarts to give you a chance to fix the error. As such, CrashLoopBackOff is not an error on itself, but indicates that there’s an error happening that prevents a Pod from starting properly.
Note that the reason why it’s restarting is because its restartPolicy is set to Always(by default) or OnFailure. The kubelet is then reading this configuration and restarting the containers in the Pod and causing the loop. This behavior is actually useful, since this provides some time for missing resources to finish loading, as well as for us to detect the problem and debug it – more on that later.
That explains the CrashLoop part, but what about the BackOff time? Basically, it’s an exponential delay between restarts (10s, 20s, 40s, …) which is capped at five minutes. When a Pod state is displaying CrashLoopBackOff, it means that it’s currently waiting the indicated time before restarting the pod again. And it will probably fail again, unless it’s fixed.
In this article you’ll see:
- What is CrashLoopBackOff?
- How to detect CrashLoopBackOff problems
- Common causes for a CrashLoopBackOff
- Kubernetes tools for debugging a CrashLoopBackOff
- How to detect CrashLoopBackOff with Prometheus
How to detect a CrashLoopBackOff in your cluster?
Most likely, you discovered one or more pods in this state by listing the pods with kubectl get pods:
$ kubectl get pods
NAME                     READY     STATUS             RESTARTS   AGE
flask-7996469c47-d7zl2   1/1       Running            1          77d
flask-7996469c47-tdr2n   1/1       Running            0          77d
nginx-5796d5bc7c-2jdr5   0/1       CrashLoopBackOff   2          1m
nginx-5796d5bc7c-xsl6p   0/1       CrashLoopBackOff   2          1m
From the output, you can see that the last two pods:
- Are not in
READYcondition (0/1). - Their status displays
CrashLoopBackOff. - Column
RESTARTSdisplays one or more restarts.
These three signals are pointing to what we explained: pods are failing, and they are being restarted. Between restarts, there’s a grace period which is represented as CrashLoopBackOff.
You may also be “lucky” enough to find the Pod in the brief time it is in the Running or the Failed state.

Common reasons for a CrashLoopBackOff
It’s important to note that a CrashLoopBackOff is not the actual error that is crashing the pod. Remember that it’s just displaying the loop happening in the STATUS column. You need to find the underlying error affecting the containers.
Some of the errors linked to the actual application are:
- Misconfigurations: Like a typo in a configuration file.
- A resource is not available: Like a PersistentVolume that is not mounted.
- Wrong command line arguments: Either missing, or the incorrect ones.
- Bugs & Exceptions: That can be anything, very specific to your application.
And finally, errors from the network and permissions are:
- You tried to bind an existing port.
- The memory limits are too low, so the container is Out Of Memory killed.
- Errors in the liveness probes are not reporting the Pod as ready.
- Read-only filesystems, or lack of permissions in general.
A similar back-off period is ImagePullBackOff, which is a waiting status when a container image couldn’t be pulled.
Once again, this is just a list of possible causes but there could be many others.
Let’s now see how to dig deeper and find the actual cause.
How to debug, troubleshoot and fix a CrashLoopBackOff state
From the previous section, you understand that there are plenty of reasons why a pod ends up in a CrashLoopBackOff state. Now, how do you know which one is affecting you? Let’s review some tools you can use to debug it, and in which order to use it.
This could be our best course of action:
- Check the pod description.
- Check the pod logs.
- Check the events.
- Check the deployment.
1. Check the pod description – kubectl describe pod
The kubectl describe pod command provides detailed information of a specific Pod and its containers:
$ kubectl describe pod the-pod-name
Name:         the-pod-name
Namespace:    default
Priority:     0
…
State:          Waiting
Reason:       CrashLoopBackOff
Last State:     Terminated
Reason:       Error
…
Warning  BackOff                1m (x5 over 1m)   kubelet, ip-10-0-9-132.us-east-2.compute.internal  Back-off restarting failed container
…
From the describe output, you can extract the following information:
- Current pod
StateisWaiting. - Reason for the Waiting state is “CrashLoopBackOff”.
- Last (or previous) state was “Terminated”.
- Reason for the last termination was “Error”.
That aligns with the loop behavior we’ve been explaining.
By using kubectl describe pod you can check for misconfigurations in:
- The pod definition.
- The container.
- The image pulled for the container.
- Resources allocated for the container.
- Wrong or missing arguments.
- …
…
Warning  BackOff                1m (x5 over 1m)   kubelet, ip-10-0-9-132.us-east-2.compute.internal  Back-off restarting failed container
…
In the final lines, you see a list of the last events associated with this pod, where one of those is "Back-off restarting failed container". This is the event linked to the restart loop. There should be just one line even if multiple restarts have happened.

Webinar: Prometheus Got Out of Hand, Discover What Bloomreach Did Next! Register now
2. Check the logs – kubectl logs
You can view the logs for all the containers of the pod:
kubectl logs mypod --all-containersOr even a container in that pod:
kubectl logs mypod -c mycontainerIn case there’s a wrong value in the affected pod, logs may be displaying useful information.
3. Check the events – kubectl get events
They can be listed with:
kubectl get eventsAlternatively, you can list all of the events of a single Pod by using:
kubectl get events --field-selector involvedObject.name=mypodNote that this information is also present at the bottom of the describe pod output.
4. Check the deployment – kubectl describe deployment
You can get this information with:
kubectl describe deployment mydeploymentIf there’s a Deployment defining the desired Pod state, it might contain a misconfiguration that is causing the CrashLoopBackOff.
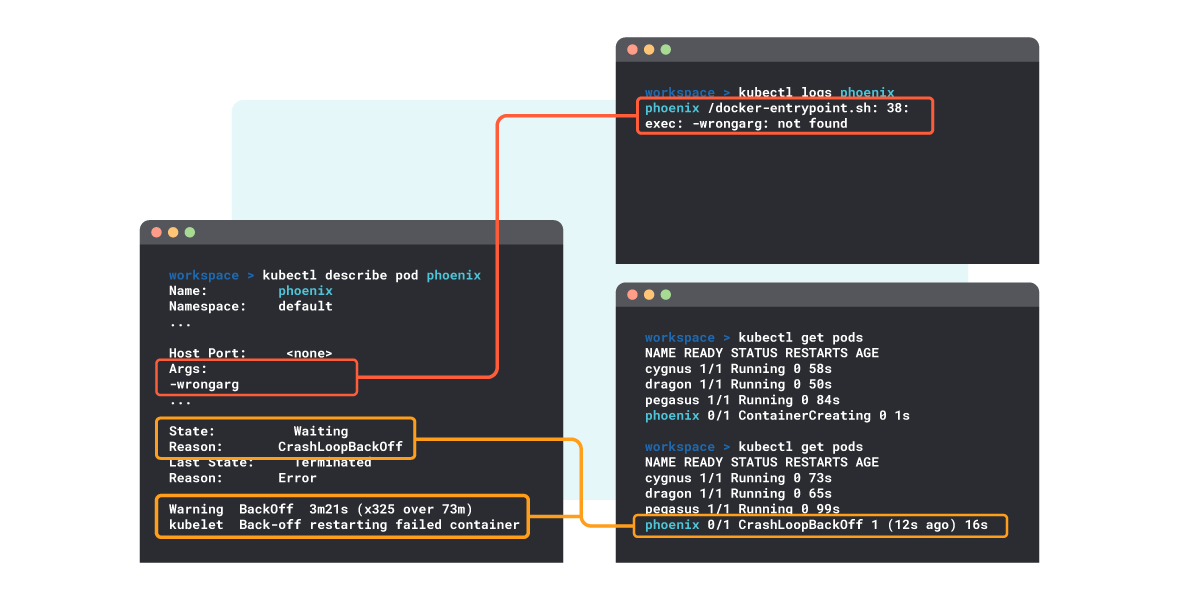
Putting it all together
In the following example you can see how to dig into the logs, where an error in a command argument is found.
How to detect CrashLoopBackOff in Prometheus
If you’re using Prometheus for cloud monitoring, here are some tips that can help you alert when a CrashLoopBackOff takes place.
You can quickly scan the containers in your cluster that are in CrashLoopBackOff status by using the following expression (you will need Kube State Metrics):
kube_pod_container_status_waiting_reason{reason="CrashLoopBackOff"} == 1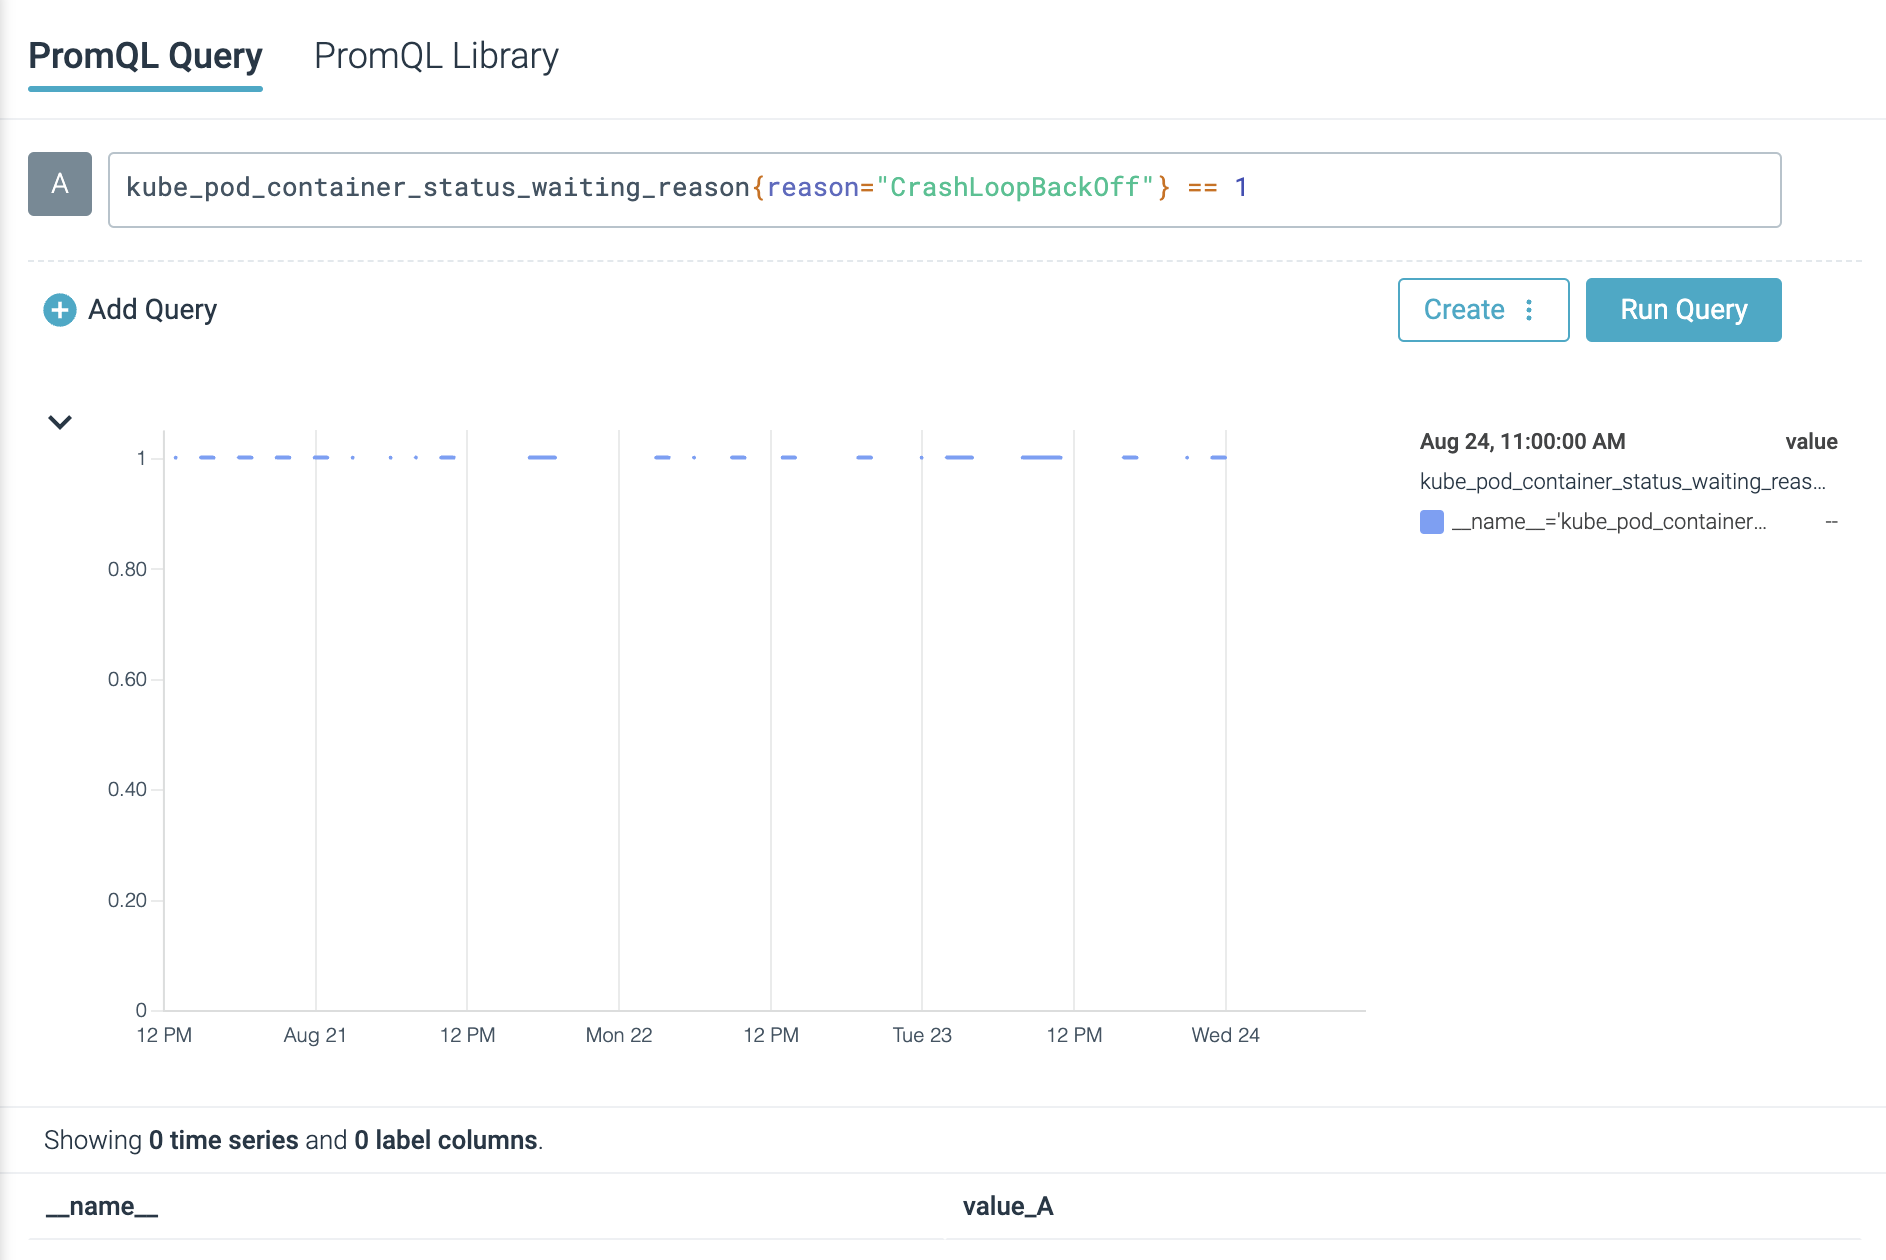
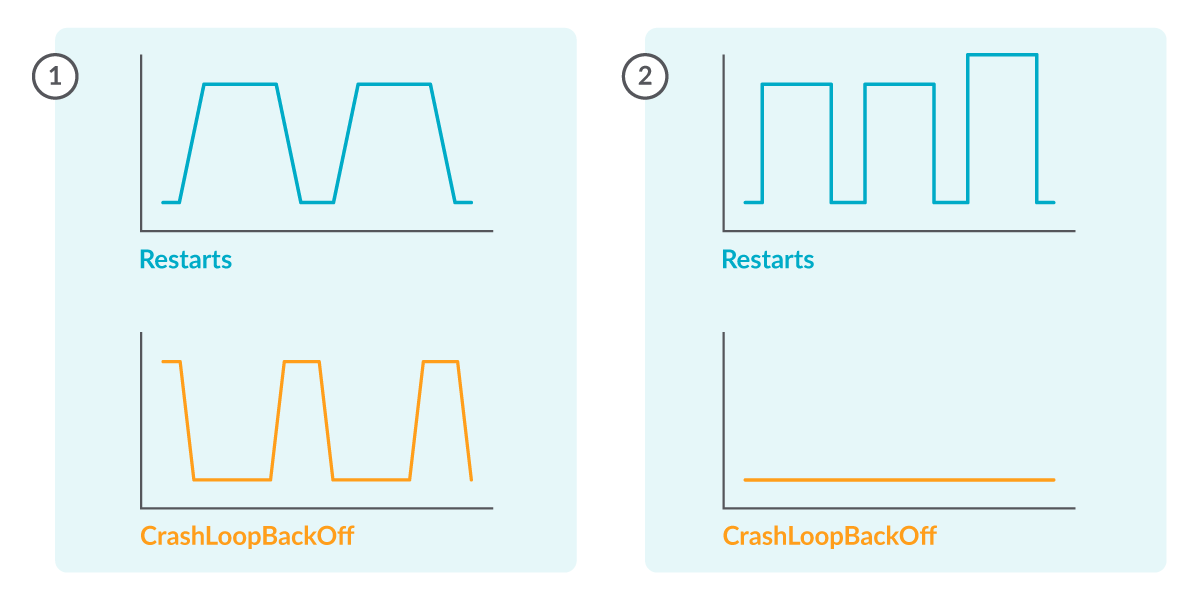
Alternatively, you can trace the amount of restarts happening in pods with:
rate(kube_pod_container_status_restarts_total[5m]) > 0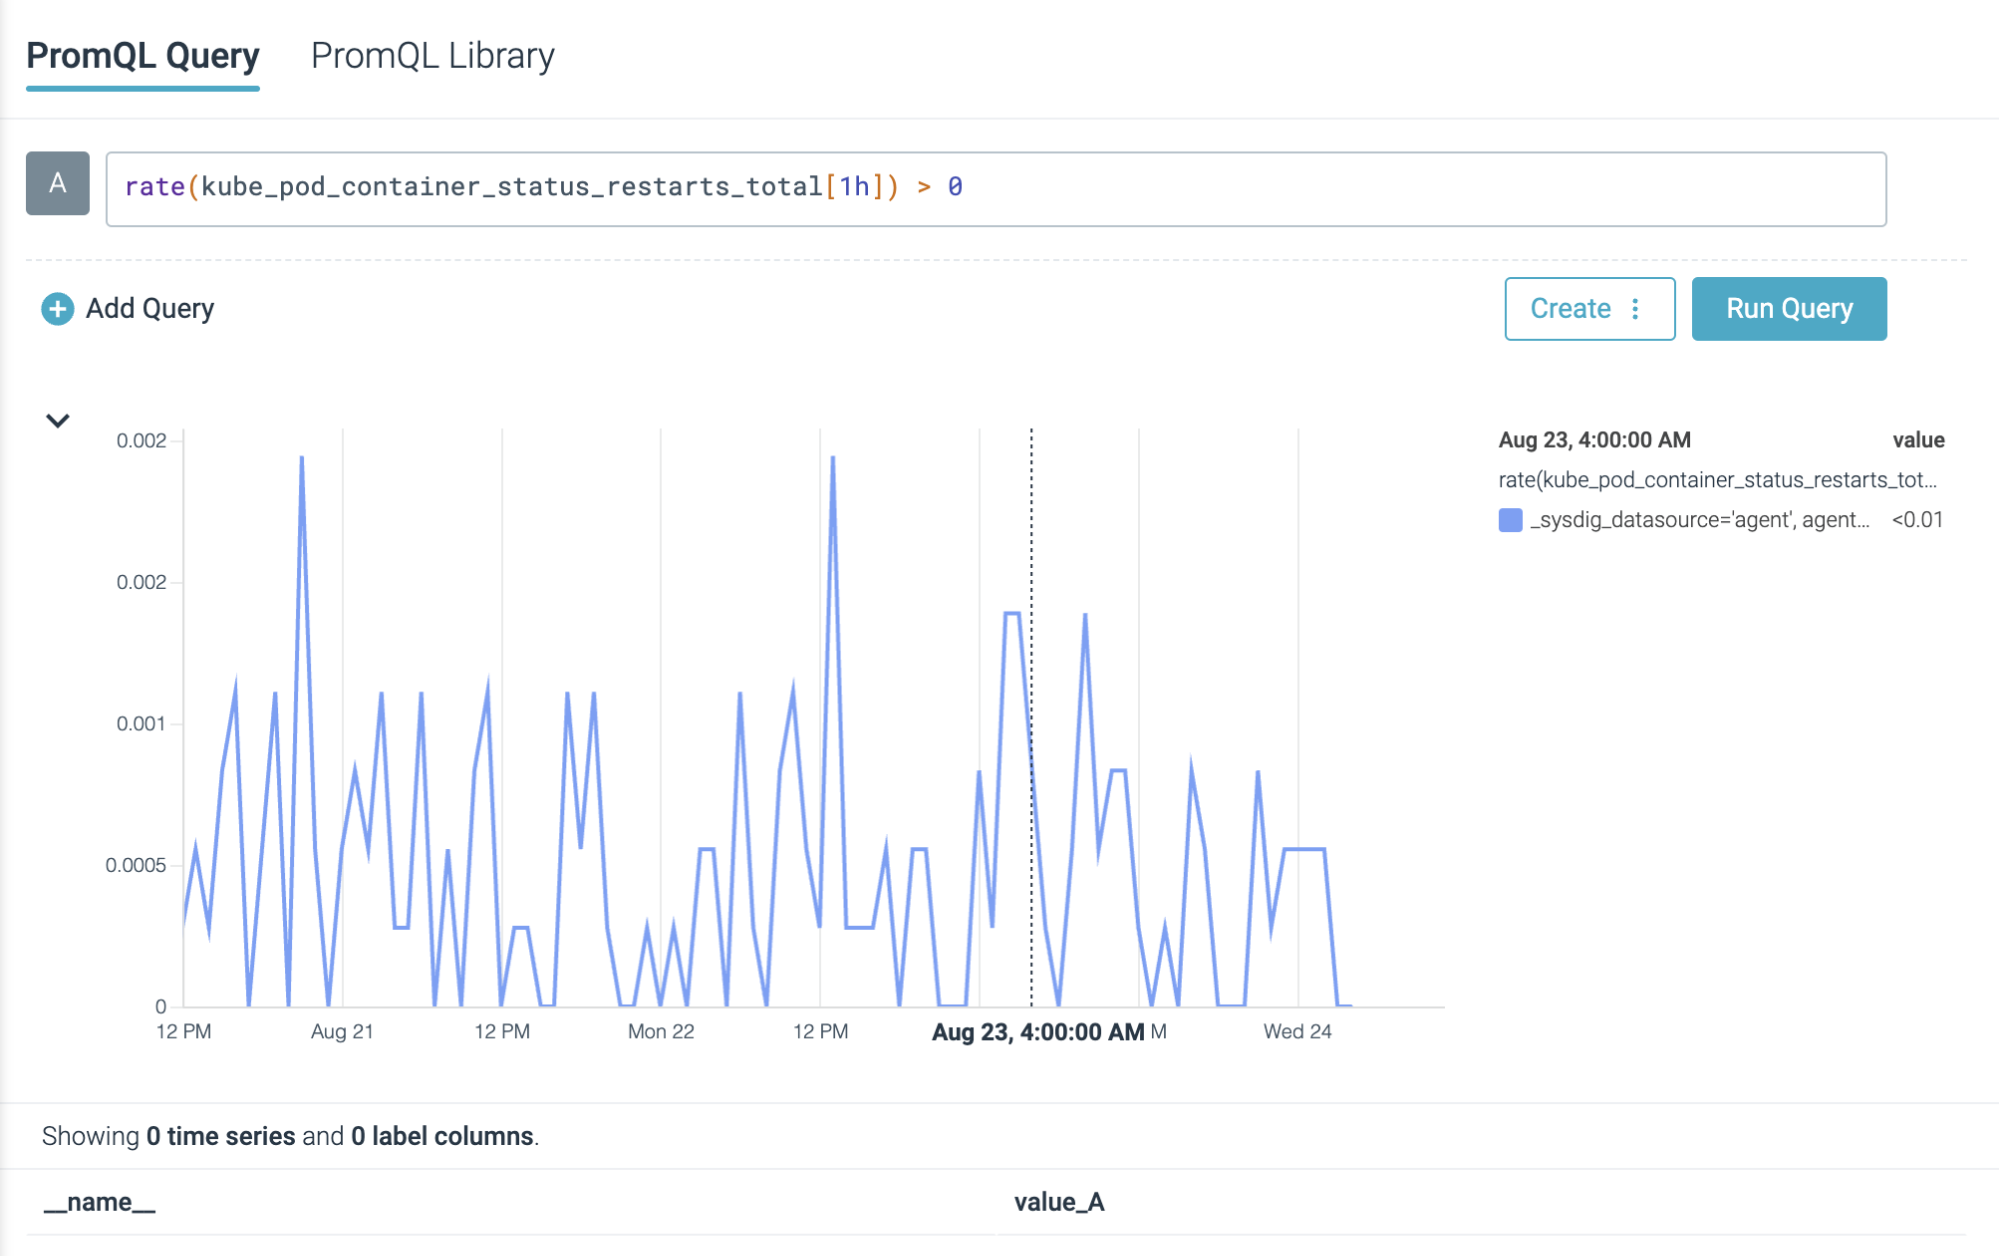
Warning: Not all restarts happening in your cluster are related to CrashLoopBackOff statuses.
Afterwards, you could create a Prometheus Alerting Rule like the following to receive notifications if any of your pods are in this state:
- alert: RestartsAlert
  expr: rate(kube_pod_container_status_restarts_total[5m]) > 0
  for: 10m
  labels:
    severity: warning
  annotations:
    summary: Pod is being restarted
  description: Pod {{ $labels.pod }} in {{ $labels.namespace }} has a container {{ $labels.container }} which is being restarted
Conclusion
In this article, we have seen how CrashLoopBackOff isn’t an error by itself, but just a notification of the retrial loop that is happening in the pod.
We saw a description of the states it passes through, and then how to track it with kubectl commands.
Also, we have seen common misconfigurations that can cause this state and what tools you can use to debug it.
Finally, we reviewed how Prometheus can help us in tracking and alerting CrashLoopBackOff events in our pods.
Although not an intuitive message, CrashLoopBackOff is a useful concept that makes sense and is nothing to be afraid of.
Debug CrashLoopBackOff faster with Sysdig Monitor
Advisor, a new Kubernetes troubleshooting product in Sysdig Monitor, accelerates troubleshooting by up to 10x. Advisor displays a prioritized list of issues and relevant troubleshooting data to surface the biggest problem areas and accelerate time to resolution.
Learn more from our expert discussion on Kubernetes Troubleshooting!