


Falco Feeds extends the power of Falco by giving open source-focused companies access to expert-written rules that are continuously updated as new threats are discovered.

As Kubernetes matures, and more companies move to leveraging containers in production, we're seeing a change in how DevOps teams approach monitoring. As one of our customers recently blogged about, Kubernetes has significantly changed how they bring their service to market. Now we're seeing that type of change ripple into monitoring and troubleshooting Kubernetes-orchestrated environments.
Some of this change is driven by the move to containers, some by the move to microservices, and finally some by the capabilities of Kubernetes. Those changes can be summarized as service,** scale**, and distribution.
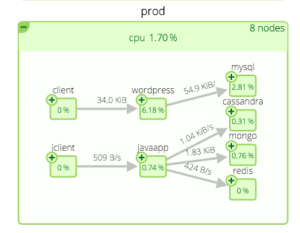
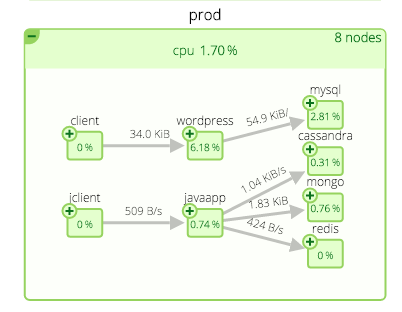
- Service: Kubernetes is a central brain for understanding the logical and physical topology of your applications. Kubernetes takes care of the complex tasks of actually orchestrating the deployment of containers to your infrastructure and wiring those distributed components to appear as unified services. In essence, Kubernetes creates the bridge between the physical resources you utilize and the logical collections of pods, and services that make up the application as you understand it.
- Without having a continually updated view of what Kubernetes is doing, your monitoring system can at best track and alert only on underlying resource issues. In order to understand the state of your services and pods, your monitoring system needs to be able to (1) dynamically ingest relevant information from the Kubernetes API, (2) logically group containers into the collections that map to your logical application and (3) continually calculate aggregate application, service and infrastructure metrics that allow you to monitor your service as a whole.
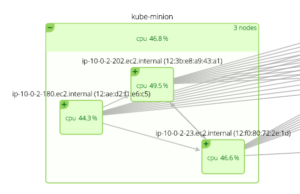
* Scale:With 1.2, Kubernetes scales up to 1,000+ node clusters. Moreover, this system is incredibly dynamic – replication controllers can spin up additional containers as needed – even just for a few seconds. As it kills off containers, they may not be the one that was initially spun up as temporary.
As a result, legacy alerting approaches need to change. Alerts need to be adaptive in two ways. First - just like we described in the **service** section - alerts need to dynamically aggregate metrics from all relevant sources regardless of how long those resources are around, and measure overall service and pod performance. Second, resource-level alerts like CPU, memory, or network utilization need to be applied to individual containers or applications as they come and go. For the sake of operational sanity, those alerts need to be set automatically as Kubernetes spins up the container. Alerts could also be applied on pod, service, or any additional labels that matter to your applications.
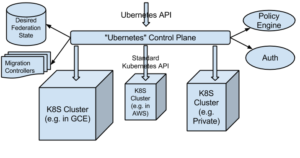
- Distribution:Kubernetes Cluster Federation (aka Ubernetes) makes it much easier to distribute an application over multiple data centers and multiple cloud providers. This is incredibly powerful for improving distributed application performance, avoiding cloud lock-in, and even controlling cost.
- The flip side? Yep, monitoring approaches will need to change for some teams. In particular, those who were used to simply leveraging monitoring provided by their cloud will need to use a system that can monitor, alert, and troubleshoot across clouds. It's essential that the system can collect the same metrics consistently across clouds to properly aggregate information.
Monitoring, Kubernetes, and your environment
Service, scale, and distribution are three changes that will impact your environment with Kubernetes 1.2, but will also impact you well into the future. The shift to container-driven, microservice-oriented, hybrid cloud deployments (whew, that's a lot of jargon!) is where many software operations are headed. In order for the shift to be successful, organizations need to also rethink how they gain visibility into these new environments. Containers add a challenge here because they are black boxes; Microservices add a challenge because they reorient how to think about your application; Orchestration tools help scale up your infrastructure, and have some of the key metadata you need to actually make monitoring work in this brave new world.
Oh, by the way, today Sysdig officially supports Kubernetes 1.2 out-of-the-box. To make it really simple, we leverage DeamonSets to ensure that every host that you spin up with Kubernetes is automatically instrumented via Sysdig Cloud. Click here to read more great blogs about monitoring Kubernetes, or just give Sysdig cloud a spin with your own environment.