Falco Feeds extends the power of Falco by giving open source-focused companies access to expert-written rules that are continuously updated as new threats are discovered.

Today, we are excited to announce support for Amazon CloudWatch Metric Streams. This support will enable our customers to ingest metrics from AWS CloudWatch in real time, increase metric and state fidelity and time to ingestion while decreasing MTTR, and support cloud metrics at scale without the need to customize or re-configure new AWS service metrics.
In this blog, we dig deep into:
- New support for ingesting real-time metrics for your AWS services via Amazon CloudWatch Metric Streams
- The value of event-based metric ingestion via a push vs. pull model.
- Using real-time metrics to improve MTTR.
For the past few years, Sysdig Monitor has supported ingesting metrics and metadata from AWS services via pulling from Amazon CloudWatch. This provides a flexible model for Sysdig Monitor customers to have granular control over what and how AWS CloudWatch metrics are ingested, but it does keep the frequency of that ingestion at arms length – any pull-based model will depend on how frequently metrics are ingested and made available to the monitoring system. When dealing with more critical systems, or systems where alerting needs to be as close to real-time as possible, a different model is required: A push model where the underlying metrics acquisition engine can notify the monitoring system based on the frequency required by the systems being monitored. Enter Amazon CloudWatch Metric Streams.
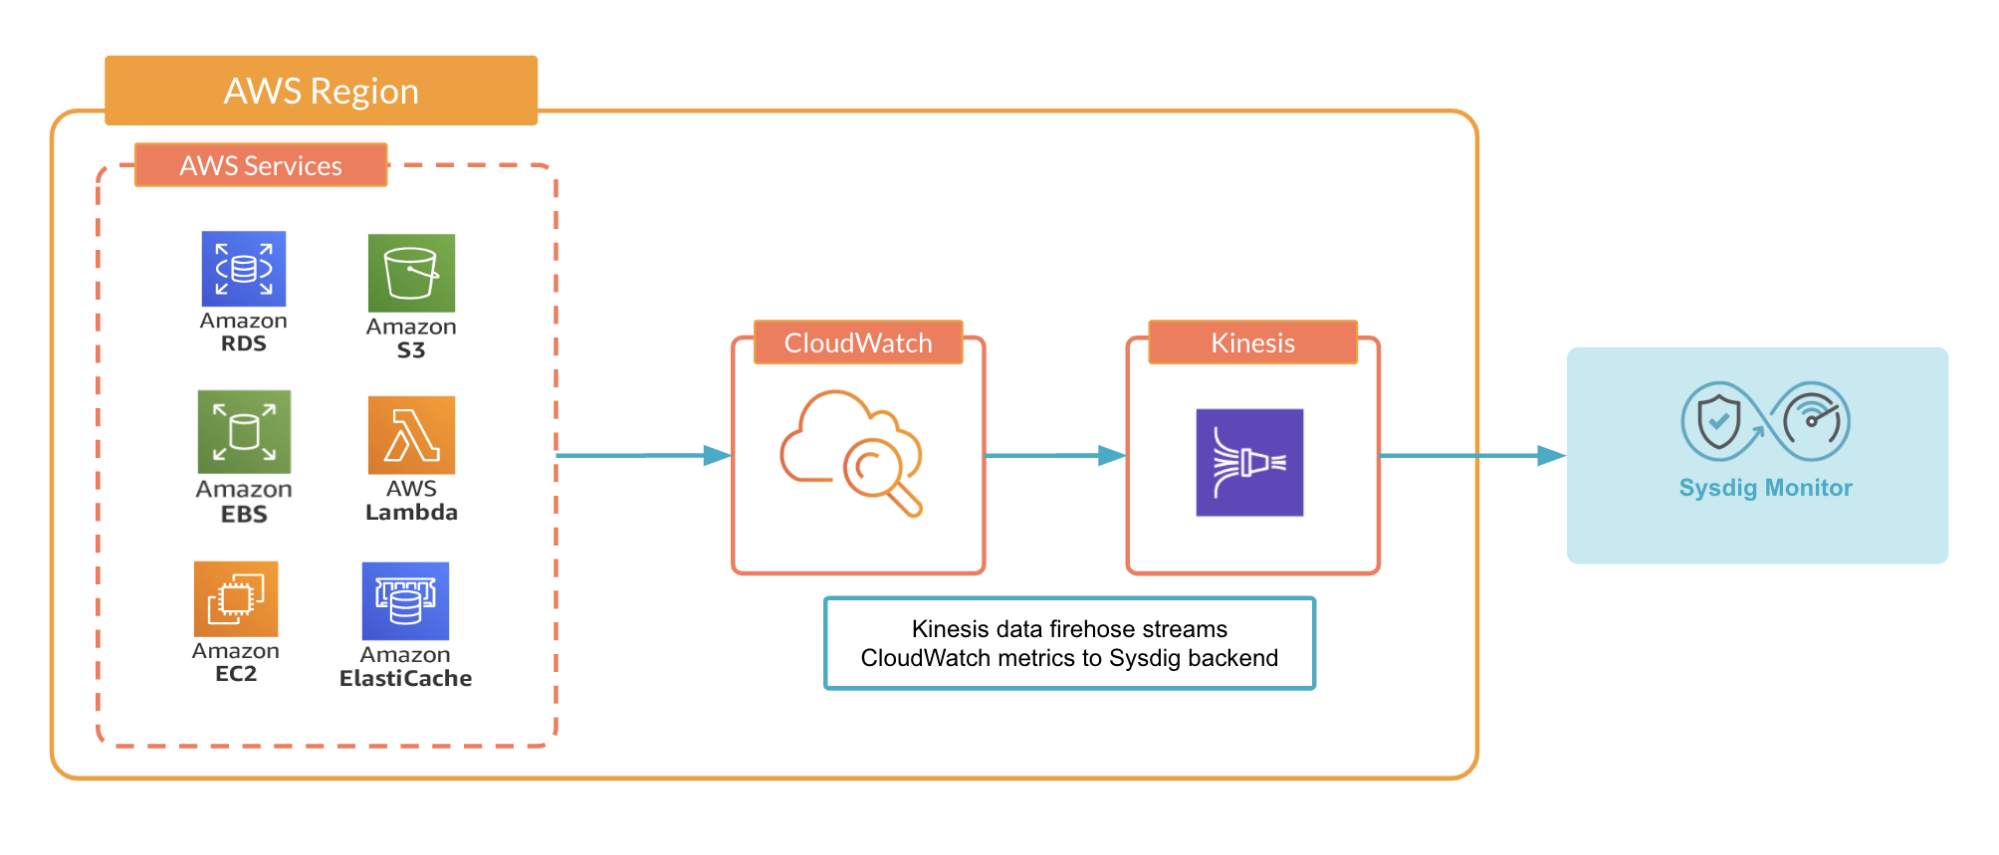
Launched in 2021, Amazon CloudWatch Metric Streams is a feature of Amazon CloudWatch which allows customers to send near real-time, continuous metrics from over 70 AWS services to external monitoring platforms such as Sysdig Monitor. This allows AWS administrators and operators to aggregate those near real-time metrics into systems used for monitoring other parts of the infrastructure, such as Kubernetes environments, and tie those metrics together to create a holistic view of application health and performance. Sysdig Monitor with Amazon CloudWatch Metric Streams sourced metrics and metadata enables you to continuously ingest application and infrastructure metrics, along with service and infrastructure metadata, providing insight into AWS cloud usage, performance, and overall system health of your applications and services.
The value of near real-time
The ultimate goal of any monitoring and alerting platform is to provide administrators and operators with immediate access to real-time system status:
- How is my infrastructure currently handling load?
- How are my applications performing?
- When do I need to deploy a scale event or, even better, be notified when an autonomous scale event is deployed to handle a change in performance and load?
All of these questions, and the systems that provide resolution, point to a very important metric: How to minimize MTTR (Mean Time to Resolution) for any event. An event can be a failed system, an application that's slowing to respond under load, or even a drastic increase in cloud consumption costs due to any issue that's managed by the cloud platform. The more we can reduce MTTR for any event the more we can reduce costs, system churn, and ultimately customer unhappiness.
Traditional pull-based metrics ingestion can help with MTTR but there will always be an inherent latency in that system. First, a service will need to generate a metric, then another service will need to query the source service for the latest metric state. Then, that receiving service will need to process, analyze, and act on any event that's detected as part of that metric set. While we can minimize that latency by removing as many pieces in the communication chain as possible, we'll always be limited to the immediacy of data, which will be dependent on the cadence at which our receiving system allows us to poll for that metric state change.
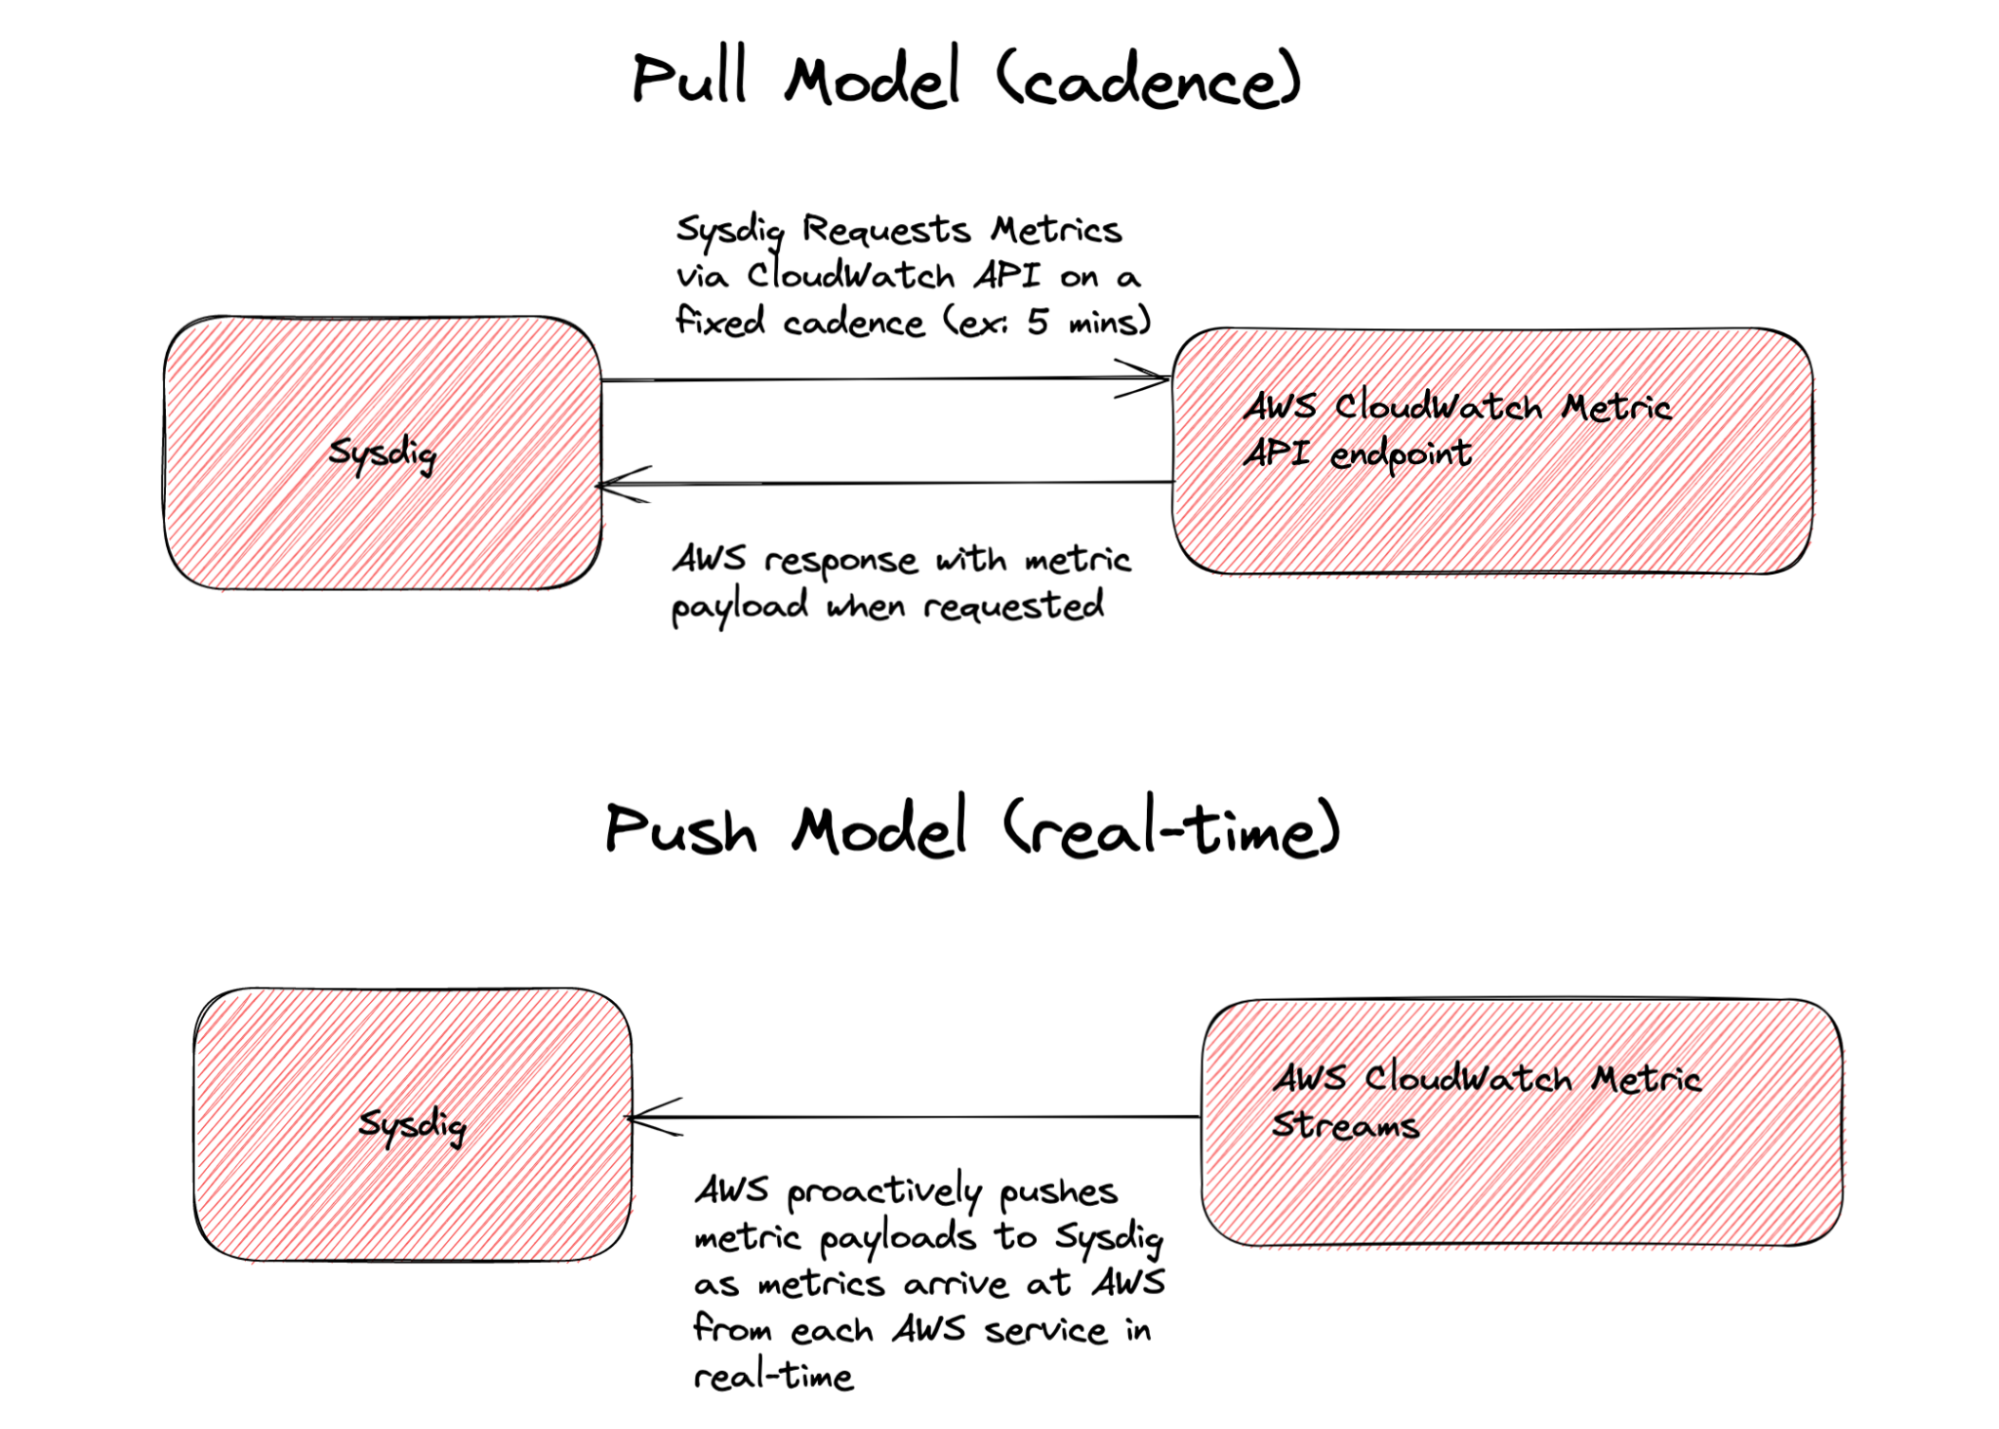
In contrast, a streaming, or push, model allows the metric source to dictate the frequency at which it sends us metrics and state changes, which can vary based on the critical nature of the source service. Amazon CloudWatch Metric Streams turns the control over metric delivery and cadence to the source AWS service so the services can decide how frequently to deliver critical metrics, which metrics are the most important to deliver at any given time, and which services are considered more critical than others. AWS ECS, for example, publishes metrics every minute by default whereas AWS EC2 sends metrics every five minutes by default. Using Amazon CloudWatch Metric Streams, the monitoring endpoint – Sysdig Monitor, in this case – will receive metrics for each as they arrive into CloudWatch, every minute and every five minutes, respectively.
Configuring Amazon CloudWatch Metric Streams in Sysdig Monitor using CloudFormation templates
Configuring Amazon CloudWatch Metric Streams is done in two phases:
- Configuring a new Amazon CloudWatch Stream, done in your AWS account
- Integration of your AWS account with Sysdig Monitor for real-time status monitoring and consumption of additional AWS resource information
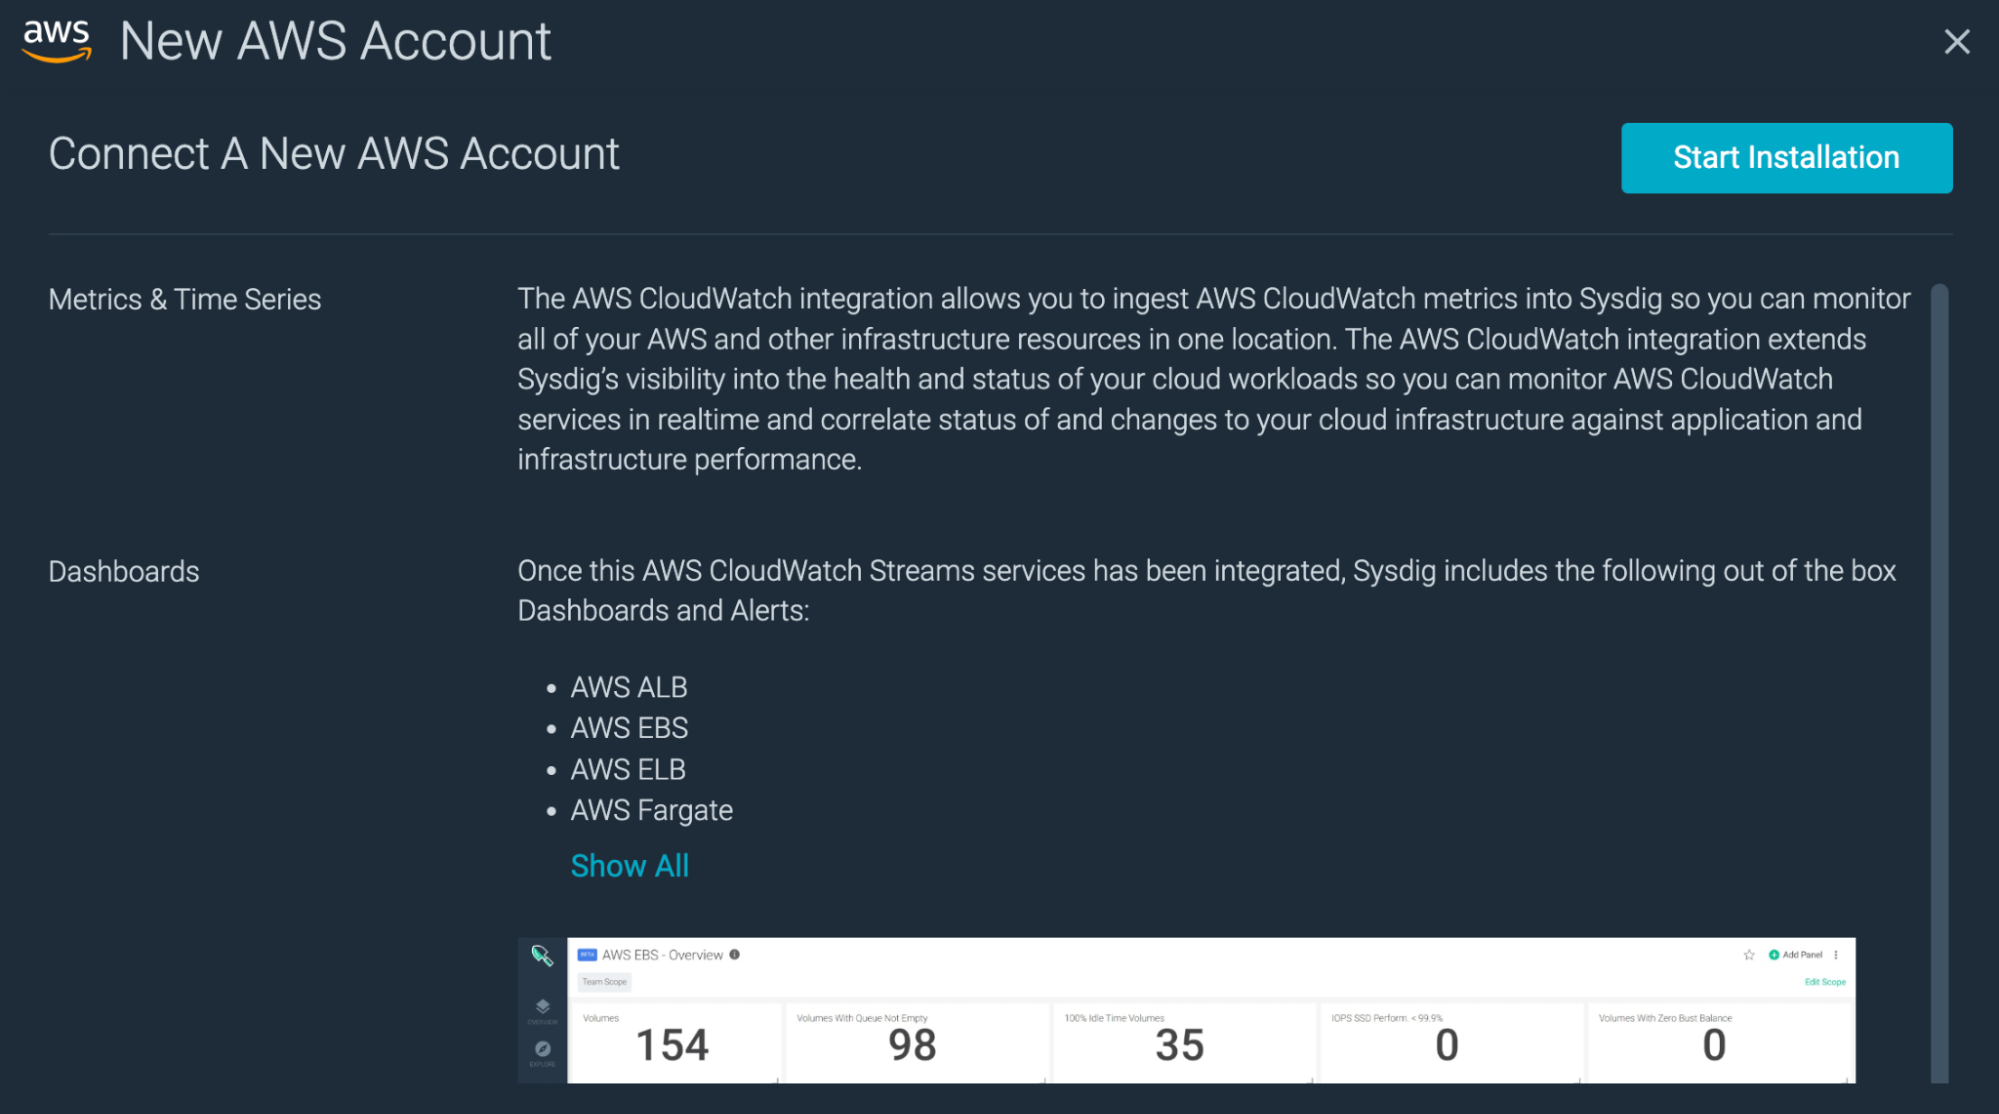
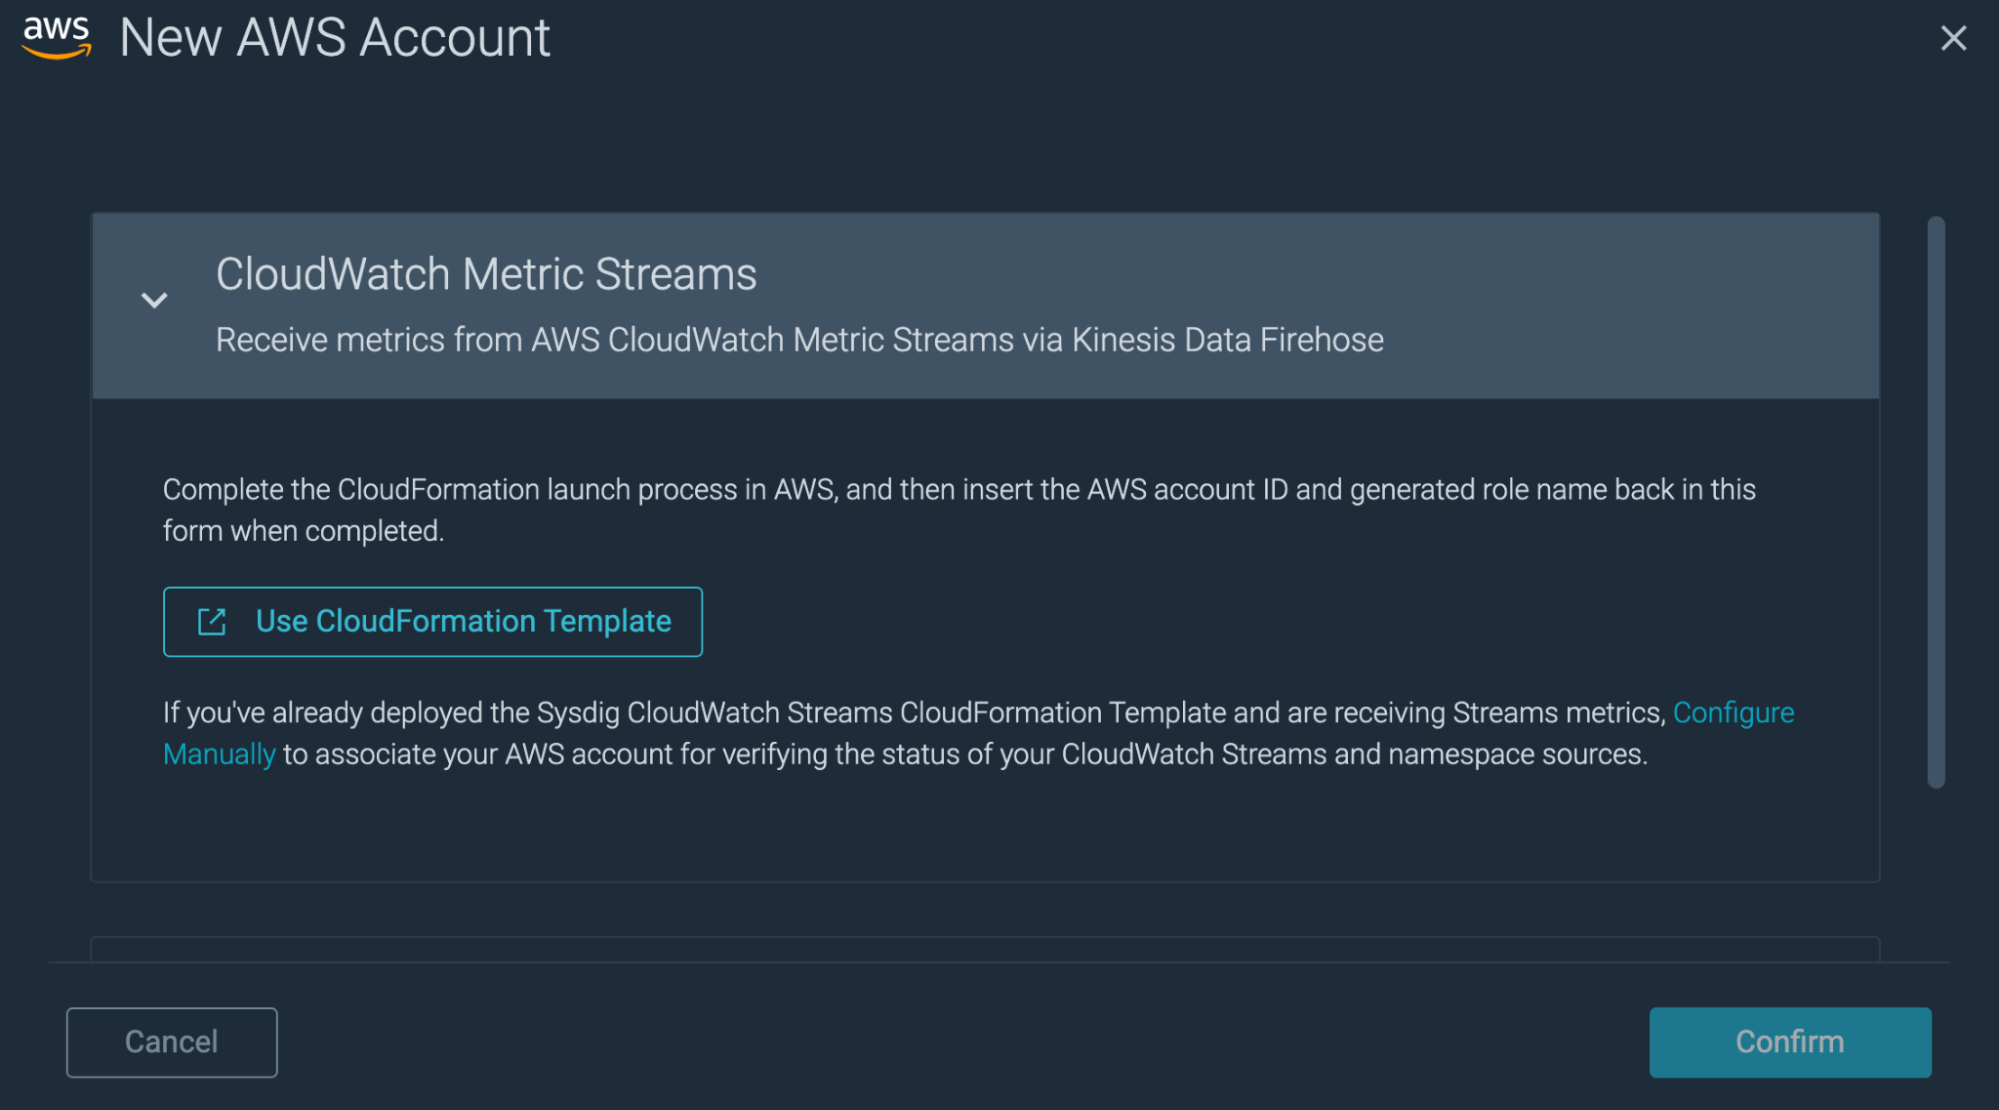
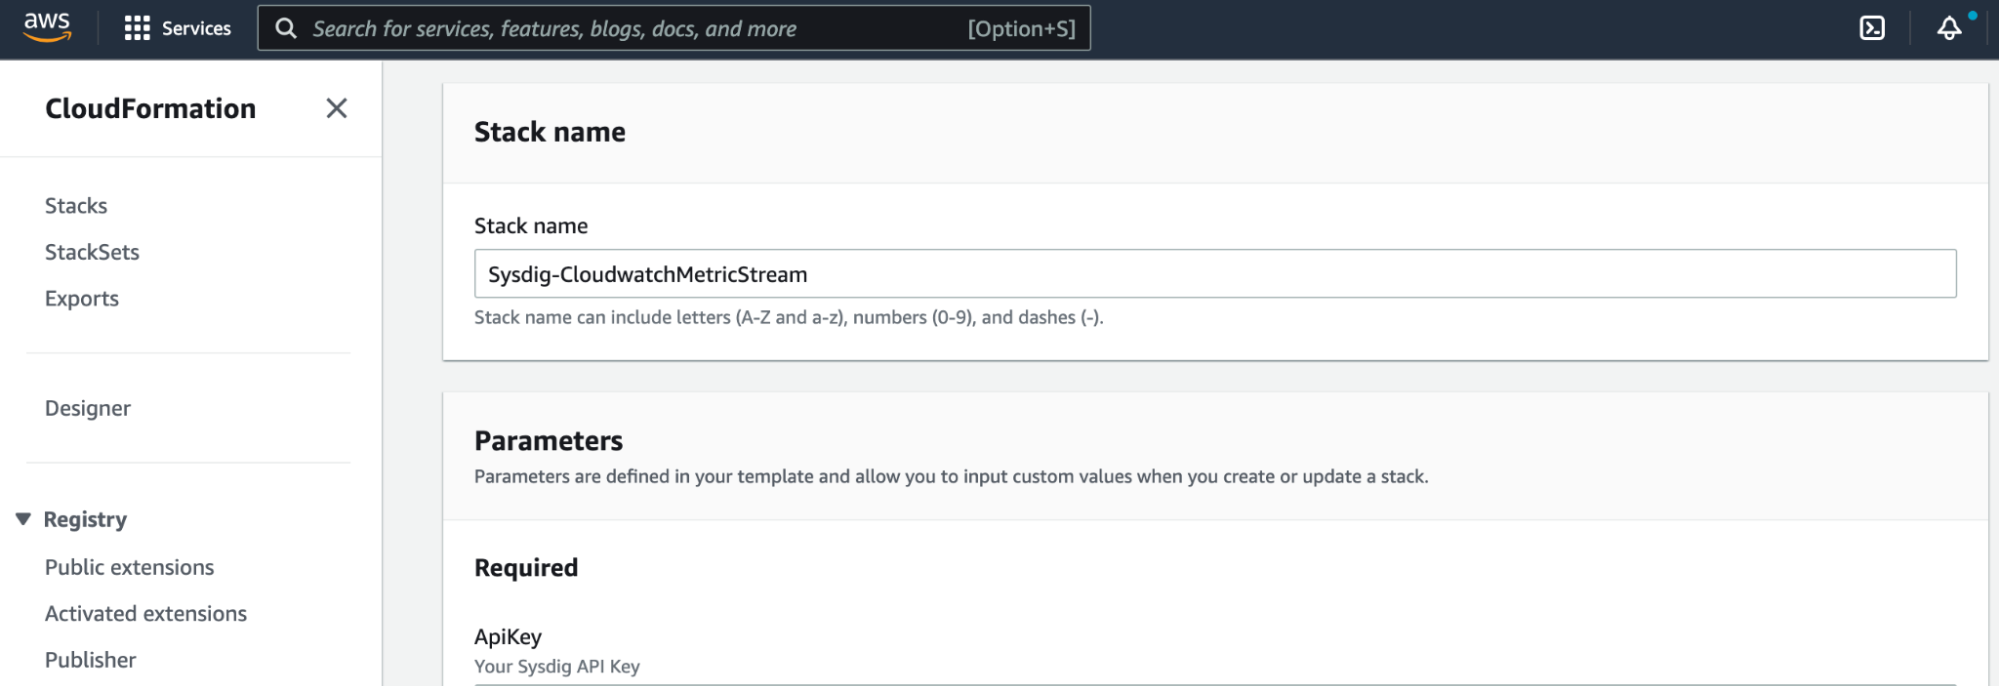
Creating a new Stream can be done via a CloudFormation Template which is linked from the Sysdig UI. To get started, click on the "Start Installation" button and select CloudWatch Metric Streams -> Use CloudFormation Template. That will open a new window or tab which points to the pre-configured CloudFormation Template used to configure a new Stream and point that Stream at the Sysdig HTTPS receiver.
Amazon CloudFormation template for creating a new Stream stack.
For more information on AWS account integration with Sysdig and configuring Amazon CloudWatch Metric Streams, please refer to the official documentation.
Using Sysdig Monitor out-of-the-box dashboards and alerts for Amazon CloudWatch Metric Streams
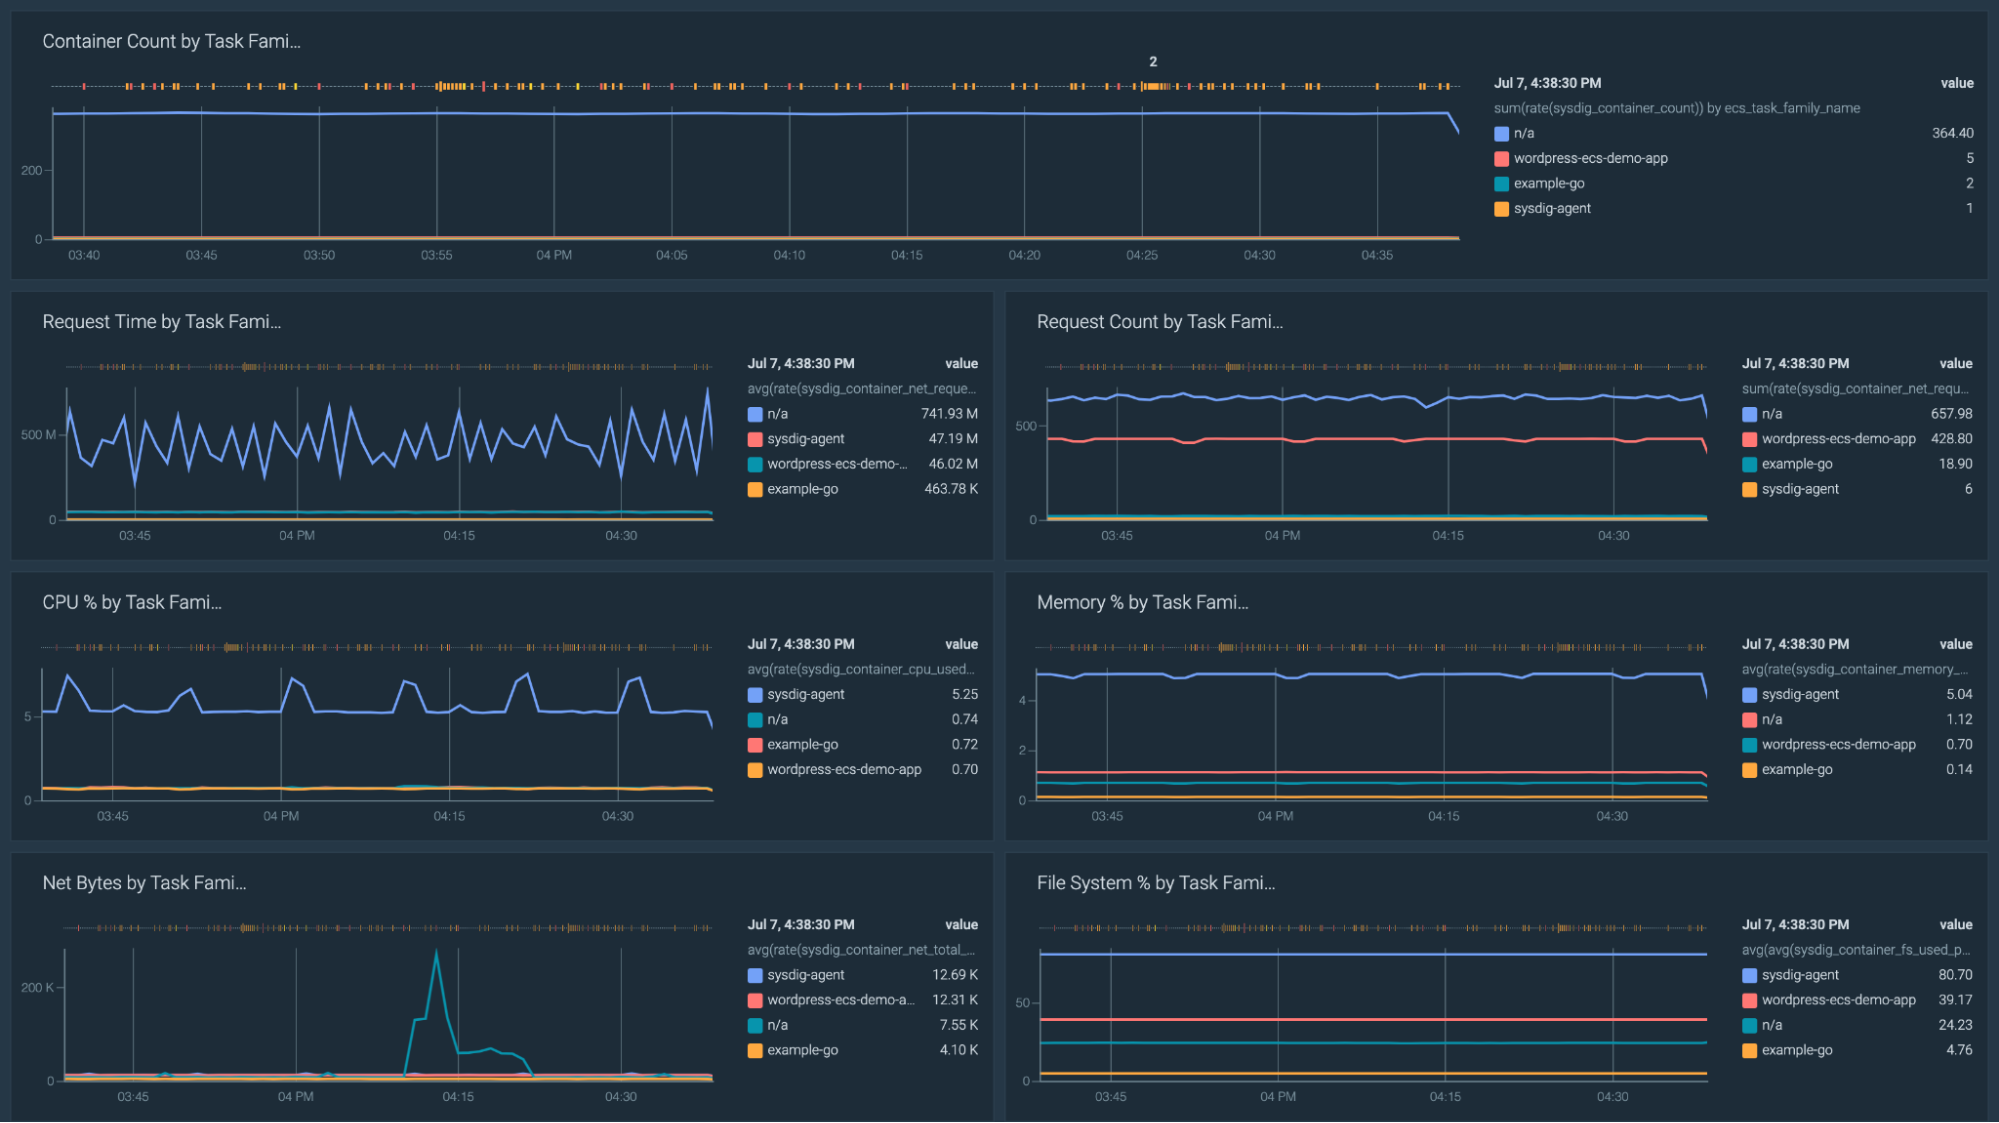
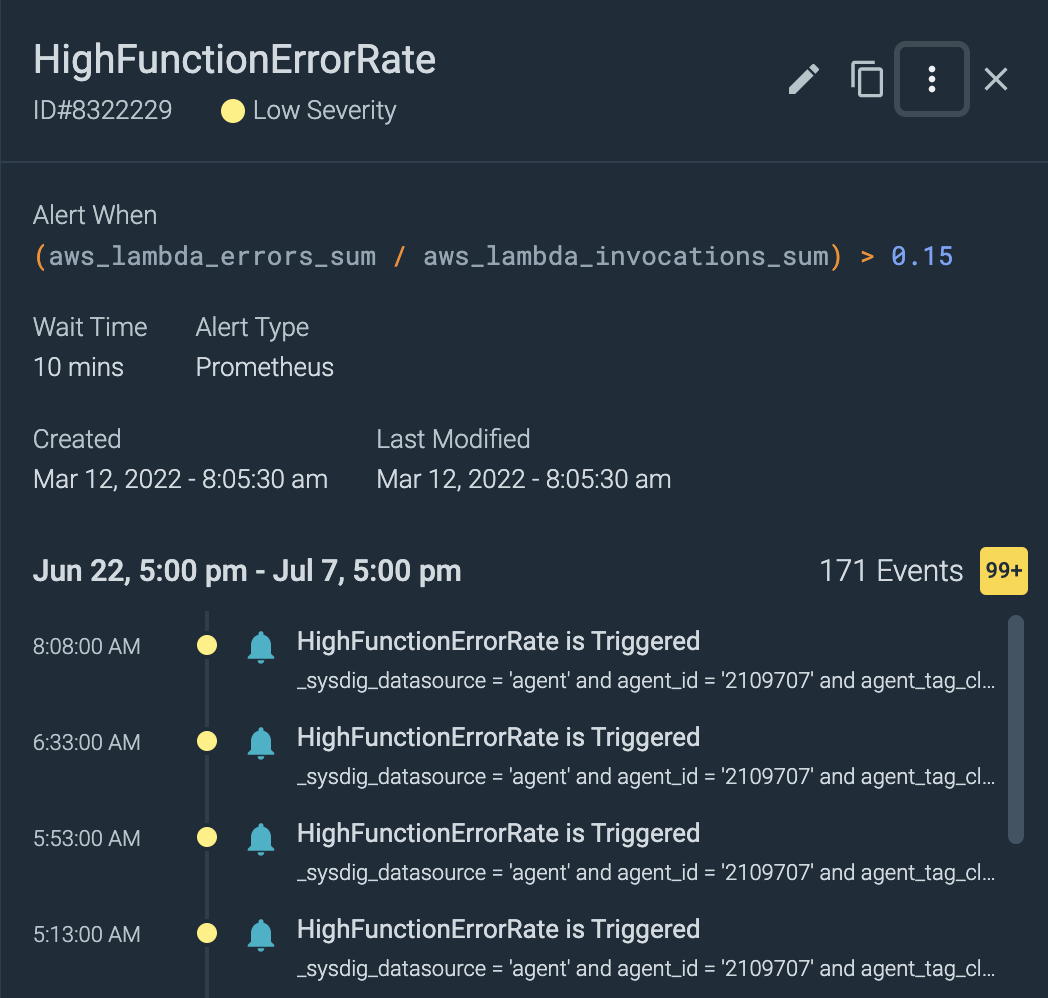
Once you have configured Amazon CloudWatch Metric Streams in Sysdig Monitor, our pre-built dashboards and alerts will be automatically available for you to start using right away. You can use them as-is or customize them to your heart's content.
Conclusion
As a powerful companion to traditional Amazon CloudWatch metrics, Amazon CloudWatch Metric Streams offers Sysdig Monitor users the ability to ingest and consume near real-time metrics from many AWS cloud platform and application services. With ingestion support for 70+ AWS services (at launch time), along with a set of curated out-of-the-box, per-service dashboards and alerts, Sysdig Monitor allows you to deploy a turn-key platform for all of your infrastructure and application metrics, regardless of location, environment, or cloud provider. Together, these metrics can be used to create a single pane of glass monitoring tool for your entire infrastructure, and with Amazon CloudWatch Metric Streams as the source for one major component of that system you'll be able to increase visibility while reducing MTTR across your entire organization.
You can try it for free right now by signing up for a 30 day trial and choosing an AWS region during the sign-up process.


