


Falco Feeds extends the power of Falco by giving open source-focused companies access to expert-written rules that are continuously updated as new threats are discovered.

A little secret: Container Monitoring loves numbers
\r\r
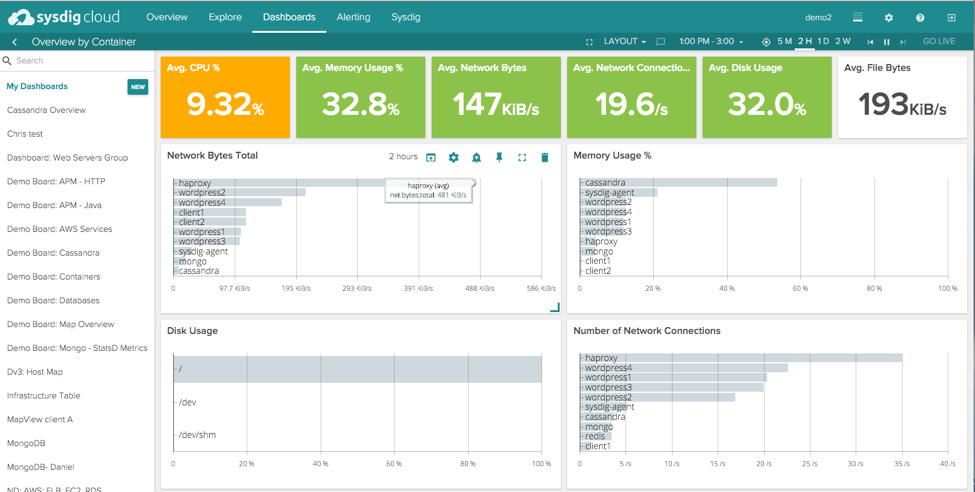
…and we love them even more now that we've introduced number panels for Sysdig Cloud dashboards and views. Rather than describe them, let's just take a look as they monitor a container environment:
\r\r
\r\r
As Sysdig Cloud has grown in importance to our customers, we find that we're not only being used as a troubleshooting tool, not only as an alerting tool, and not only as a dashboarding tool… but we're also being used as the "source of truth" running as a wallboard in the office or the NOC where people can quickly glance and get a picture of what's going on. The number panel works alongside our time series, bar, and table panels to make this all come together.
\r\r
How to create a number panel
\r\r
It's pretty simple:
\r\r
- \r
- Mouse over a panel \r
- Click the "Settings" gear within that panel \r
- Pull down on "Show As" \r
- Choose "Number" \r
\r\r
\r\r
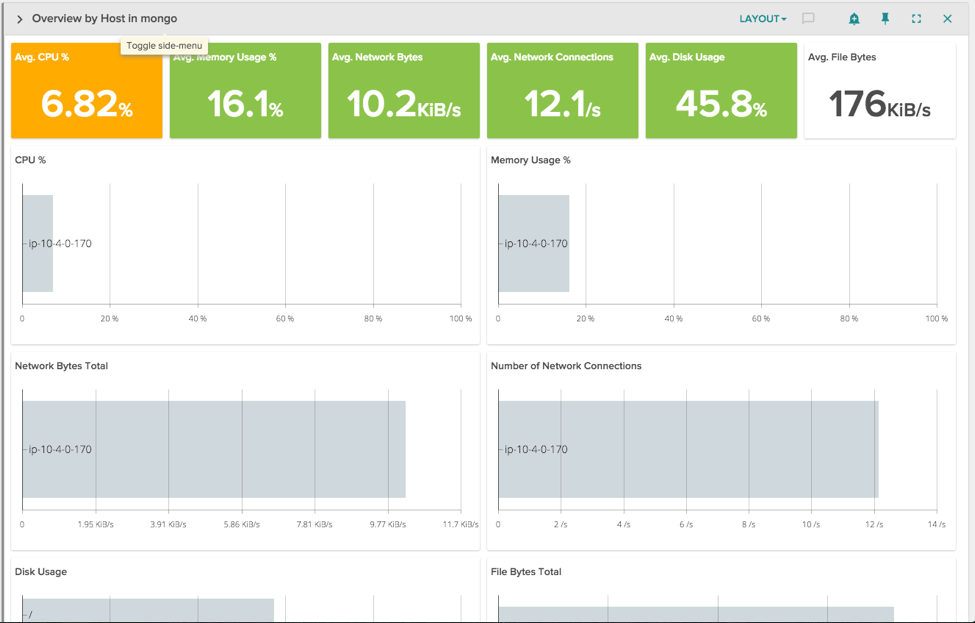
…and you're done! No PhD in statistics required. Just as an FYI, the number panel is aggregating data over whatever timeframe you've set in the dashboard or view. In the screenshot above, it's a 2-hour window, and in the example below, it's operating in real-time.
\r\r
As a bonus, you can set red-yellow-green color coding based on thresholds. That makes it especially easy to monitor behavior at-a-glance when you're jogging by the wallboard on the way to your next meeting.
\r\r
Works flawlessly with groupings
\r\r
One of the most powerful features of Sysdig Cloud are our groupings. We can group data via applications, services, data centers, or any other logical set of containers or hosts. Number panels work great with groupings so that you can easily monitor higher level questions like "How is X service performing right now?"
\r\r
\r\r
Try the Number Panel We've already made it GA – so go ahead!
\r\r
If you're not yet a Sysdig Cloud user, log in now for a free trial, and change the way your team looks at data for the better!