


Falco Feeds extends the power of Falco by giving open source-focused companies access to expert-written rules that are continuously updated as new threats are discovered.

This is the second episode of the CSI Container series, published and presented at CloudNativeSecurityCon 2024. In this episode, we focus on Kubernetes CSI, how to conduct DFIR activities on K8s and containers, and how to perform static and dynamic analysis.
CloudNativeSecurityCon 2024 – CSI Forensics
As we covered in the first episode, DFIR refers to the union of Digital Forensics (DF) and Incident Response (IR). We also highlighted how conducting DFIR activities in a container environment differs from the usual DFIR in a host environment. Due to the peculiarities of containers, specific tools are required to operate effectively.
In this article, we will revisit the Kubernetes feature known as k8s checkpoint, which we have discussed previously. We will demonstrate how it can be automated using Falco components, enabling us to create container snapshots that are invaluable for Digital Forensics and Incident Response (DFIR) analysis.
Automating K8s checkpoint
As we covered in a separate blog, the Container Checkpointing feature allows the checkpoint of a running container. This means you can save the current container state to potentially resume it later without losing any information about the running processes or the stored data.
Even though the feature is still in the early stages of development and has different limitations, it's very interesting for our DFIR use case. What if we can use this feature to snapshot a container state and restore it to a sandbox environment to proceed with our forensics analysis?
The first problem we need to face is that containers are ephemeral. To be able to snapshot a container, it needs to exist. In addition, we want to snapshot the container as soon as possible during the attack, so we can monitor it more when we restore it. Therefore, the following Kubernetes response engine fits our use case perfectly.
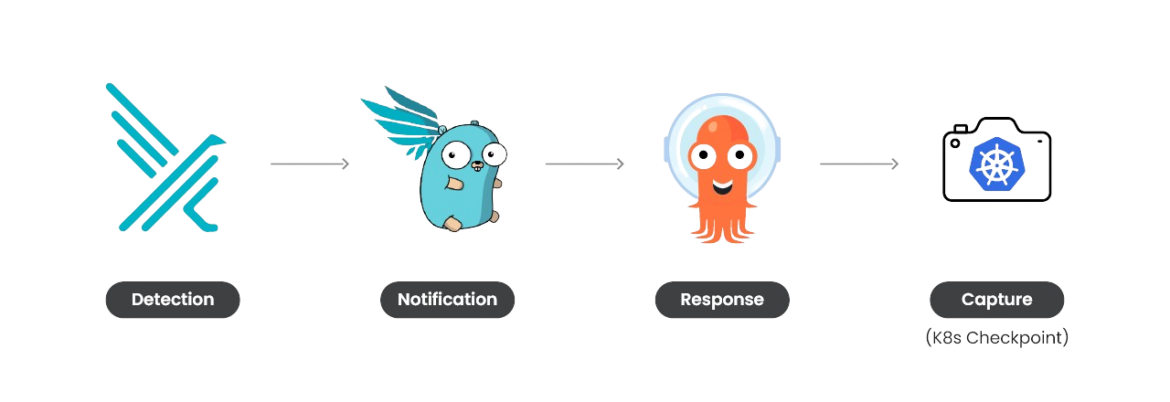
Using Falco, Falcosidekick, and Argo, we can set up a response engine capable of taking action. In this case, its main goal is to perform a K8s checkpoint as soon as a specific highly malicious Falco rule is triggered. The checkpoint can then be used for further analysis.
Real-world scenario
To understand its behavior, let's examine the automation in action in a real-world scenario.
In this scenario, on the offensive side, we'll play with a well-known chatbot, particularly an IRC chatbot that, once downloaded and executed in the impacted container, will connect to a known C2 server. If you want to know more, Github hosts a lot of Perl-bot samples. Even though these can look like outdated techniques, in recent years, many campaigns have been harvesting different containerized services.
On the defensive side, instead of detecting malicious activity, we'll focus on identifying malicious connections to well-known IPs using the following Falco rule:
# List of IPs provided by a threat intelligence feed

   - list: malicious_ips

     items: [‘“ip1”’, ‘“ip2”’, …]

   - rule: Detect Outbound Connection to Malicious IP

     desc: This rule detects outbound connections to known malicious IPs according to threat intelligence feeds. Interactions with such machines may compromise or damage your systems.

     condition: >

       (evt.type in (connect) and evt.dir=<

         and fd.net != "127.0.0.0/8" )

         and container

         and fd.sip in (malicious_ips)

     output: An outbound connection to %fd.sip on port %fd.sport was initiated by %proc.name and user %user.loginname and was flagged as malicious on %container.name due to Threat Intelligence feeds

     tags: [host, container, crypto, network]
By downloading and executing the malicious Perl-bot script, we can see how the Kubernetes response engine is triggered and how the checkpoint of the compromised container is correctly performed.
By default, the checkpoint tar file is saved into the Kubernetes node's filesystem that hosts the impacted container. Still, in a more realistic scenario, we should consider moving the checkpoint archive to a safer location, such as a cloud bucket or external storage. Remember that if a container has been compromised, the attacker might have moved laterally on the host, so leaving the file in the host filesystem might not be the smartest choice.
DFIR analysis
Now that the container checkpoint is ready, we can use its files to investigate and understand what happened during the attack and the attacker's goals.
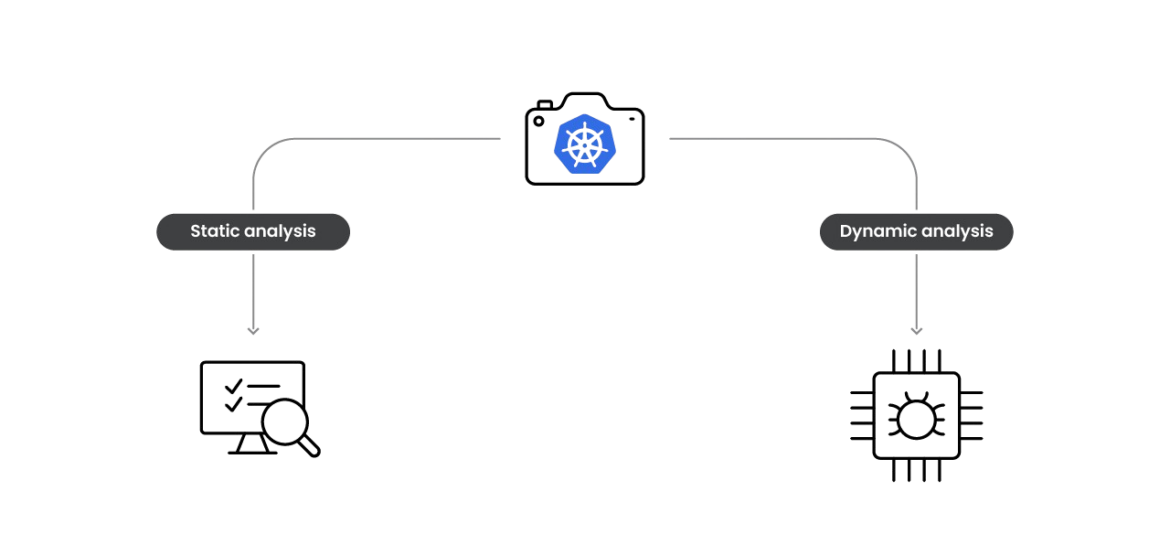
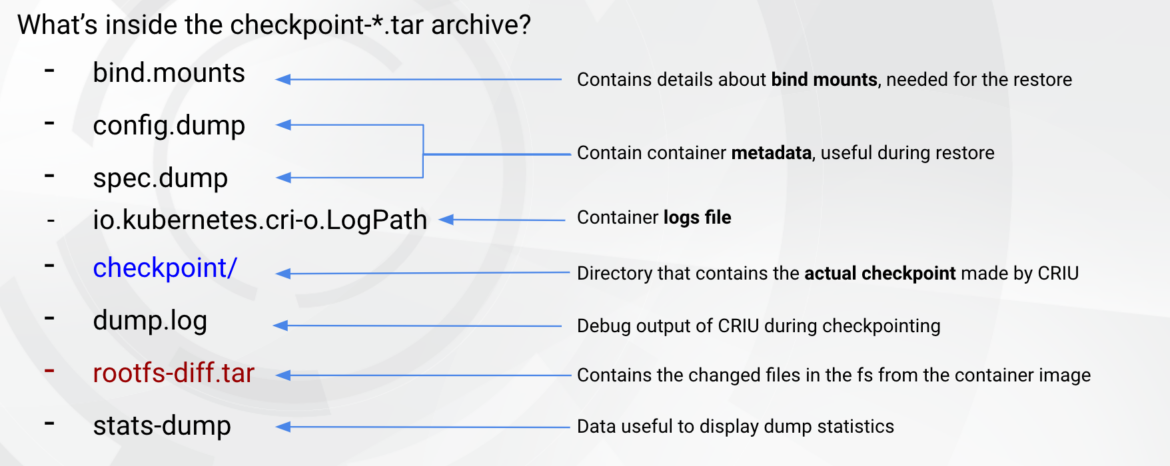
We can feed our static and dynamic analysis using the container checkpoint archive. The following files are in the container checkpoint tar file.
For static analysis, the changed files in the container filesystem would be very helpful, especially by using the binaries or scripts dropped by the attackers. For dynamic analysis, restoring the container and analyzing the execution with proper tools would be very effective in understanding the intended behavior.
Let's start the analysis using the real-world scenario reported above and move on with the investigation using the previously obtained checkpoint.
Real-world scenario: Static analysis
The first thing we can do for static analysis is to check if the attacker leaves binaries or scripts in the filesystem. Since the checkpoint was done a few seconds after the attacker ran the binary, this is very likely.
As we have seen in the screenshot above, the container checkpoint includes the rootfs-diff.tar archive, which contains the files that were modified in the previously checkpointed container compared to the base image:
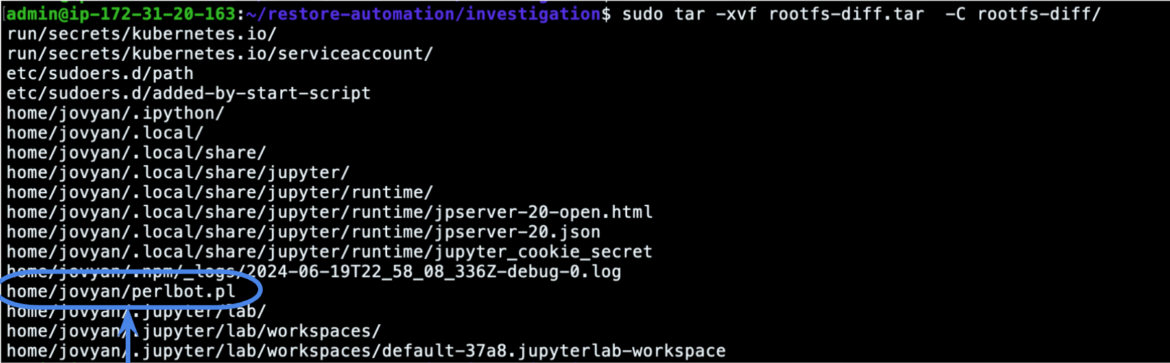
The file perlbot.pl looks interesting, and we can keep the file for further static analyses and reverse engineering, applying all the widely known techniques and tools that the forensics world offers.
Another option that we have is using checkpointctl. This tool allows us to dig deeper into the checkpoint we have previously obtained.
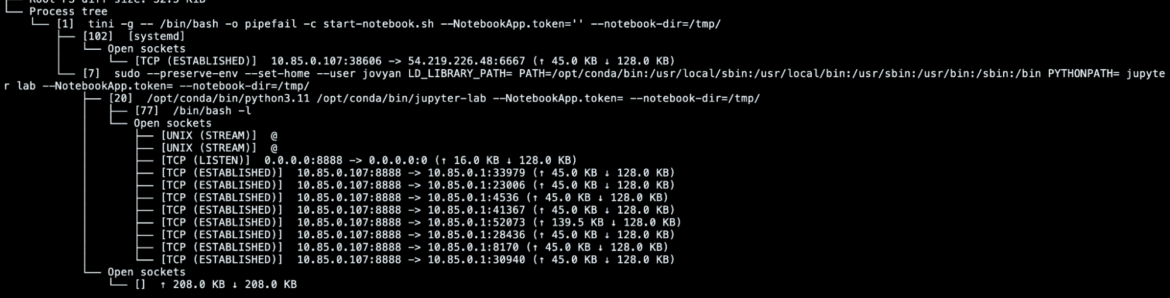
In particular, we can investigate what was in the checkpointed container by looking at the process tree. In this case, for example, we can easily see the TCP connection in place with the C2 established by the malicious [systemd] process.
We can also see the container memory when the container has been checkpointed and look for interesting patterns:
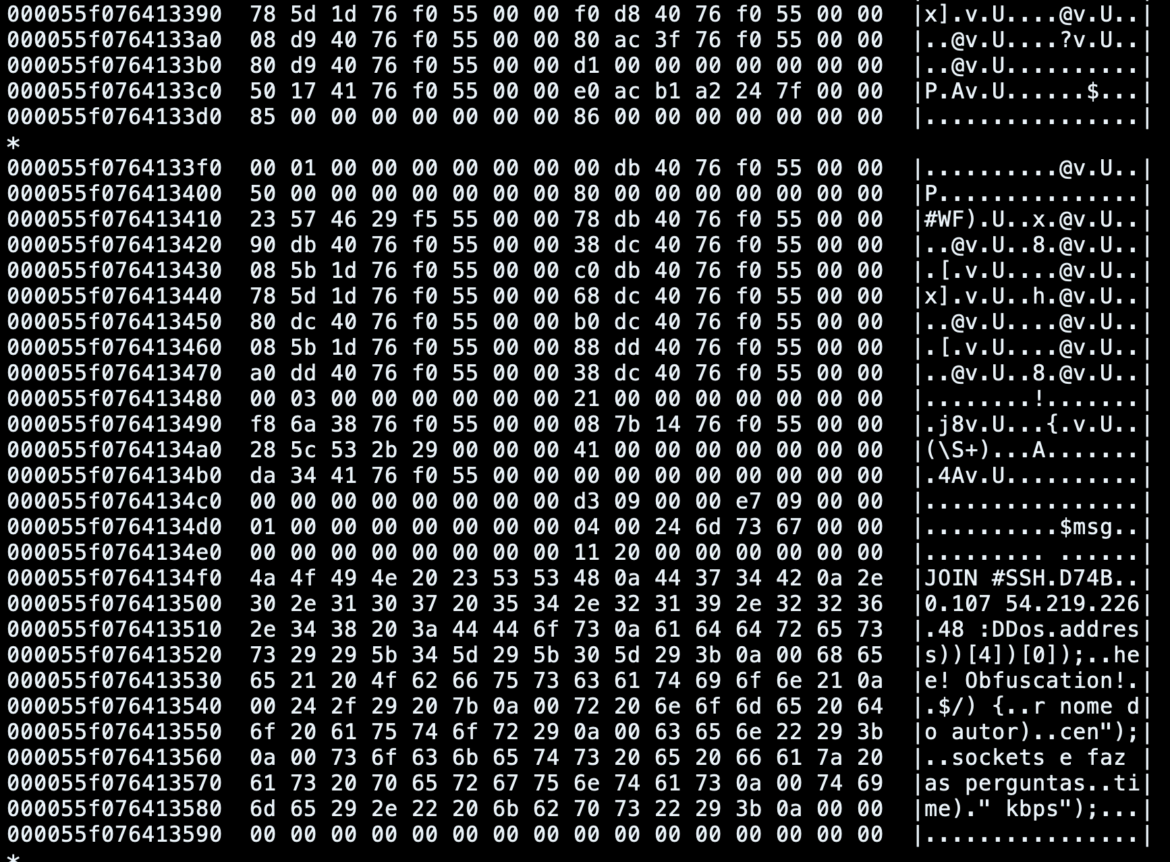
For example, in this case, we can easily identify highly suspicious strings and messages exchanged among the bot and the other machines connected to the same IRC channel.
Furthermore, checkpointctl can quickly help us identify container mounts that could have been assigned to the container and maybe abused by the attackers to escalate their privileges into the cluster.
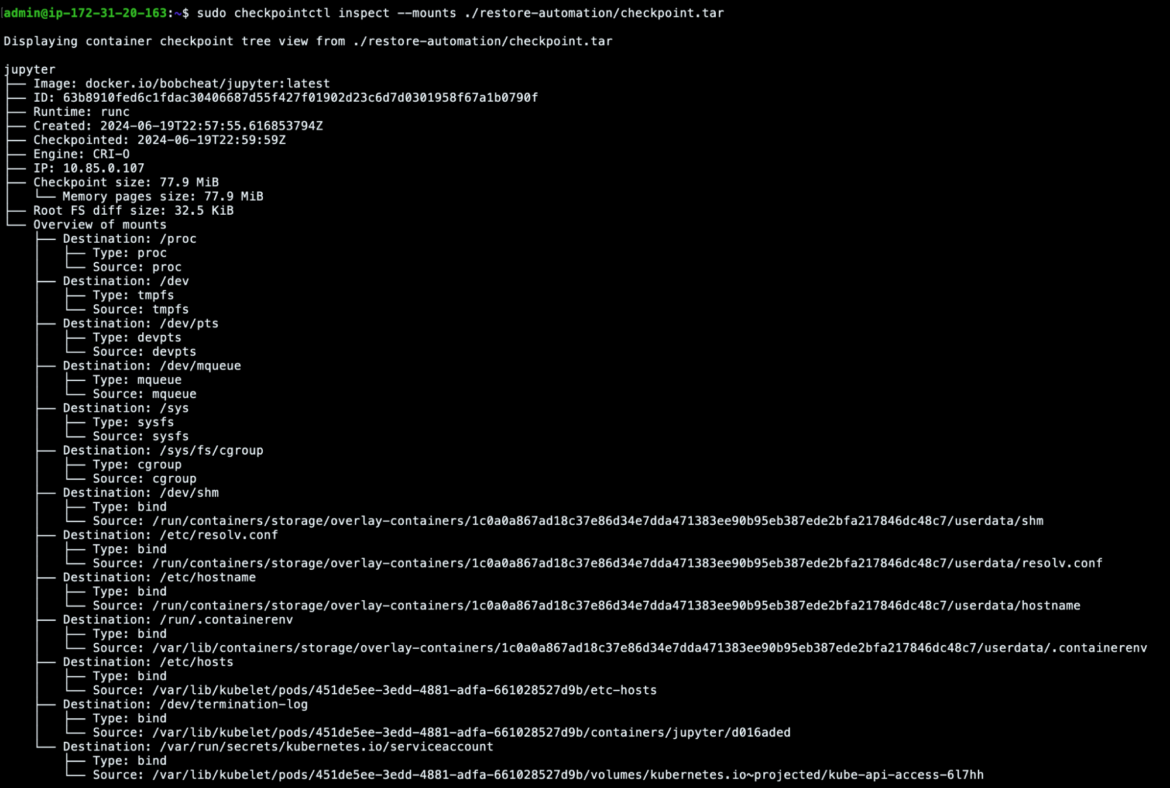
In this case, the only interesting mount was the Kubernetes service account attached to the Kubernetes pod's container, and this could have given the attackers access to the Kubernetes API server and maybe even the whole cluster. However, in this scenario, that was the default serviceaccount and its permissions were very restricted, so we won't go into detail on that.
However, best practices recommend that in case of sensitive mounts spotted in the impacted container, the investigation should go more in-depth, enlarging the scope to the whole cluster or the hosting Kubernetes node.
Another tool in our arsenal for static analysis is CRIT, which analyzes the CRIU image files stored in the checkpoint archive. Using those, we can obtain results similar to the ones we have seen with checkpointctl. So, for example, we can get the process tree, show files used by tasks, or even retrieve memory mapping info.
> crit x checkpoint ps

    PID   PGID    SID   COMM

      1      1      1   tini

      7      7      1       sudo

     20      7      1           jupyter-lab

     77     77     77               bash

    102    100     77       [systemd]
The content stored in the checkpoint can be real gold for our investigation. For example, by reading the raw memory pages, it is possible to look at environment variables and execution results related to the malicious process.
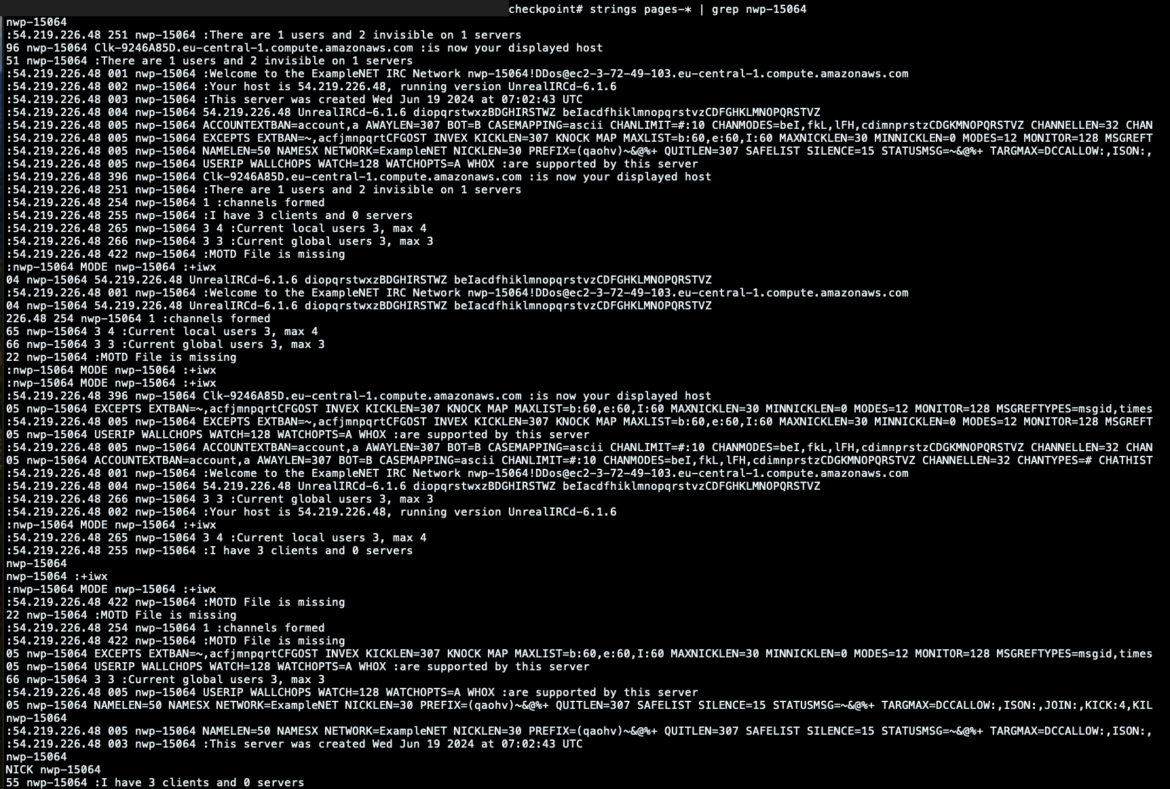
Here, for example, we retrieved the exchanged messages between the victim bot and server, printing out the output related to the binary execution.
This can give us an idea of what was executed on the impacted container. Still, it could also directly point out which messages were sent to the victim and which commands were requested by other machines connected to the same IRC channel.
Setting the stage for dynamic analysis
If we want to proceed with the dynamic analysis, we can start restoring the checkpoint that was done before in a specific and closed environment to analyze the malware and monitor its behavior.
Before proceeding, it's important to note the limitations of the current checkpointing and restoring features. While containers can be checkpointed and restored elsewhere, using the same container engine and CRIU versions on both affected and analysis machines for smoother restoration is strongly recommended. As of this writing, this feature wasn't integrated into containerd and remained unreliable on some interfaces like crun, so we relied on CRIO and runc for a more reliable process.
That said, how can the restoring process be achieved?
The first thing we want to do is to move the previously obtained checkpoint archive into safe storage. This best practice allows you to keep the evidence safe, ensuring you will always have the chance to rely on a backup in case the original checkpoint got lost, deleted, or tampered with.
Then, we can build a new container image from the previously checkpointed container archive using buildah utility. This step can also be automated, extending the previously described response engine. However, in general, the image-building process can be achieved as follows:
newcontainer=$(buildah from scratch)

buildah add $newcontainer /var/lib/kubelet/checkpoints/checkpoint-<pod-name>_<namespace-name>-<container-name>-<timestamp>.tar /

buildah config --annotation=io.kubernetes.cri-o.annotations.checkpoint.name=<container-name> $newcontainer

buildah commit $newcontainer checkpoint-image:latest

buildah rm $newcontainer

buildah push localhost/checkpoint-image:latest container-image-registry.example/user/checkpoint-image:latest
…where the /var/lib/kubelet/checkpoints/checkpoint-<pod-name>_<namespace-name>-<container-name>-<timestamp>.tar is the location where the checkpoint was written to disk.
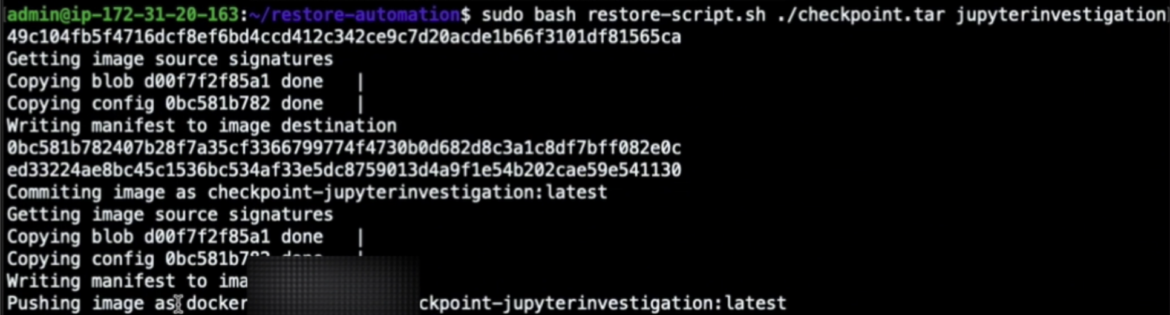
By doing this, we can push our new container image to our container registry so that we can later pull and run it into other machines.
Having built the container image from the container checkpoint, it's time to restore it into a completely separated Kubernetes cluster, where we will reproduce the previously frozen container by deploying it as a simple pod. Here is what our yaml template will look like:
apiVersion: v1

kind: Pod

metadata:

 name: restored-pod

spec:

 containers:

 - name: <container-name>

   image: <container-image-registry.example/user/checkpoint-image:latest>
…where the image is exactly the one we have previously pushed to our container registry.
Once we apply that yaml file, we can see that the newly restored pod is now running. By opening an interactive shell into the container, we can see exactly the same process tree we had before, with the same PIDs.
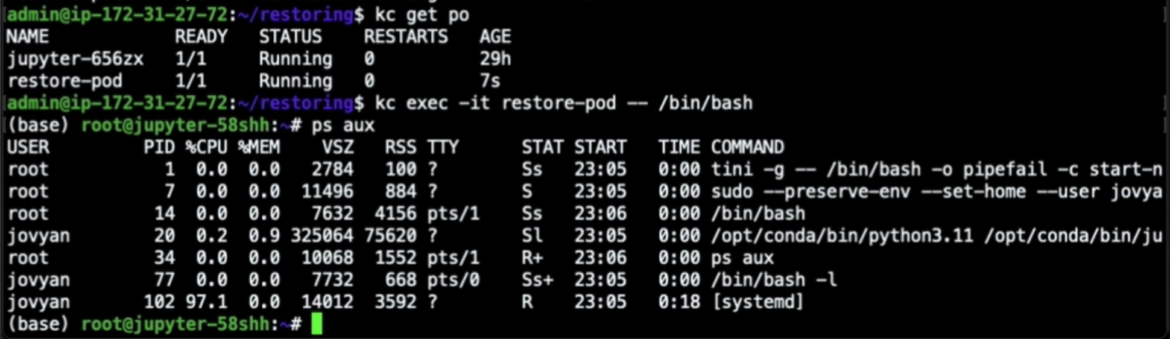
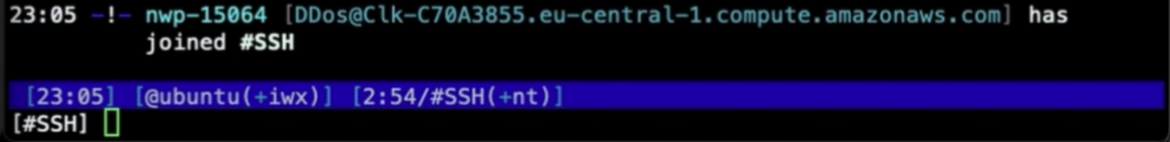
Even more surprisingly, the connection to the IRC bot channel was restored too. Here you can see that once our container was restored, it automatically connected back to the IRC server with the same bot nickname it had before it was checkpointed, as if we had just resurrected the execution we had previously frozen.
This scenario clearly shows the potentiality of container checkpointing and restoring. But it also allows us to reproduce and analyze the malicious execution in a separated and restricted environment, where we can adopt a more proactive and forensic approach.
Real-world scenario: Dynamic analysis
Before digging into the details of dynamic analysis, it is essential to stress the best practices to enforce in such scenarios and the requirements needed.
To safely reproduce malicious behavior in machines, it's crucial to establish strong constraints, like preventing container escapes or privilege escalation. Proper machine settings must be configured, sensitive information must be locked, and constraints must be verified for effective forensics. Additionally, using the right tools is essential for dynamic analysis and gaining low-level insights into the events happening on the machine.
Tools like Wireshark, Sysdig open source, strace, and others can allow you to see all the events. Having the exhaustive capture and collection of what happened at your disposal can lead you to the right path to resolve the investigation and help you spot the details of any attacks.
In our case, we used Sysdig open source to record syscall captures while the container was running. By collecting a capture for the necessary amount of time, right after the container was restored, it is possible to spy the malicious executions occurring within the container.
With that done, having the capture at our disposal, we later used Logray to quickly filter the events and carefully analyze what happened during the malicious execution. For those of you who haven't heard about Logray, it is Wireshark's cousin. It is able to examine syscall captures done with Sysdig open source, just as Wireshark is able to inspect network packet traffic.
However, they have the same UI and the same filtering logic that should sound familiar to most of you.
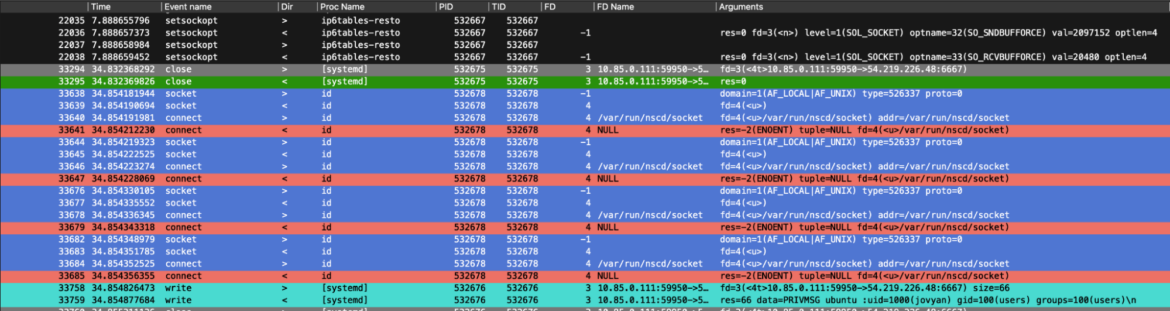
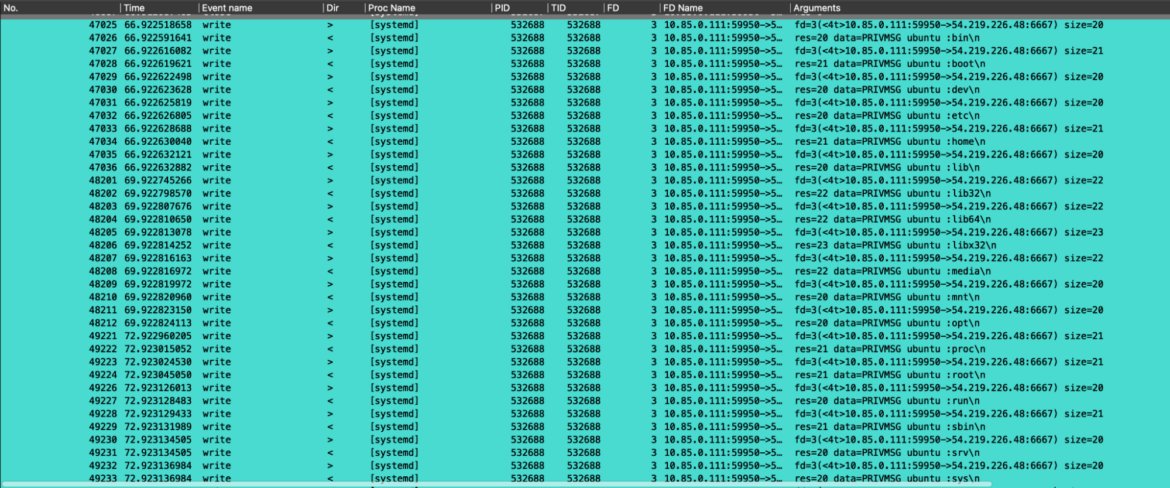
Here, for example, we dug into the execve syscalls. This allowed us to see all the commands requested by the attackers, chatting with our impacted restored container.
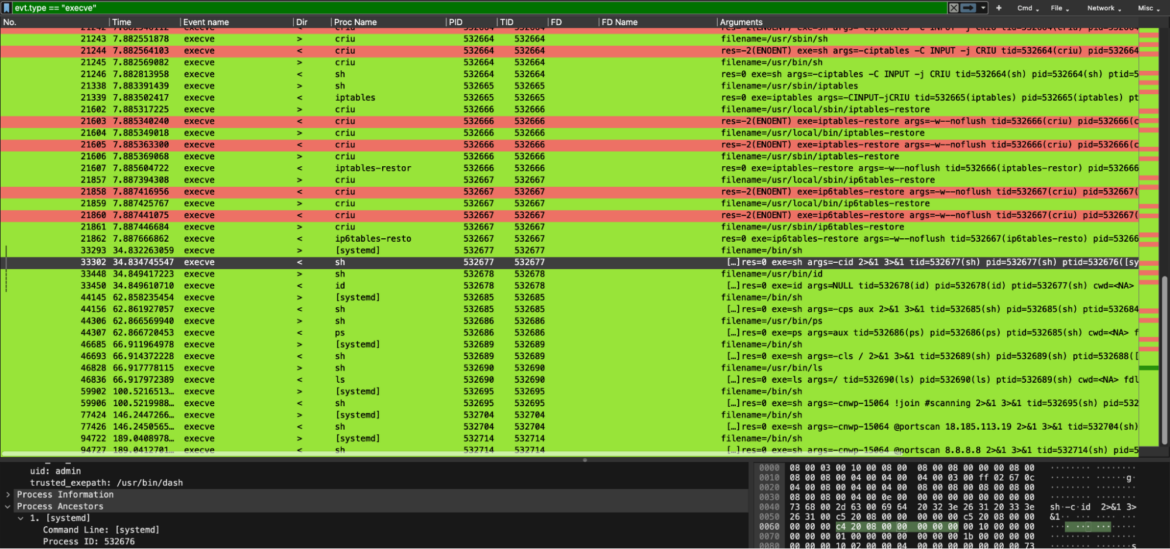
Right after that, we inspected network traffic-related events. Here, we can see how the previously requested commands by the attackers are followed by the answer to the victim container. These outbound network packets were done by the victim container to send the arbitrary command's results back to the attackers. In particular, the results of `id` and `ls /`.
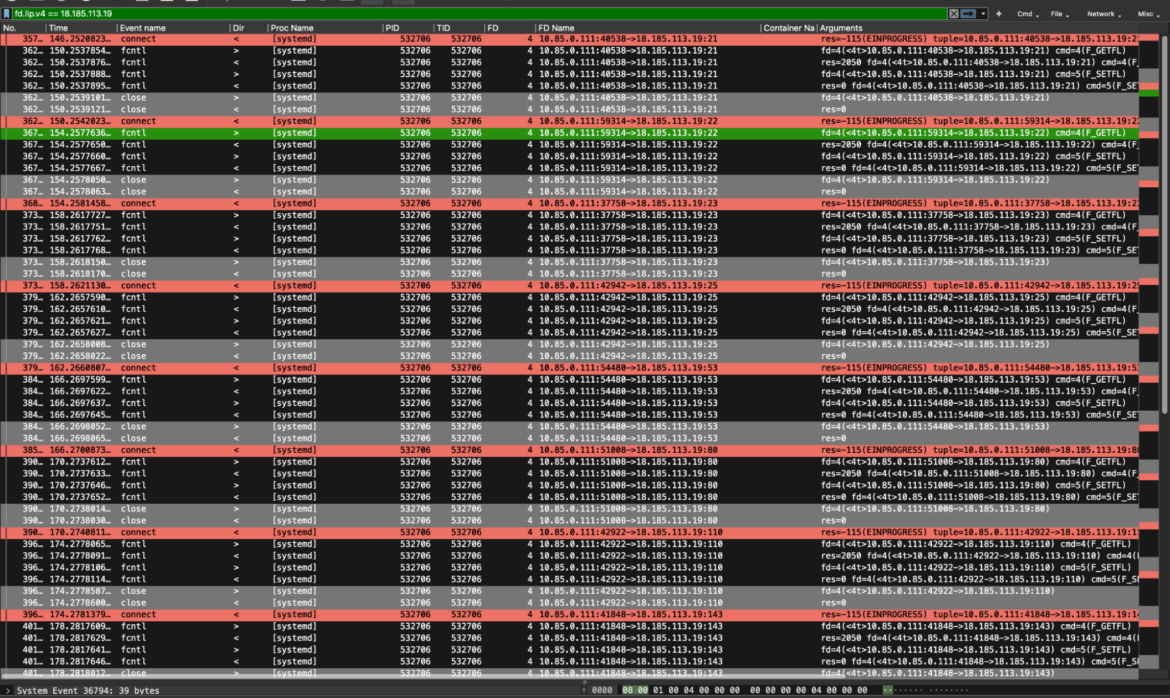
Eventually, since the attacker also requested to perform a portscan of a specific IP address, we filtered the events by looking at the IP involved. Here are all the related syscalls that show how the portscan command was performed by the engaged Perl bot.
Tool recap
Here is a quick recap of the tools used during the investigation.
Conclusion
In this article, we covered a new research topic, showing you how the container checkpoint/restore functionalities can be applied in the forensics field. In particular we have seen how the container checkpoint can be created automatically using the Kubernetes response engine that relies on few malicious rules, and also how to handle the newly created checkpoint archive.
With that done, we presented different ways to dig deeper using the previously created checkpoint: the static analysis, adopting some old-school techniques or tools specifically conceived for the container checkpoint, but also the dynamic analysis, covering some best practices and practical hints to extract the attack's details.
Credits and References
- https://kubernetes.io/blog/2022/12/05/forensic-container-checkpointing-alpha/
- https://kubernetes.io/blog/2023/03/10/forensic-container-analysis/
- https://kubernetes.io/docs/reference/node/kubelet-checkpoint-api/
- Kubernetes and Checkpoint Restore – Adrian Reber, Red Hat
- stackconf 2022 | Kubernetes and Checkpoint/Restore by Adrian Reber
- https://criu.org/Main_Page
- https://falco.org/blog/
- CSI Container: Can You DFIR It? – Alberto Pellitteri & Stefano Chierici, Sysdig
- CSI Forensics: Unraveling Kubernetes Crime Scenes – Alberto Pellitteri & Stefano Chierici, Sysdig