


Falco Feeds extends the power of Falco by giving open source-focused companies access to expert-written rules that are continuously updated as new threats are discovered.

Golden Signals are a reduced set of metrics that offer a wide view of a service from a user or consumer perspective: Latency, Traffic, Errors and Saturation. By focusing on these, you can be quicker at detecting potential problems that might be directly affecting the behavior of the application.
Google introduced the term “Golden Signals” to refer to the essential metrics that you need to measure in your applications. They are the following:
- Errors – rate of requests that fail.
- Saturation – consumption of your system resources.
- Traffic – amount of use of your service per time unit.
- Latency – the time it takes to serve a request.
This is just a set of essential signals to start monitoring in your system. In other words, if you’re wondering which signals to monitor, you will need to look at these four first.
Errors
The Errors golden signal measures the rate of requests that fail.
Note that measuring the bulk amount of errors might not be the best course of action. If your application has a sudden peak of requests, then logically the amount of failed requests may increase.
That’s why usually monitoring systems focus on the error rate, calculated as the percent of calls that are failing from the total.
If you’re managing a web application, typically you will discriminate between those calls returning HTTP status in the 400-499 range (client errors) and 500-599 (server errors).
Measuring errors in Kubernetes
One thermometer for the errors happening in Kubernetes is the Kubelet. You can use several Kubernetes State Metrics in Prometheus to measure the amount of errors.
The most important one is kubelet_runtime_operations_errors_total, which indicates low level issues in the node, like problems with container runtime.
If you want to visualize errors per operation, you can use kubelet_runtime_operations_total to divide.
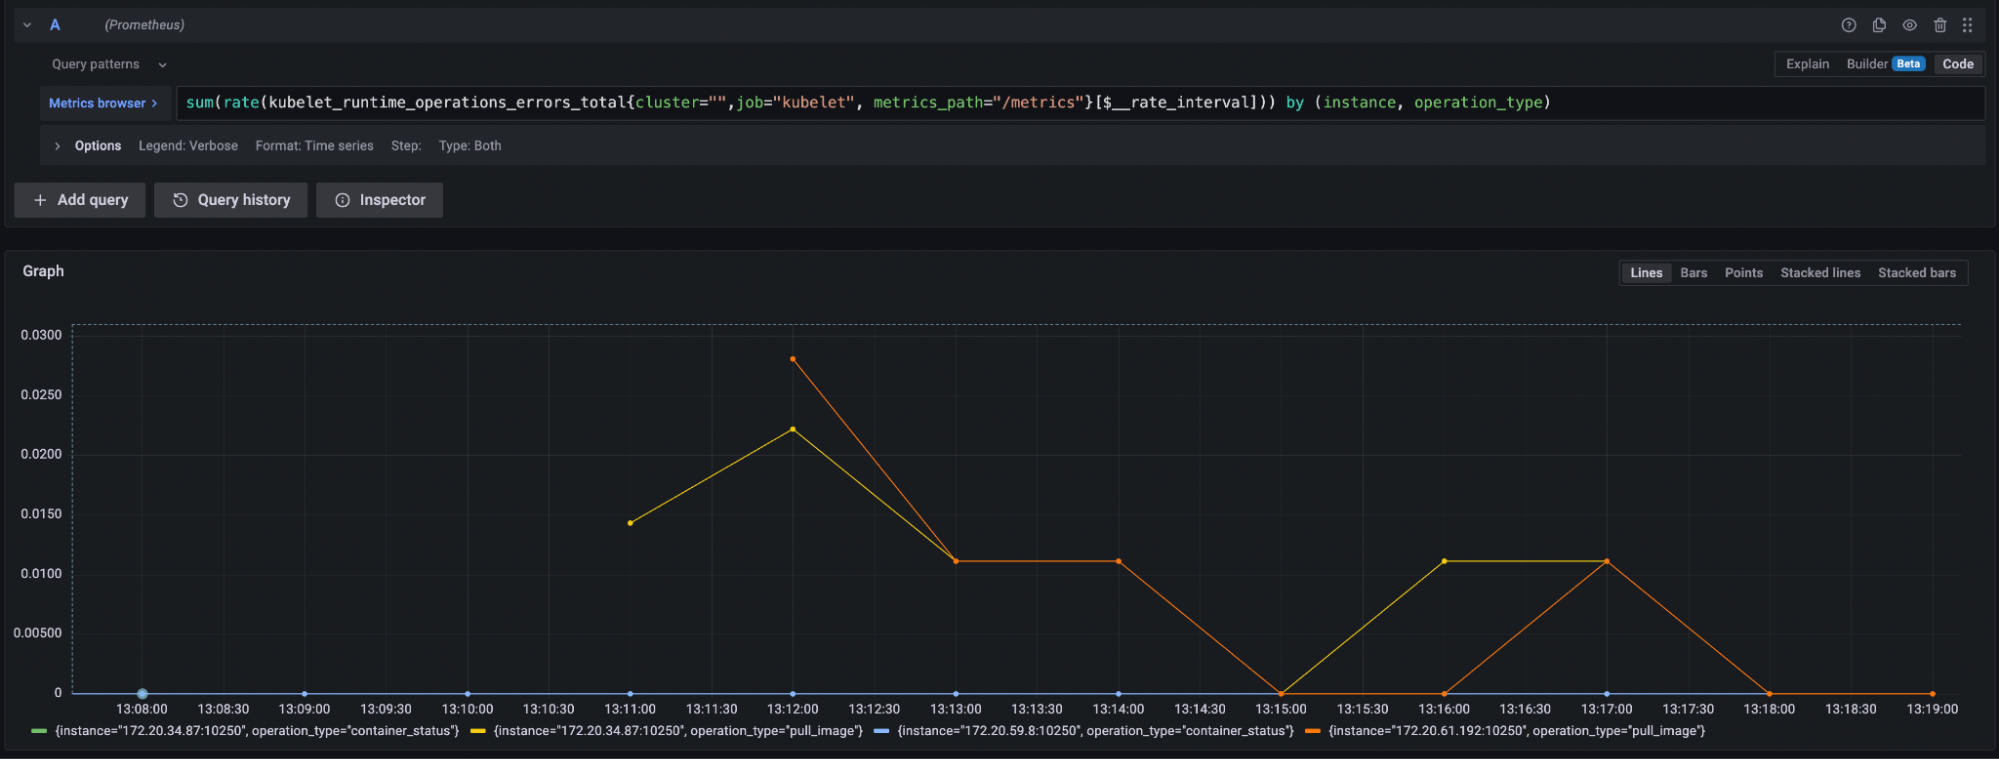
Errors example
Here’s the Kubelet Prometheus metric for error rate in a Kubernetes cluster:
Saturation
Saturation measures the consumption of your system resources, usually as a percentage of the maximum capacity. Examples include:
- CPU usage
- Disk space
- Memory usage
- Network bandwidth
In the end, cloud applications run on machines, which have a limited amount of these resources.
In order to correctly measure, you should be aware of the following:
- What are the consequences if the resource is depleted? It could be that your entire system is unusable because this space has run out. Or maybe further requests are throttled until the system is less saturated.
- Saturation is not always about resources about to be depleted. It’s also about over-resourcing, or allocating a higher quantity of resources than what is needed. This one is crucial for cost savings.
Measuring saturation in Kubernetes
Since saturation depends on the resource being observed, you can use different metrics for Kubernetes entities:
node_cpu_seconds_totalto measure machine CPU utilization.container_memory_usage_bytesto measure the memory utilization at container level (paired withcontainer_memory_max_usage_bytes).- The amount of Pods that a Node can contain is also a Kubernetes resource.
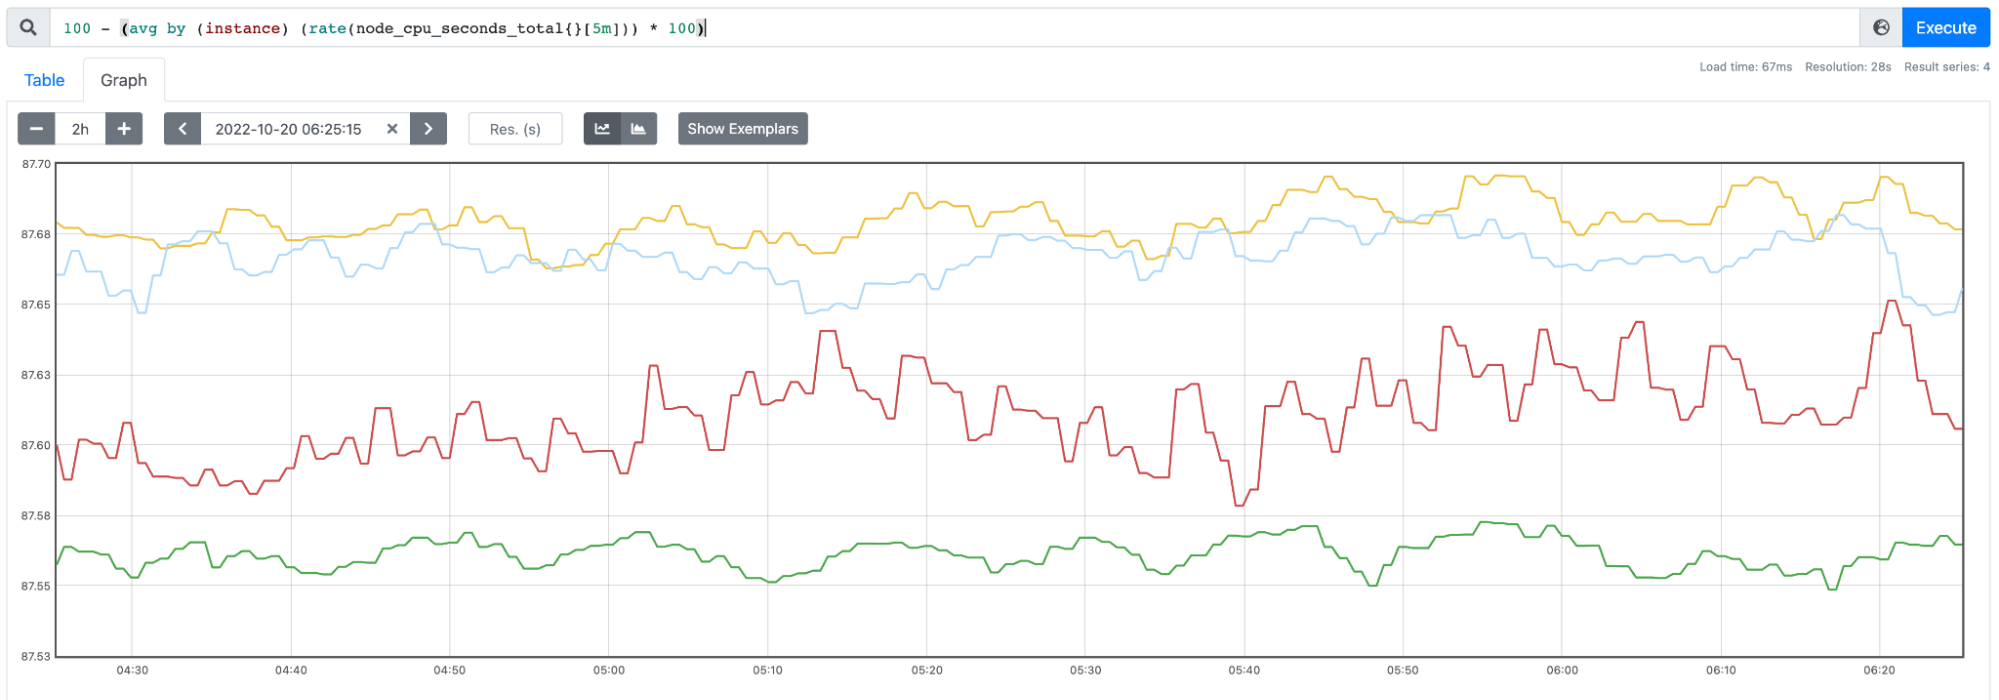
Saturation example
Here’s a PromQL example of a Saturation signal, measuring CPU usage percent in a Kubernetes node.
Traffic
Traffic measures the amount of use of your service per time unit.
In essence, this will represent the usage of your current service. This is important not only for business reasons, but also to detect anomalies.
Is the amount of requests too high? This could be due to a peak of users or because of a misconfiguration causing retries.
Is the amount of requests too low? That may reflect that one of your systems is failing.
Still, traffic signals should always be measured with a time reference. As an example, this blog receives more visits from Tuesday to Thursday.
Depending on your application, you could be measuring traffic by:
- Requests per minute for a web application
- Queries per minute for a database application
- Endpoint requests per minute for an API
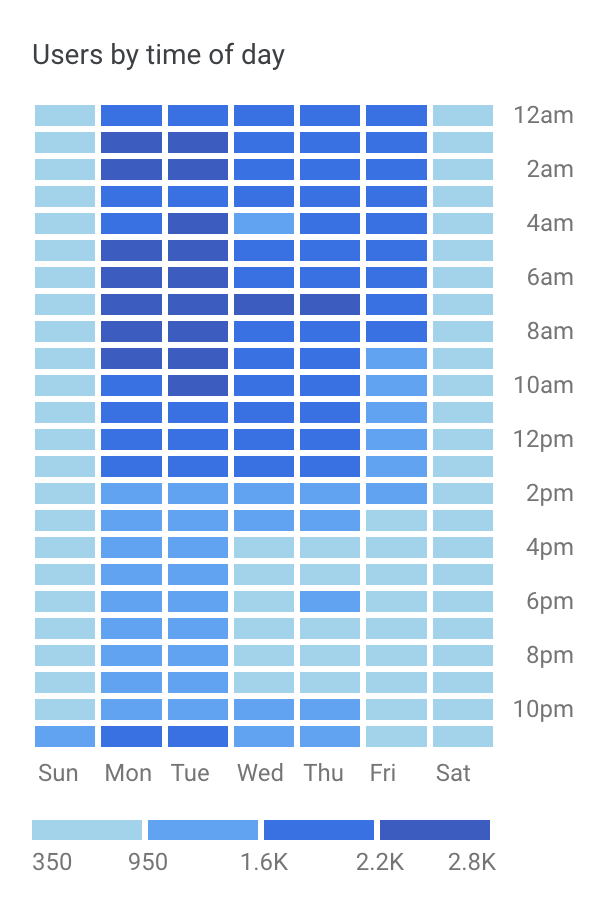
Traffic example
Here’s a Google Analytics chart displaying traffic distributed by hour:
Latency
Latency is defined as the time it takes to serve a request.
Average latency
When working with latencies, your first impulse may be to measure average latency, but depending on your system that might not be the best idea. There may be very fast or very slow requests distorting the results.
Instead, consider using a percentile, like p99, p95, and p50 (also known as median) to measure how the fastest 99%, 95%, or 50% of requests, respectively, took to complete.
Failed vs. successful
When measuring latency, it’s also important to discriminate between failed and successful requests, as failed ones might take sensibly less time than the correct ones.
Apdex Score
As described above, latency information may not be informative enough:
- Some users might perceive applications as slower, depending on the action they are performing.
- Some users might perceive applications as slower, based on the default latencies of the industry.
This is where the Apdex (Application Performance Index) comes in. It’s defined as:

Where t is the target latency that we consider as reasonable.
- Satisfied will represent the amount of users with requests under the target latency.
- Tolerant will represent the amount of non-satisfied users with requests below four times the target latency.
- Frustrated will represent the amount of users with requests above the tolerant latency.
The output for the formula will be an index from 0 to 1, indicating how performant our system is in terms of latency.
Measuring latency in Kubernetes
In order to measure the latency in your Kubernetes cluster, you can use metrics like http_request_duration_seconds_sum.
You can also measure the latency for the api-server by using Prometheus metrics like apiserver_request_duration_seconds.
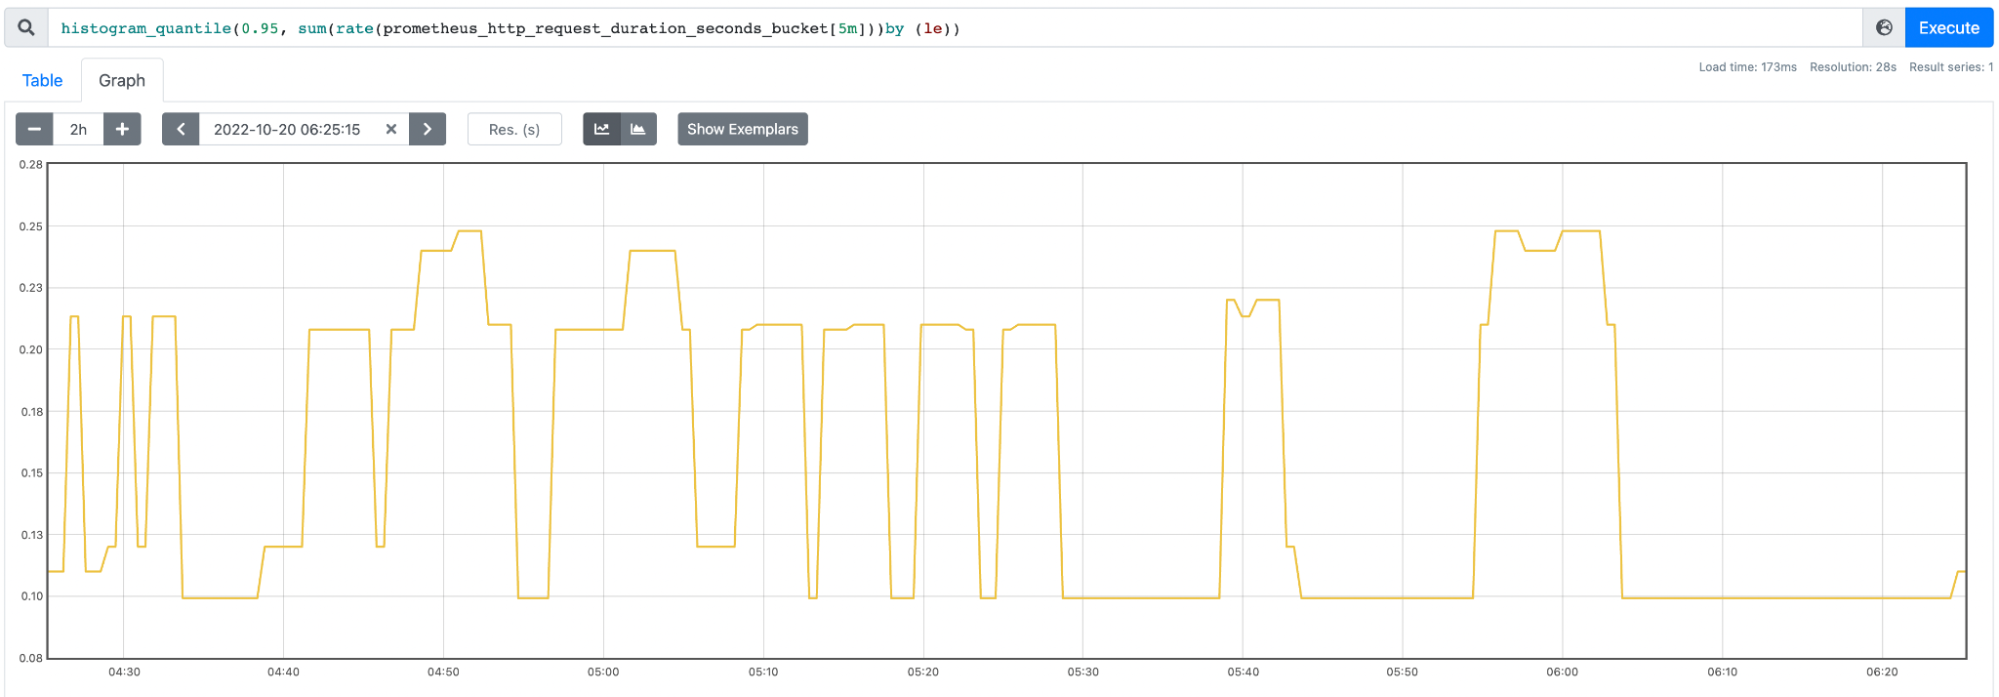
Latency example
Here’s an example of a Latency PromQL query for the 95% best performing HTTP requests in Prometheus:
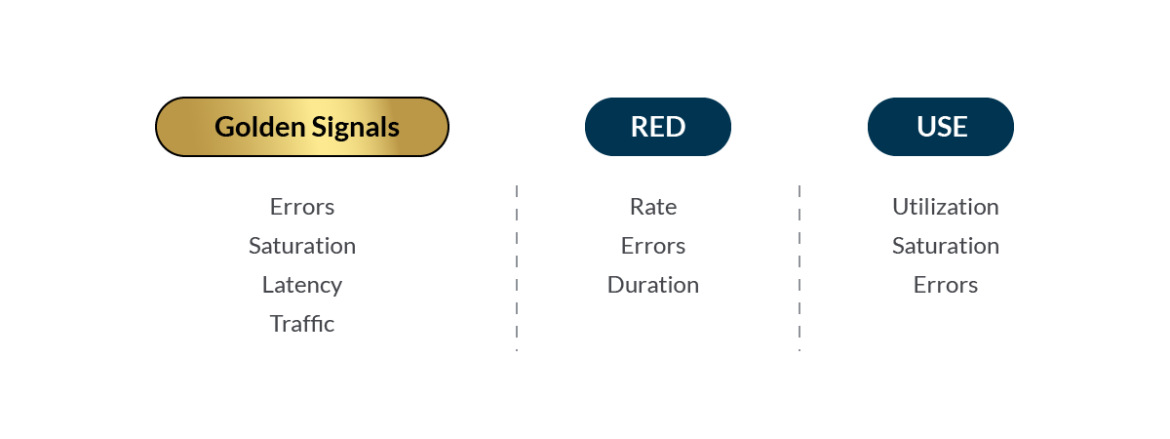
RED Method
The RED Method was created by Tom Wilkie, from Weaveworks. It is heavily inspired by the Golden Signals and it’s focused on microservices architectures.
RED stands for:
- Rate
- Error
- Duration
Rate measures the number of requests per second (equivalent to Traffic in the Golden Signals).
Error measures the number of failed requests (similar to the one in Golden Signals).
Duration measures the amount of time to process a request (similar to Latency in Golden Signals).
USE Method
The USE Method was created by Brendan Gregg and it’s used to measure infrastructure.
USE stands for:
- Utilization
- Saturation
- Errors
That means for every resource in your system (CPU, disk, etc.), you need to check the three elements above.
Utilization is defined as the percentage of usage for that resource.
Saturation is defined as the queue for requests in the system.
Errors is defined as the number of errors happening in the system.
While it may not be intuitive, Saturation in Golden Signals is not similar to the Saturation in USE, but rather Utilization.
A practical example of Golden signals in Kubernetes
As an example to illustrate the use of Golden Signals, here’s a simple go application example with Prometheus instrumentation. This application will apply a random delay between 0 and 12 seconds in order to give usable information of latency. Traffic will be generated with curl, with several infinite loops.
An histogram was included to collect metrics related to latency and requests. These metrics will help us obtain the initial three Golden Signals: latency, request rate and error rate. To obtain saturation directly with Prometheus and node-exporter, use percentage of CPU in the nodes.
The application was deployed in a Kubernetes cluster with Prometheus and Grafana, and generated a dashboard with Golden Signals. In order to obtain the data for the dashboards, these are the PromQL queries:
Latency:
Request rate:
Errors per second:
Saturation:
Conclusion
Golden Signals, RED, and USE are just guidelines on what you should be focusing on when looking at your systems. But these are just the bare minimum on what to measure.
Understand the errors in your system. They will be a thermometer of all the other metrics, as they will point to any unusual behavior. And remember that you need to correctly mark requests as erroneous, but only the ones that should be exceptionally incorrect. Otherwise, your system will be prone to false positives or false negatives.
Measure latency of your requests. Try to understand your bottlenecks and what the negative experiences are when latency is higher than expected.
Visualize saturation and understand the resources involved in your solution. What are the consequences if a resource gets depleted?
Measure traffic to understand your usage curves. You will be able to find the best time to take down your system for an update, or you could be alerted when there’s an unexpected amount of users.
Once metrics are in place, it’s important to set up alerts, which will notify you in case any of these metrics reach a certain threshold.
Monitor Kubernetes and troubleshoot issues up to 10x faster
Sysdig can help you monitor and troubleshoot your Kubernetes cluster with the out-of-the-box dashboards included in Sysdig Monitor. Advisor, a tool integrated in Sysdig Monitor accelerates troubleshooting of your Kubernetes clusters and its workloads by up to 10x.
Sign up for a 30-day trial account and try it yourself!