Monitoring Red Hat OpenShift brings up challenges compared to a vanilla Kubernetes distribution. Discover how Sysdig Monitor, and its exclusive features in OpenShift, will help you monitor and troubleshoot your issues fast and easily.
OpenShift builds many out-of-the-box add-ons into its Kubernetes foundation. For example, the OpenShift API server, Controller Manager, Ingress, or Marketplace ecosystem. This creates a more complex environment that can cause you to struggle.
Sysdig Monitor brings order to this complexity. The out-of-the-box dashboards will get you started right away, and will let you set alerts for your Prometheus metrics. And the advanced troubleshooting features found in Advisor will highlight hidden problems, so you can fix them very quickly.
This article will cover the following topics:
-
How to more efficiently monitor your OpenShift clusters with Sysdig Monitor.
-
How to troubleshoot issues in OpenShift with Sysdig Monitor.
OpenShift Monitoring stack
OpenShift is a Kubernetes enterprise solution built on top of the Kubernetes open source distribution. It includes other components out-of-the-box that makes OpenShift one of the most popular distributions among customers.
Being one of the leaders in the market, OpenShift is widely adopted and counts on the support of the community via the upstream project OKD.
OpenShift comes out-of-the-box with its own monitoring stack – commonly known as OpenShift Monitoring – that covers basic observability functionality for its customers.
This stack is based on open source projects:
- Prometheus as a backend to store the time-series data.
- Alertmanager to handle alarms and send notifications.
- Grafana for representing data in the form of graphs.
OpenShift monitoring is deployed by default, at installation time, managed with the Cluster Monitoring Operator.
Users can access the monitoring data directly from the OpenShift console or by logging into the Prometheus UI.
Disclaimer: The following screenshots correspond to OpenShift 4.9 version. Options, graphs and other information may change in future versions.
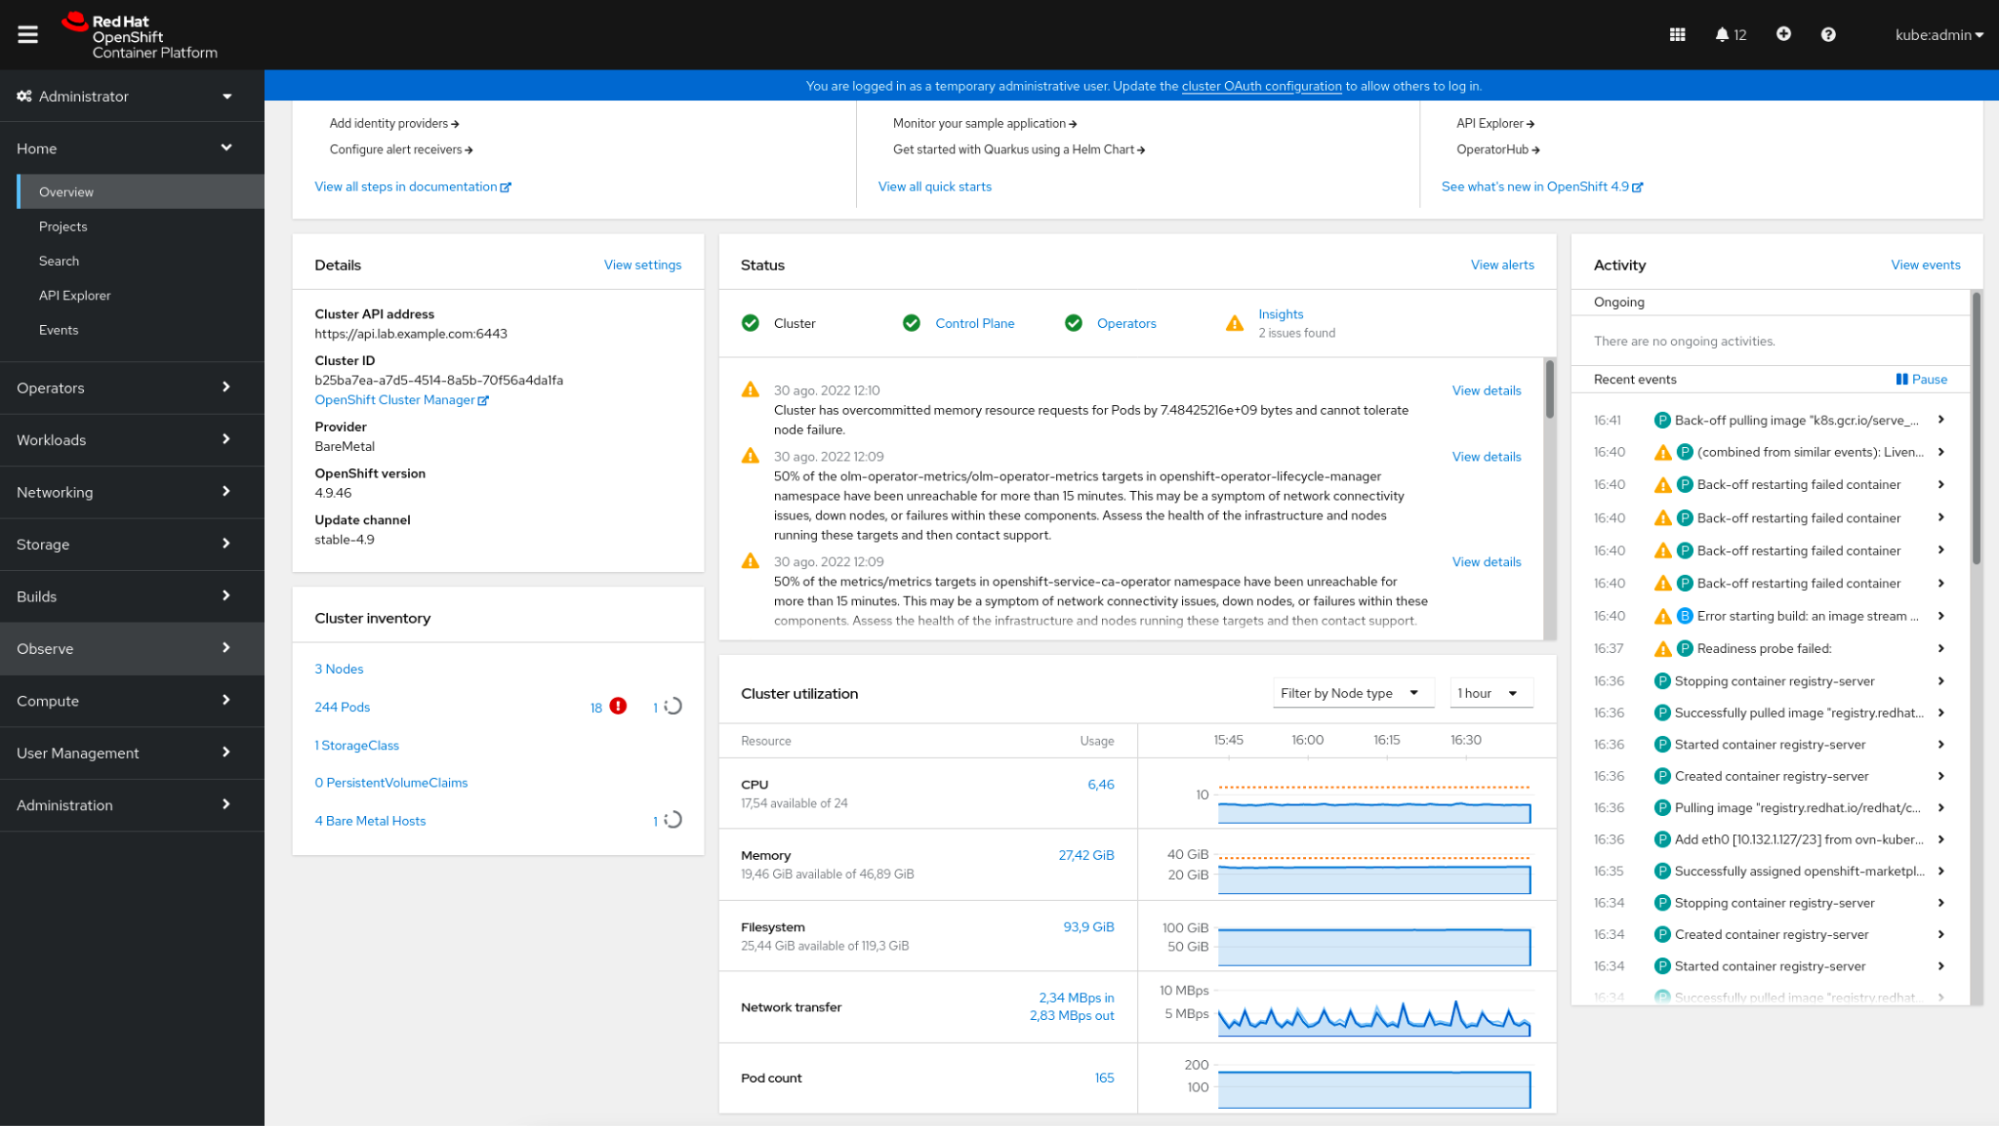
The OpenShift console shows a brief summary of the status of the OpenShift cluster, some information about the recent events, and a few small graphs displaying the resource consumption, among other data.
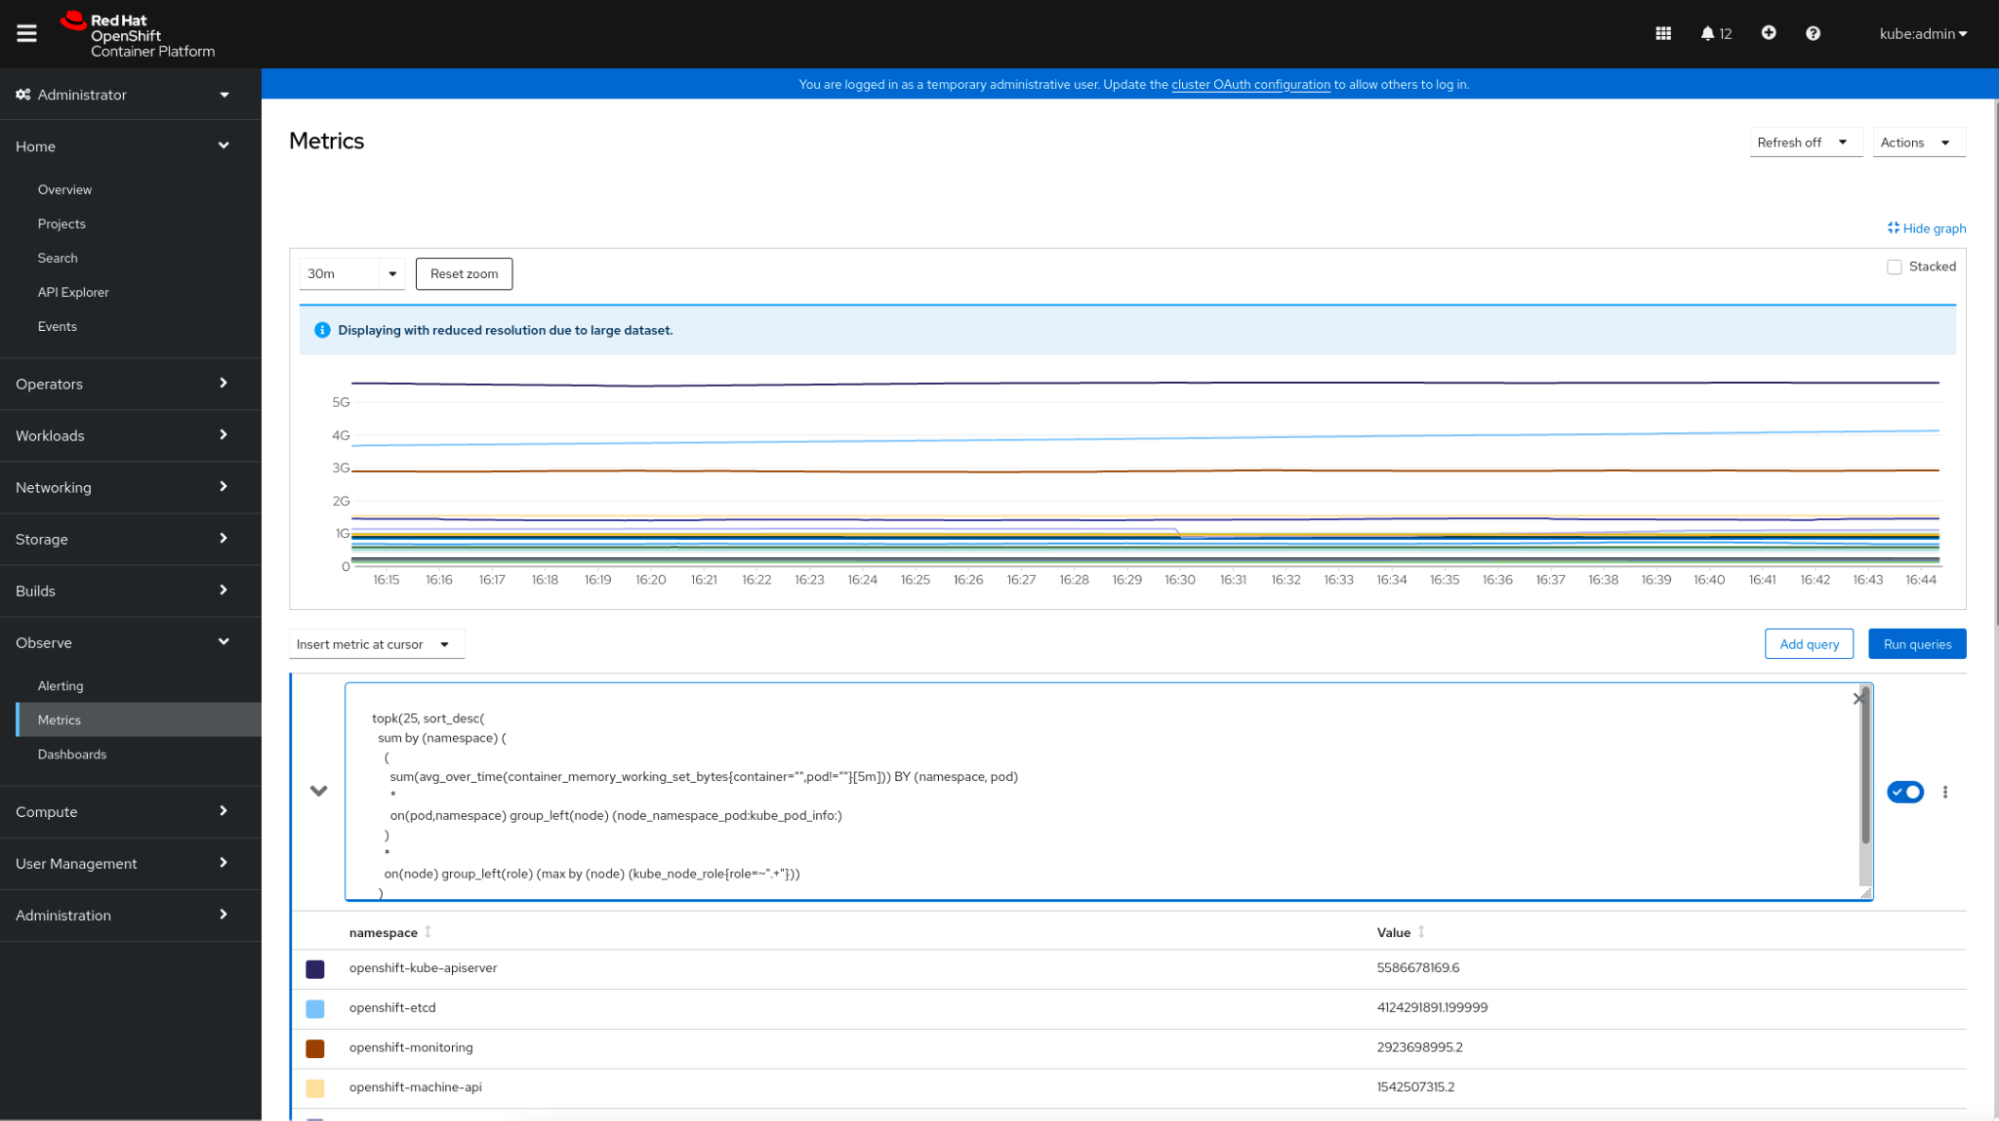
The OpenShift console is integrated with Prometheus. It provides a “Metrics” section where the user can run their own queries.
In terms of metrics observability, OpenShift provides an integrated dashboard view in the console, besides the Grafana interface that can be accessed independently.
These default dashboards and the relevant data scraped by Prometheus can be reviewed in the console itself. Just click on “Observe” -> “Dashboards” and select the desired dashboard.
This example shows how the etcd metrics dashboard is represented.

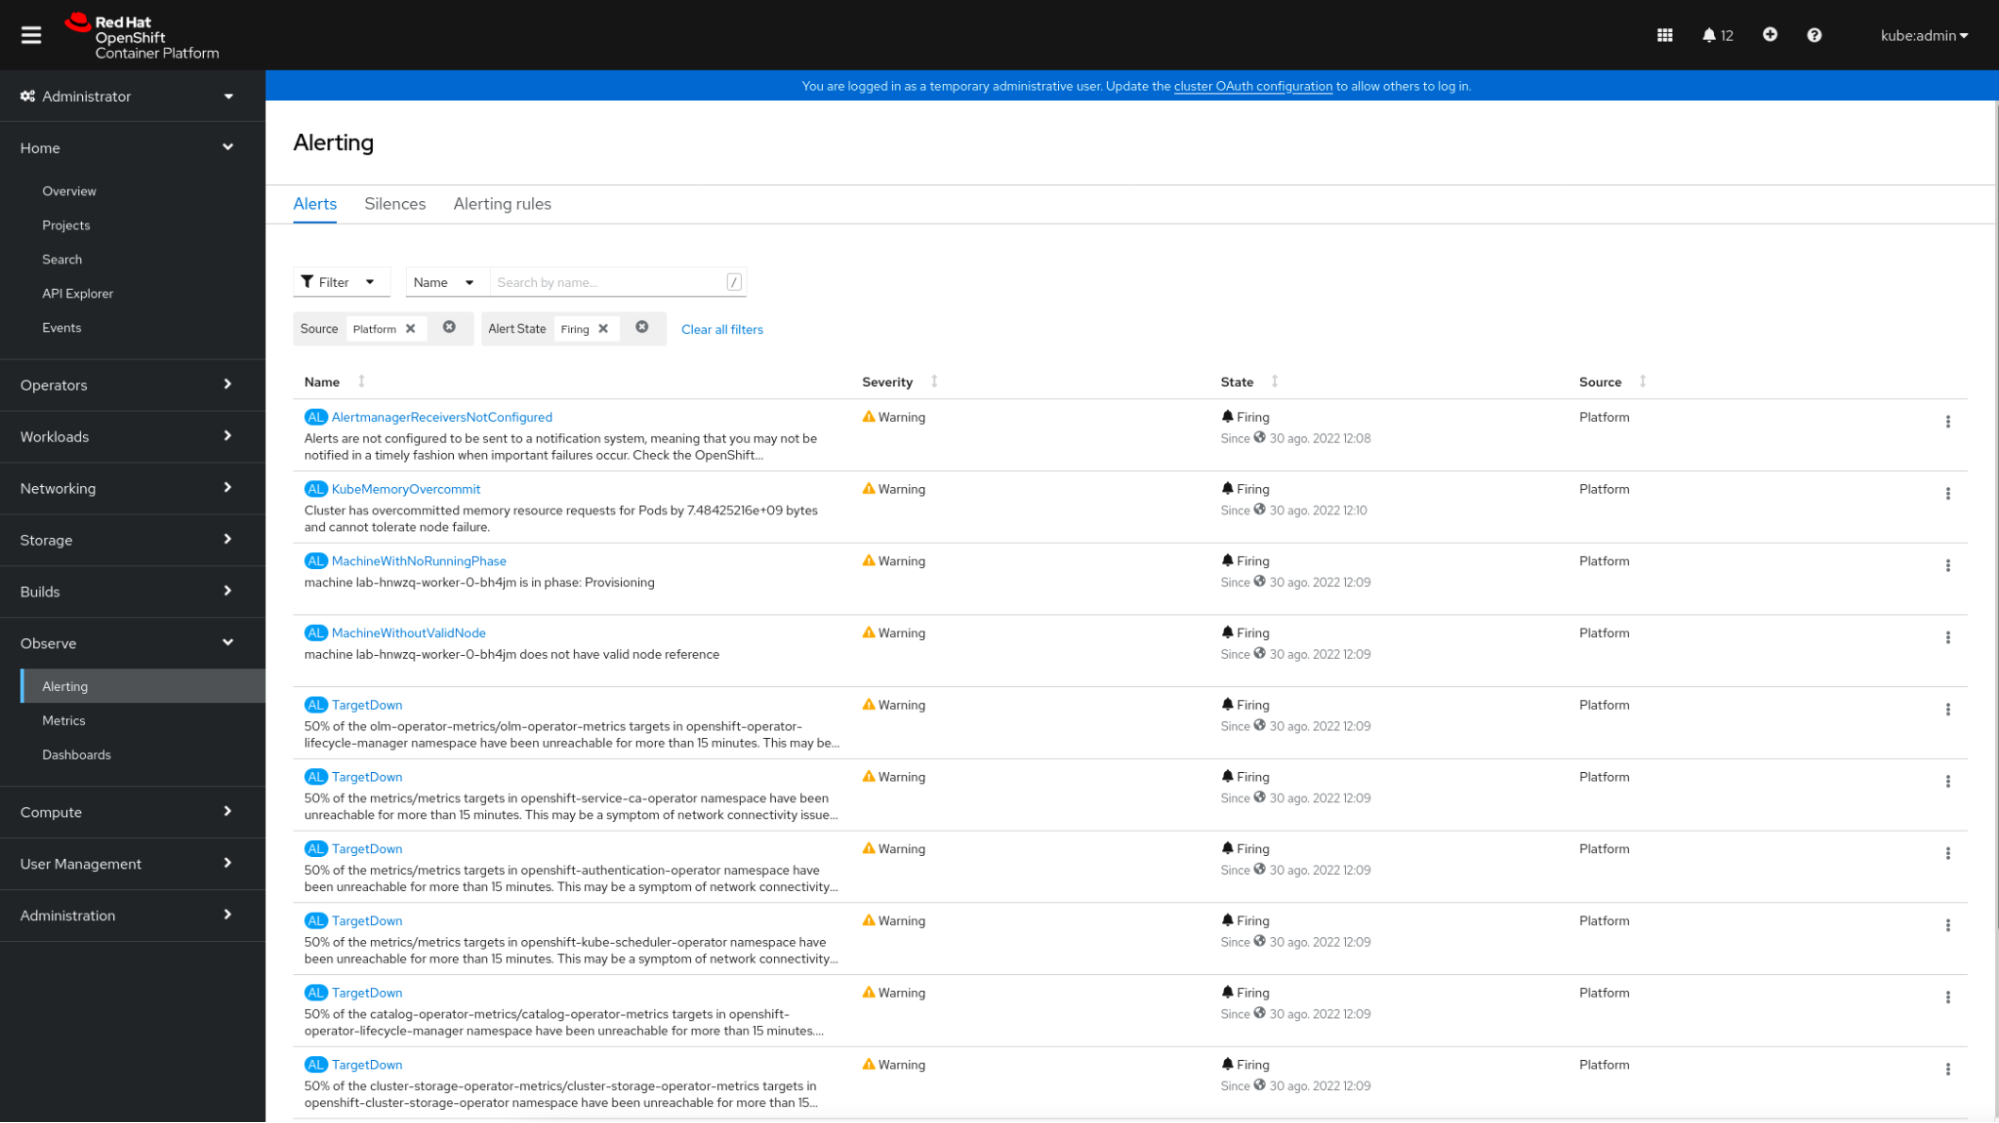
Lastly, OpenShift offers an alerting system based on Alertmanager. In this Alerting section, administrators can view and silence the default alerting rules included with OpenShift. OpenShift allows creating new alerting rules for user-defined projects via PrometheusRule CRD (Custom Resource Definition).
Why Sysdig Monitor?
As an OpenShift customer, you might reach this point having a basic and fundamental question:
Why should I use Sysdig Monitor if OpenShift already provides its own monitoring tool?
This question will be elaborated on the next sections of this article, but it is worth mentioning some of the strong points that position Sysdig Monitor as a great tool to monitor OpenShift clusters and troubleshooting issues:
- Sysdig Advisor helps you troubleshoot issues in OpenShift faster with our prioritized list of issues, live logs, YAML views, and guided remediation steps.
- A big library of dashboards created and curated by the Sysdig engineering team shows data for you in minutes after deploying the Sysdig agents.
- Automatic captures save activity data to analyze post-mortem for any container event.
- Predefined alerts are available for the whole cluster or can be customized to your needs.
- Explore lets you view all your metrics with Sysdig Monitor’s form-based UI or PromQL.
- Third-party software is integrated. Sysdig Monitor detects software from other vendors and guides you through the integration process.
- Capacity and utilization dashboards help you identify under-or over-provisioned areas.
- A single tool enables you to observe all your clusters and cloud environments in one place.
- A scalable SaaS-based solution means you don’t need to worry about Prometheus scalability and long-term storage. These critical points are already covered by Sysdig.
How to monitor OpenShift with Sysdig Monitor
Sysdig Monitor ingests Prometheus time series data, logs, and events from both Kubernetes control-plane containers and customer workloads. Data collection is performed by a lightweight agent deployed on every Kubernetes node in the cluster.
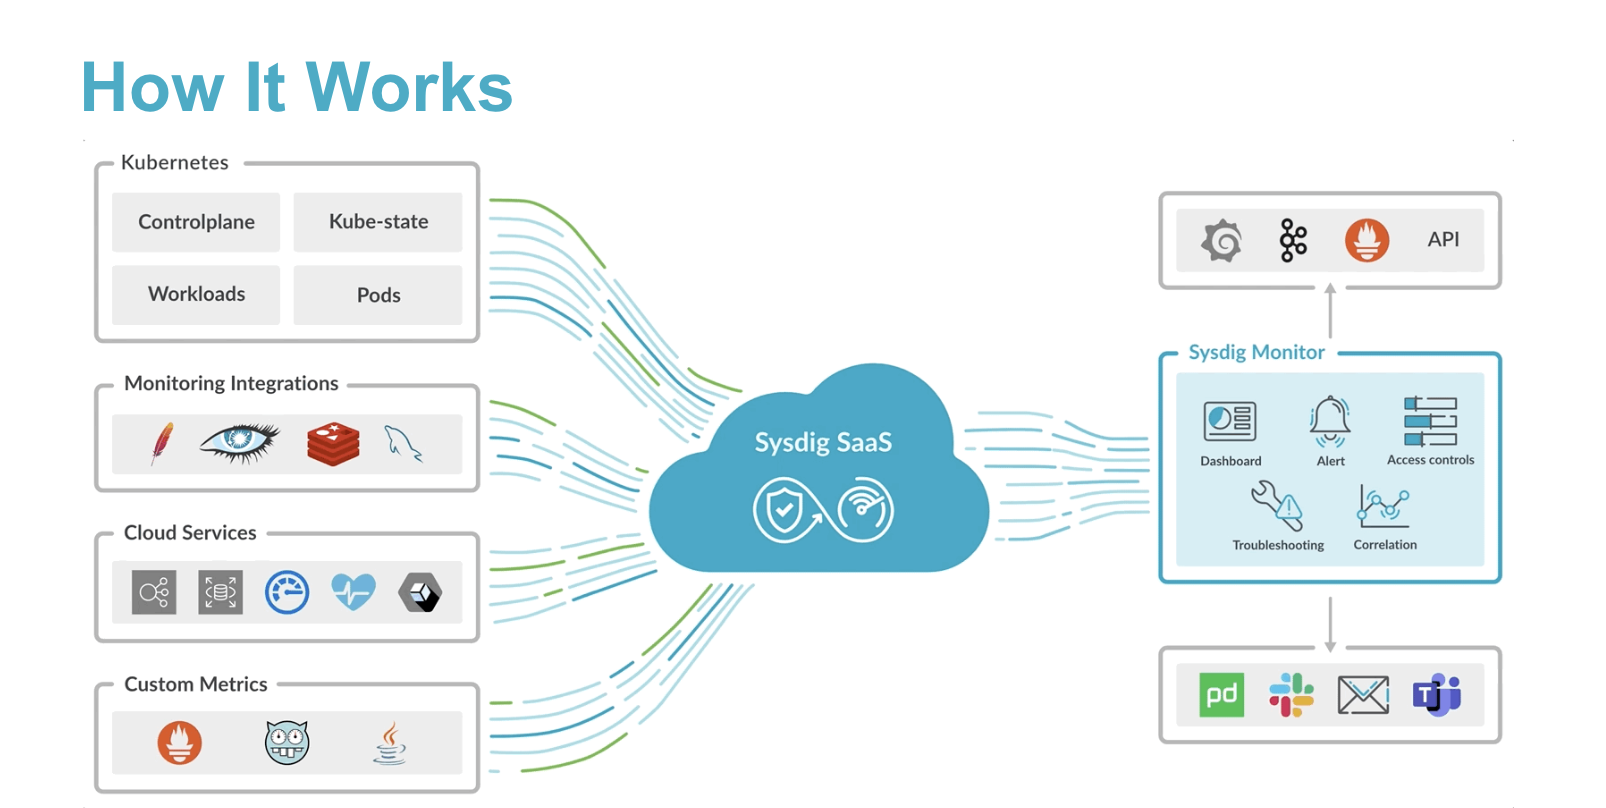
Sysdig agent installation is as easy as:
- Install the Sysdig Agent (manually applying some yaml files or with Helm).
- Let it collect the host syscalls and Prometheus time series data.
- Start checking your cluster health in Sysdig Monitor’s out-of-the-box dashboards.
For further information on the agent, check out this behind the scenes blog post.
Does this sound good to you? Would you like to give it a try?
New users can request a 30-day trial account. You will have access to all the features for 30 days and, it is not required to provide a payment method at all!
Installing the agent
This time, the Sysdig agent will be installed using the Sysdig-deploy helm chart.
If you want more information on how to deploy the agent, log into Sysdig Monitor and click on “Get Started.”
The following installation steps were tested in OpenShift 4.9.46 using the sysdig-deploy helm chart 1.3.8 which deploys agent helm chart 1.5.19 including 12.8.0 agent images. The Sysdig official documentation provides a step-by-step procedure to deploy the Sysdig agent, please check it out to get the most recent version instructions.
$ kubectl create ns sysdig-agent
$ helm repo add sysdig https://charts.sysdig.com
$ helm repo update
$ helm install sysdig-agent --namespace sysdig-agent \
    --set global.sysdig.accessKey=aaaaaaaa-bbbb-cccc-dddd-eeeeeeeeeeee \
    --set agent.sysdig.settings.collector=ingest-eu1.app.sysdig.com \
    --set agent.sysdig.settings.collector_port=6443 \
    --set global.clusterConfig.name=<CLUSTER_NAME> \
    sysdig/sysdig-deploy
After deploying it via helm, a few Pods should be up and running in a few minutes.
$ oc get pods -o wide                                                                                                                                                                                                                                      ipibm-installer.lab.example.com: Wed Aug 31 13:13:03 2022
NAME                               READY   STATUS    RESTARTS   AGE   IP               NODE              NOMINATED NODE   READINESS GATES
sysdig-agent-dvz5n                 1/1     Running   0          1m   192.168.119.20   ipibm-master-01   <none>           <none>
sysdig-agent-h66t9                 1/1     Running   0          1m   192.168.119.22   ipibm-master-03   <none>           <none>
sysdig-agent-mvgl8                 1/1     Running   0          1m   192.168.119.21   ipibm-master-02   <none>           <none>
sysdig-agent-node-analyzer-k8wwm   3/3     Running   0          1m   192.168.119.20   ipibm-master-01   <none>           <none>
sysdig-agent-node-analyzer-v5q8j   3/3     Running   0          1m   192.168.119.21   ipibm-master-02   <none>           <none>
sysdig-agent-node-analyzer-x6j8b   3/3     Running   0          1m   192.168.119.22   ipibm-master-03   <none>           <none>
From that moment, those containers are gathering a lot of Prometheus time series data from the nodes, and sending those metrics to the Sysdig Monitor service in the cloud.
So, what’s next?
There’s nothing really outstanding. Just go to Sysdig Monitor, select your region, and log in using your credentials.
Disclaimer: Some of the OpenShift control plane integrations might be disabled by default. If you miss any control plane metric or dashboard, reach out to your customer support representative and ask for activation.
Watching the metrics in Sysdig Monitor
You will find a clean and well-organized UI where main sections are placed in the left menu bar, including Advisor, Dashboards, Explore, Alerts, Events, and Captures.
Let’s review a few dashboards from all that Sysdig Monitor offers.
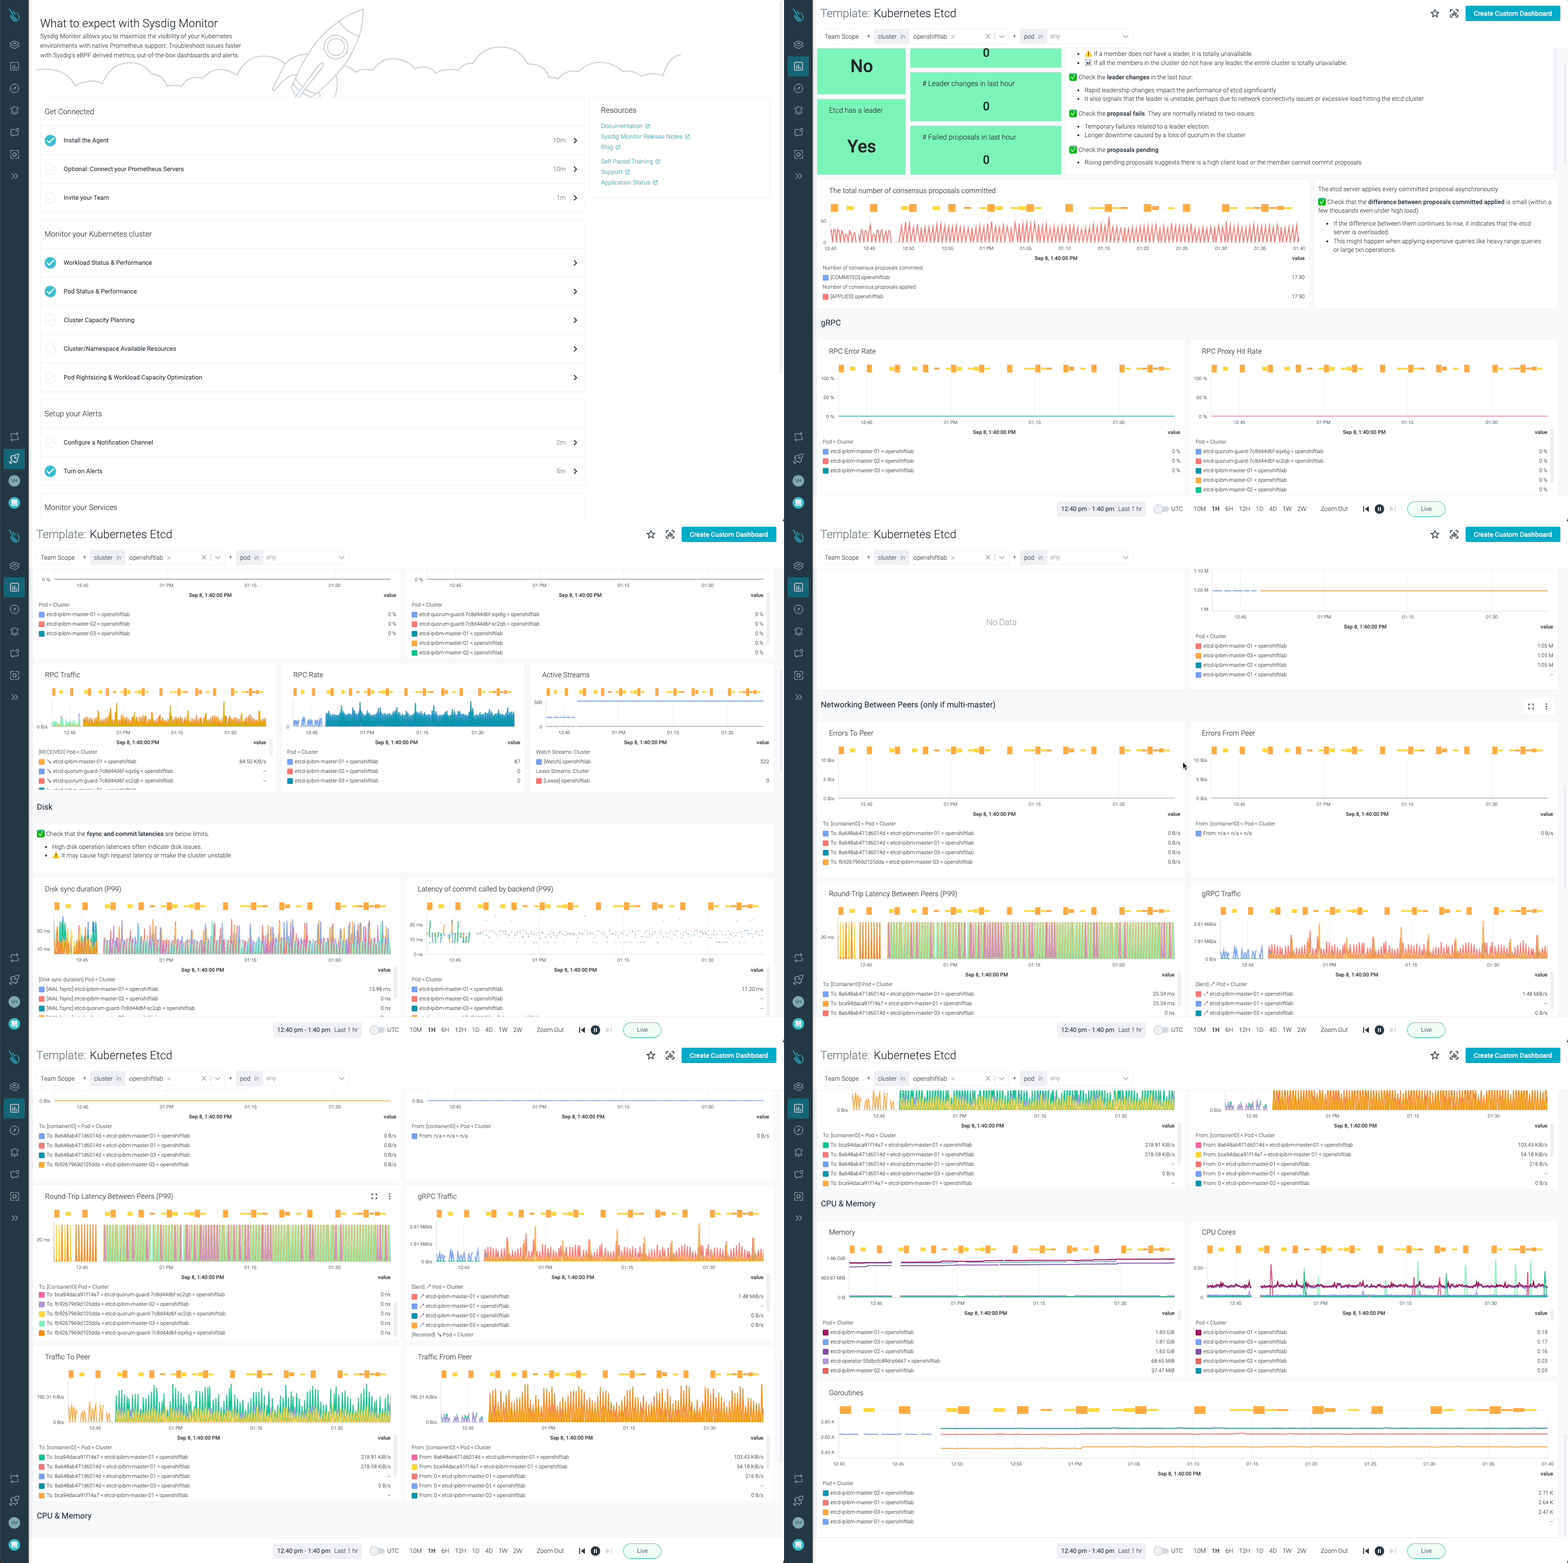
Etcd is one of the most critical components in Kubernetes. Monitoring OpenShift with Sysdig Monitor allows customers to have full visibility on how Etcd is performing.
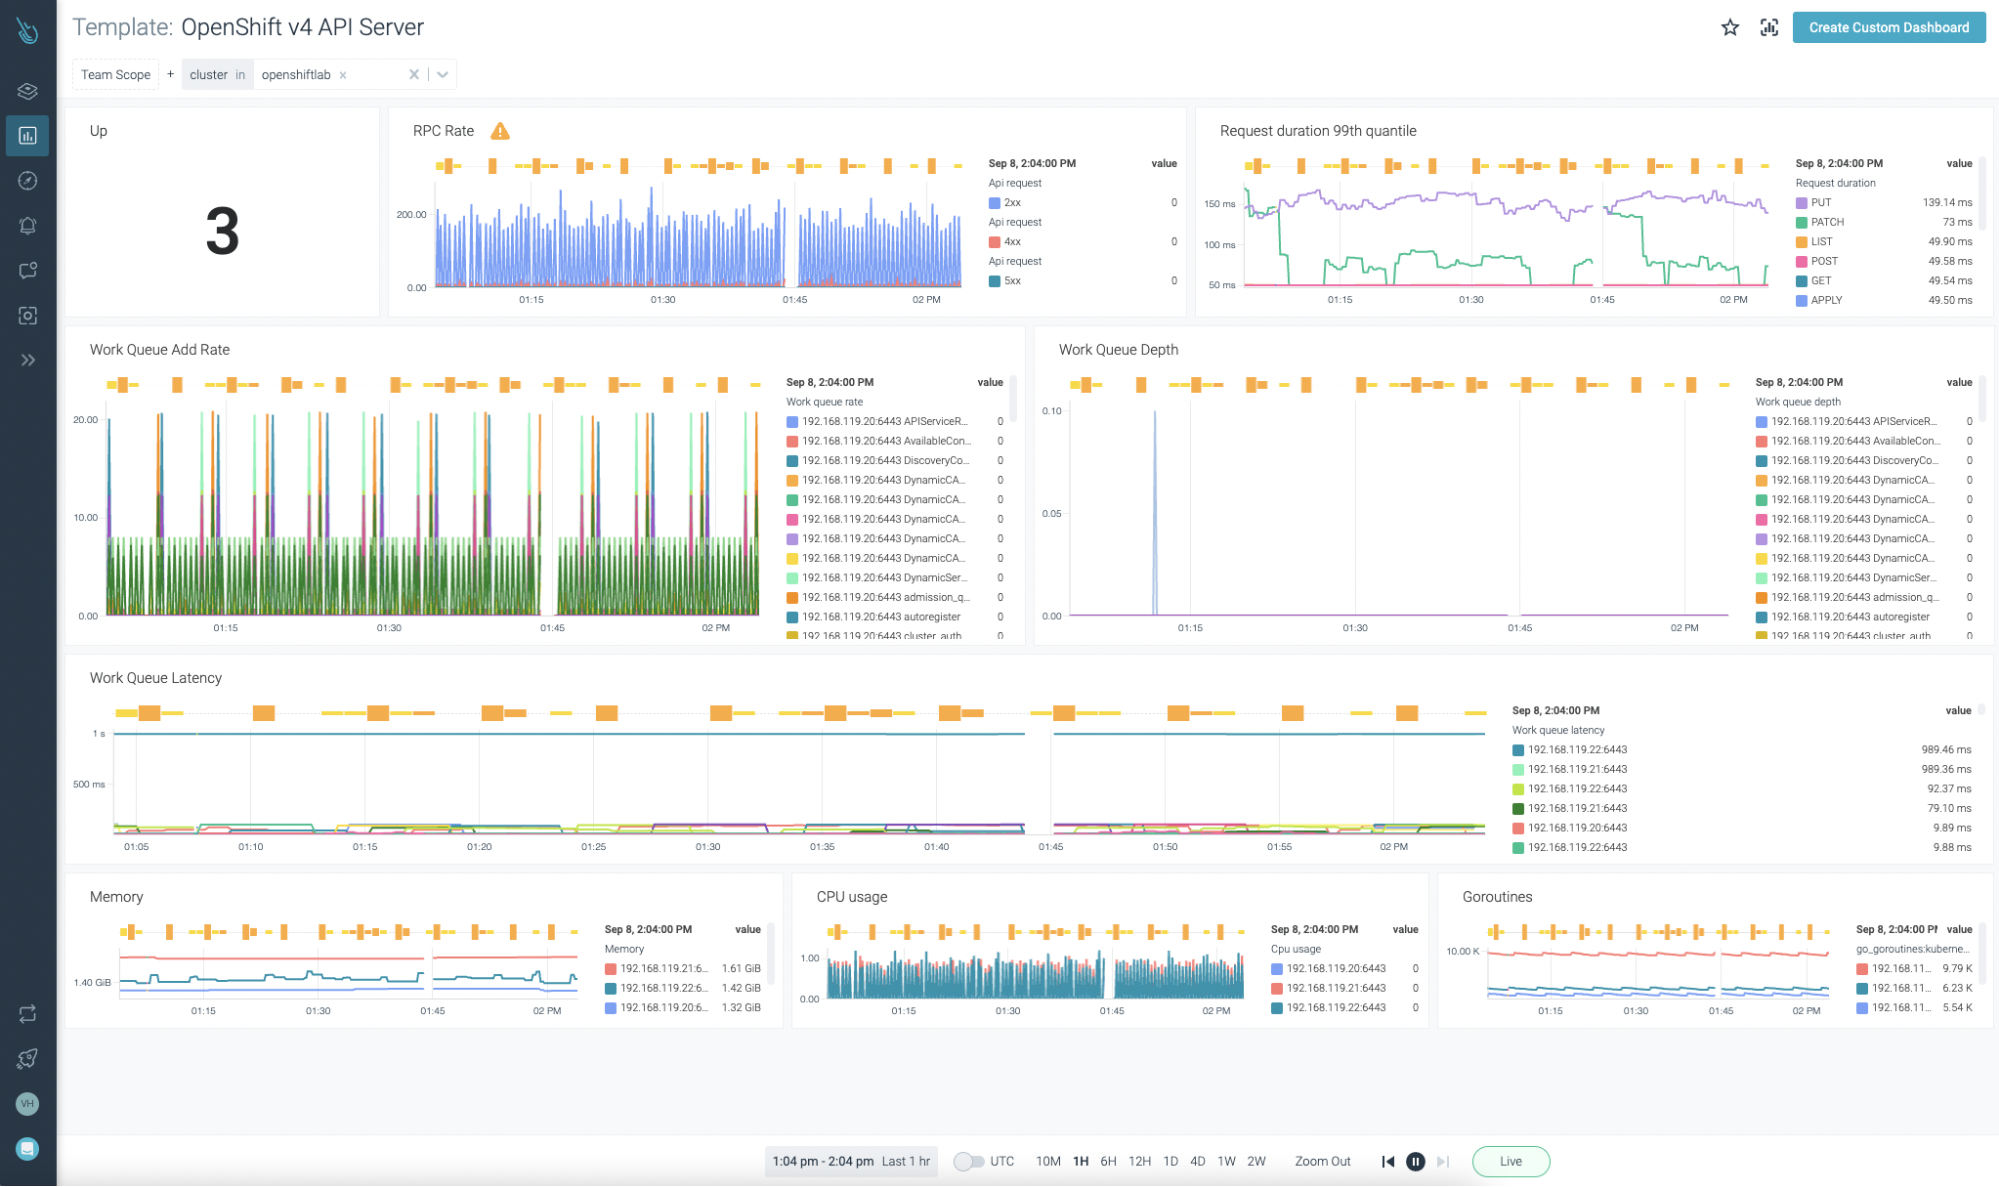
OpenShift API Server, OpenShift Scheduler, and OpenShift Controller can be monitored with the templates provided in Sysdig Monitor. Remember, it is not required to add these new dashboards on your own. As soon as the data coming from the agent is ingested, the dashboards will show up automatically.
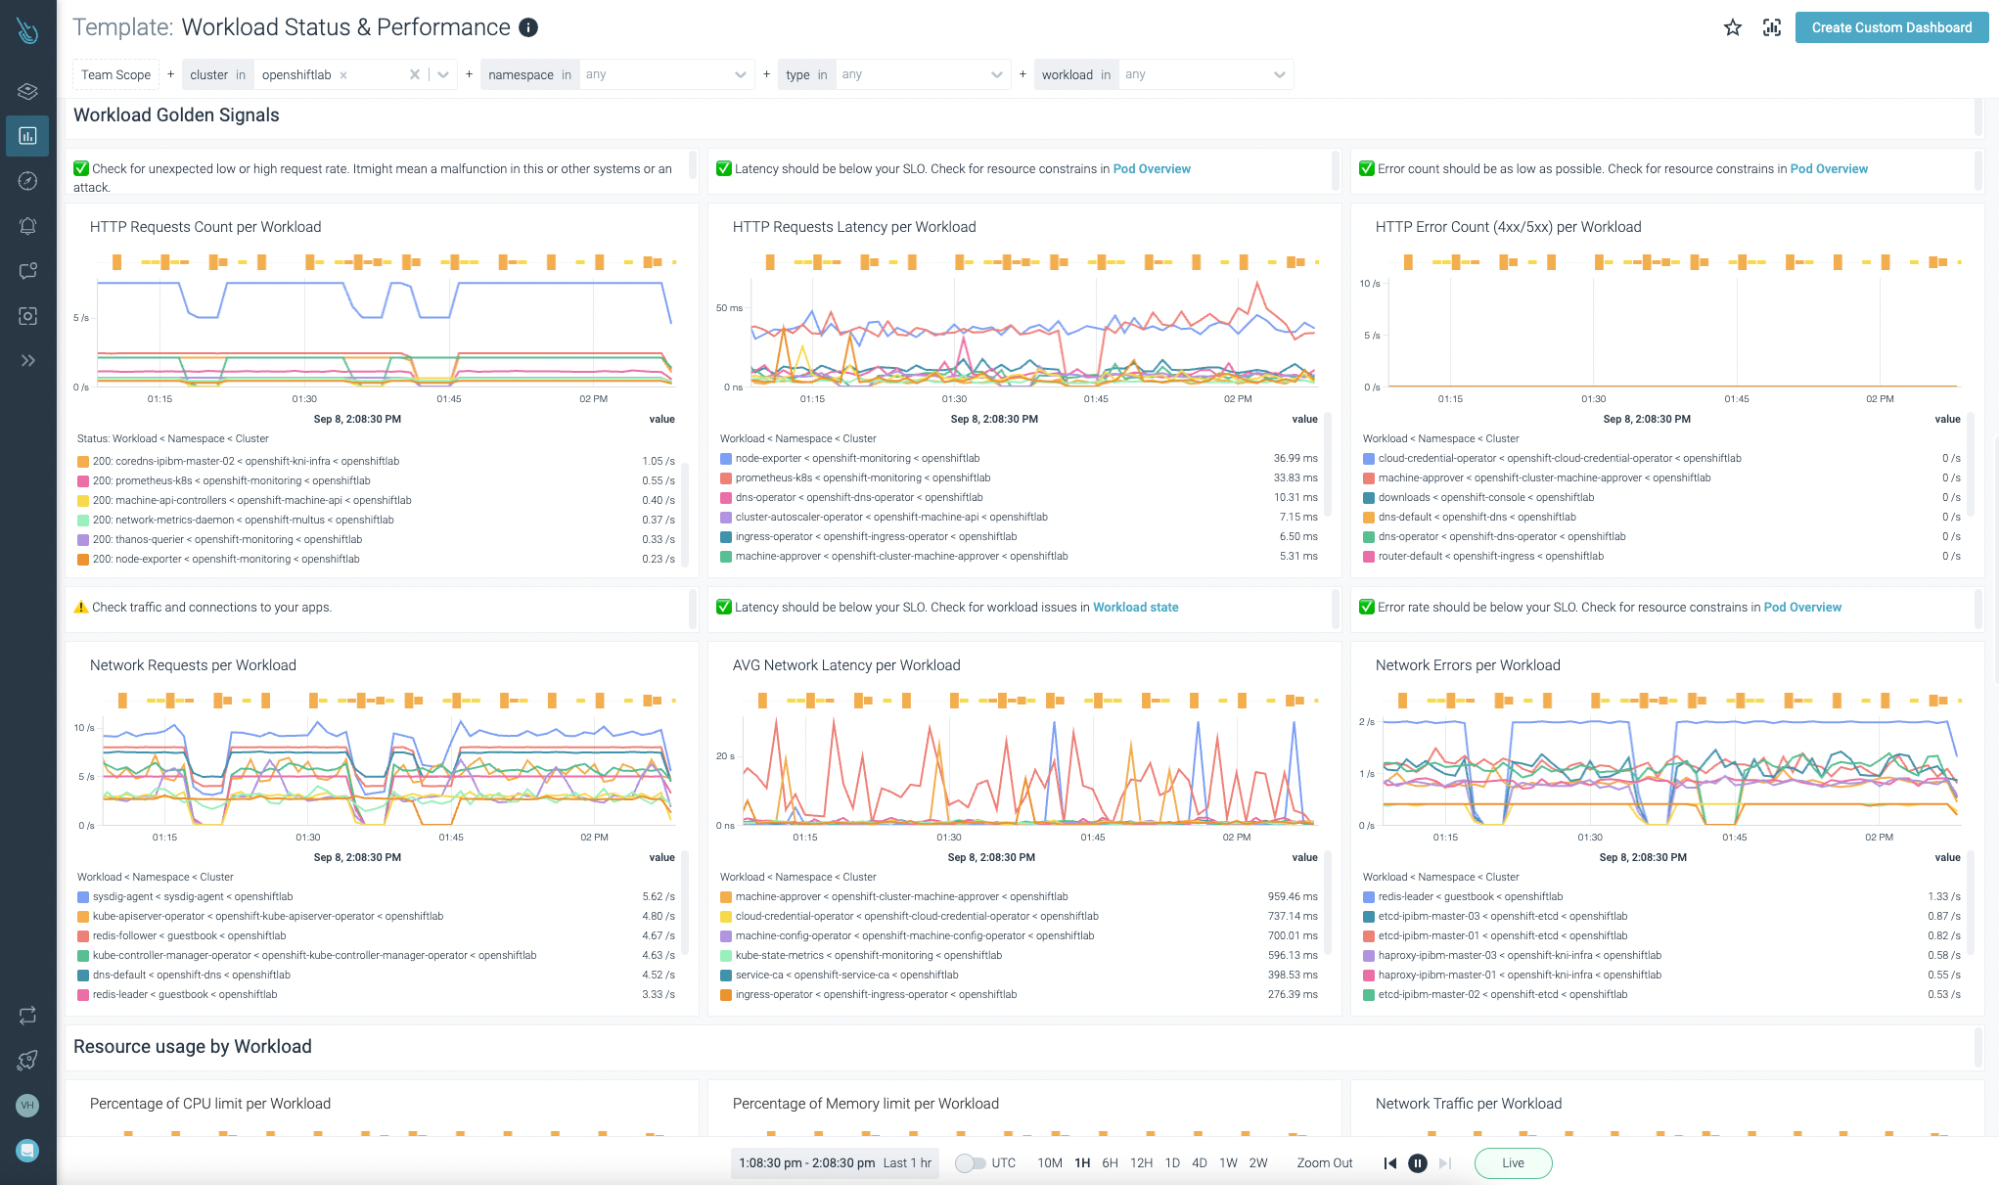
That’s cool! But what about your own workloads and services?
Sysdig Monitor customers don’t need to worry about that. A huge collection of dashboards focused on both Kubernetes control-plane and user workloads/services are provided out of the box.
How to troubleshoot issues in OpenShift with Sysdig Monitor
The Sysdig Agent doesn’t only collect Prometheus time series data, logs, and events as we mentioned in the previous section. Some of the most interesting features consist of processing syscalls events, and creating captures to analyze data and troubleshoot issues in OpenShift.
The Sysdig Advisor feature is included in Sysdig Monitor and helps customers with troubleshooting issues detected in a Kubernetes/OpenShift infrastructure.
Cluster, nodes, namespaces, and workloads status can be checked easily at a glance.
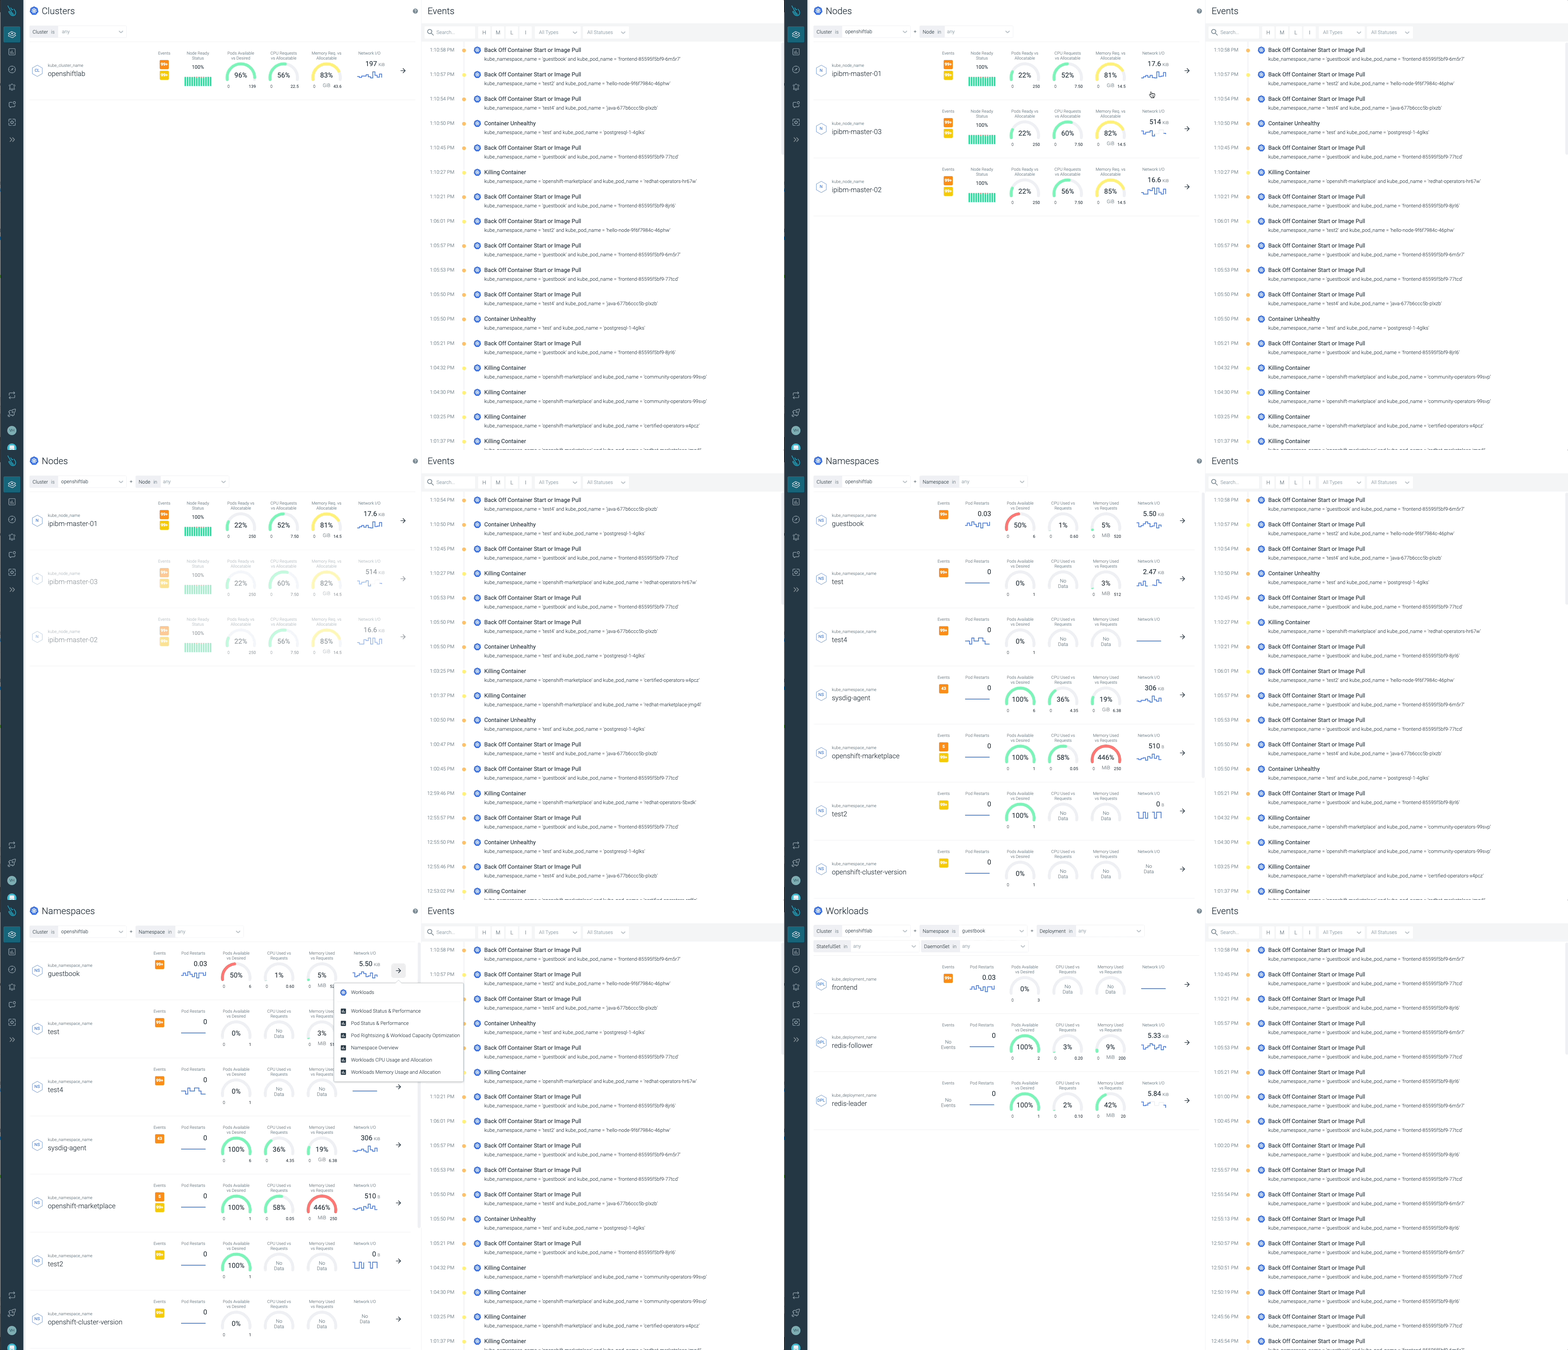
Sysdig Advisor is able to detect certain types of critical issues at a workload level, but not just that. Sysdig Advisor customers can have insights on the frequency of the problem, which containers are involved, how many resources are used, and even a brief explanation on what’s going on and how to fix the issue.
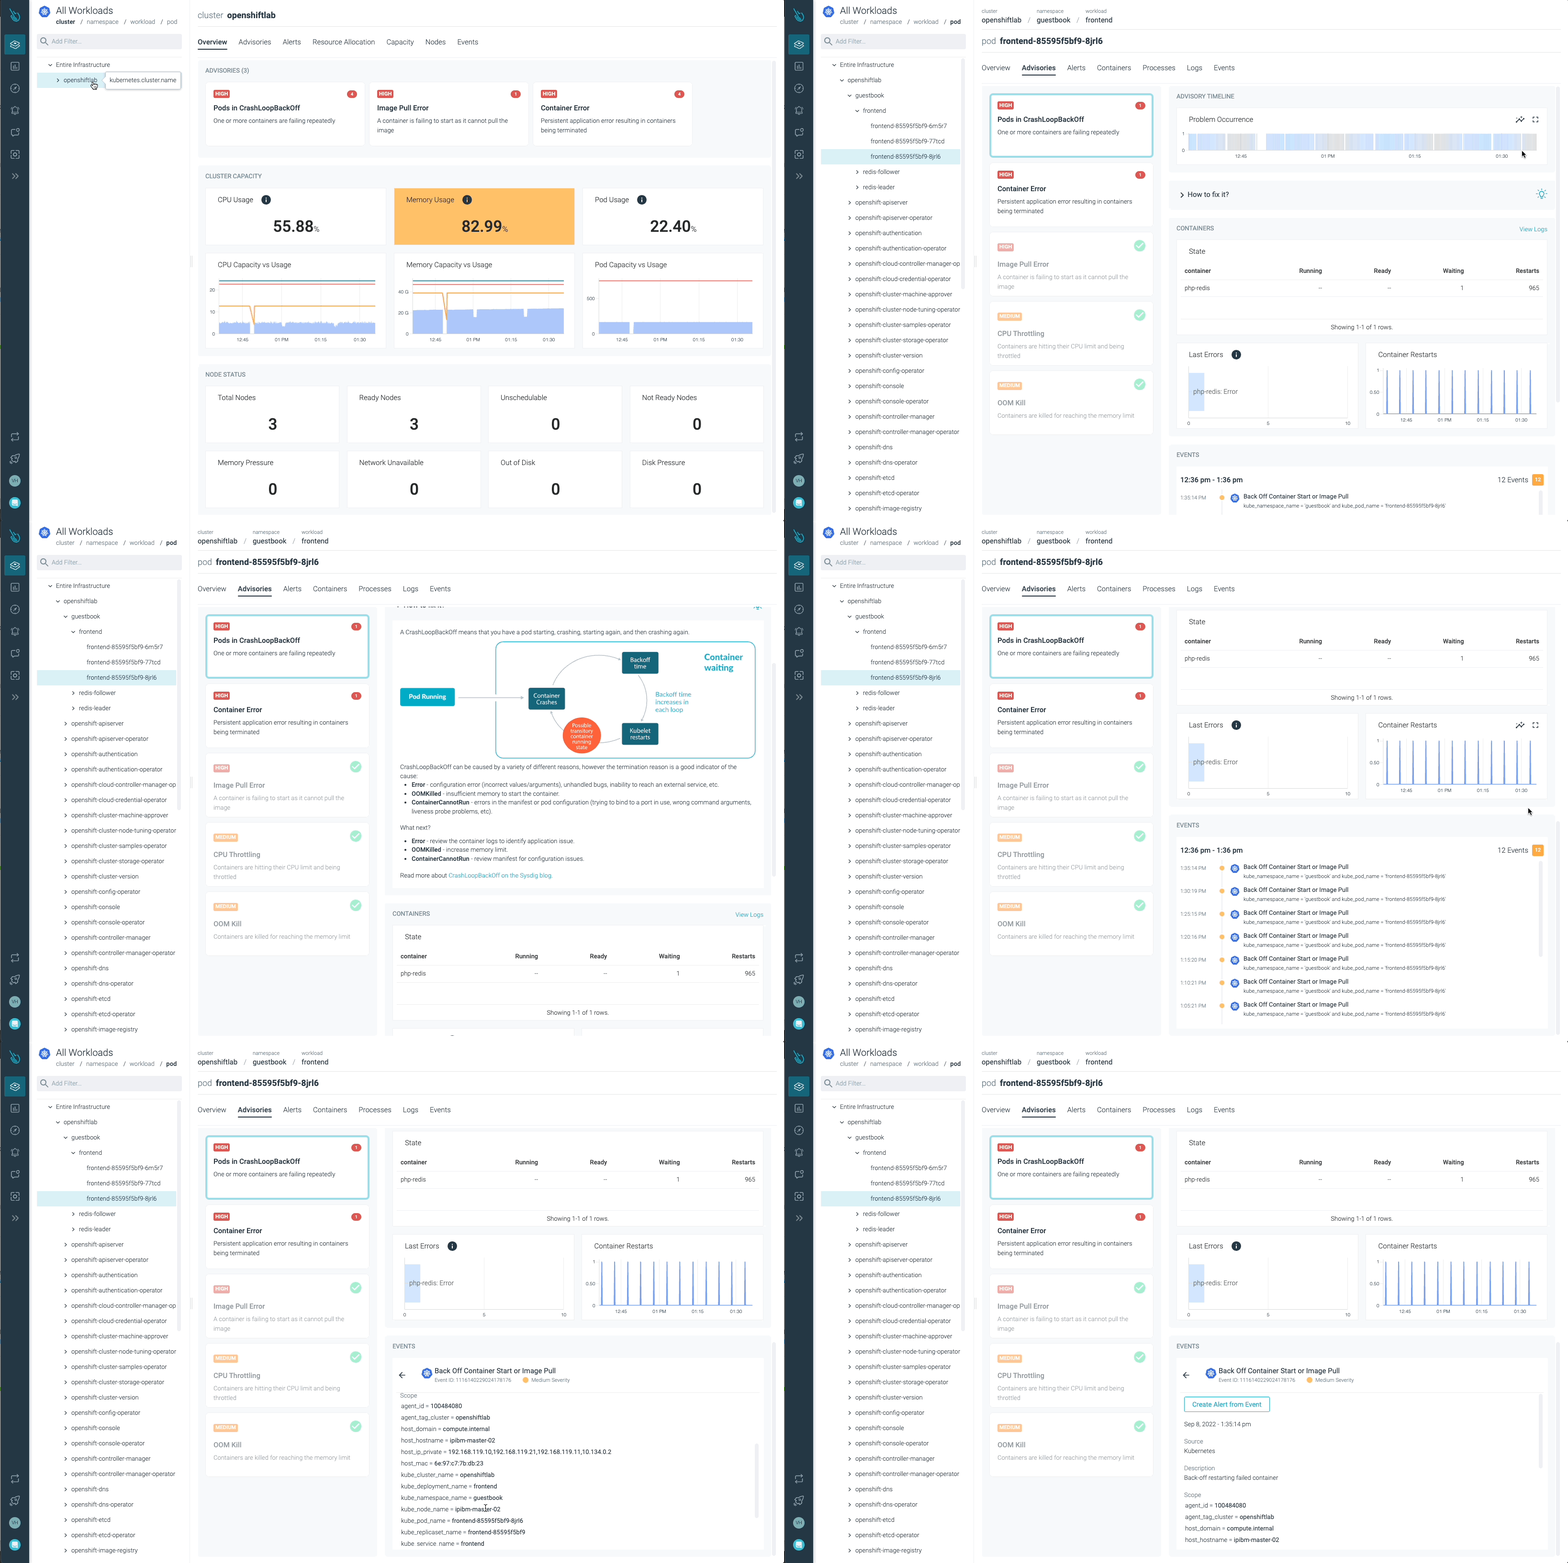
In the previous image, we can see at least one Pod in a CrashLoopBackOff status, and a container that is not able to start (Container Error). Advisor provides important information customers may need (containers involved, events, logs, etc) to diagnose the issue and take the required action.
So far so good, but… How can Sysdig Monitor help me with digging deeper into the real problem? Is that possible? Yes, it is!
Sysdig Monitor is able to capture and analyze container data – all the activity that occurs during a certain lapse of time within the container – as if it was a traffic network capture.
Captures can be collected every time an event is triggered. When a new alert is created capture data option is available, customers can set this feature on demand. Every time a capture is collected it is stored in the Sysdig Monitor storage in the cloud.

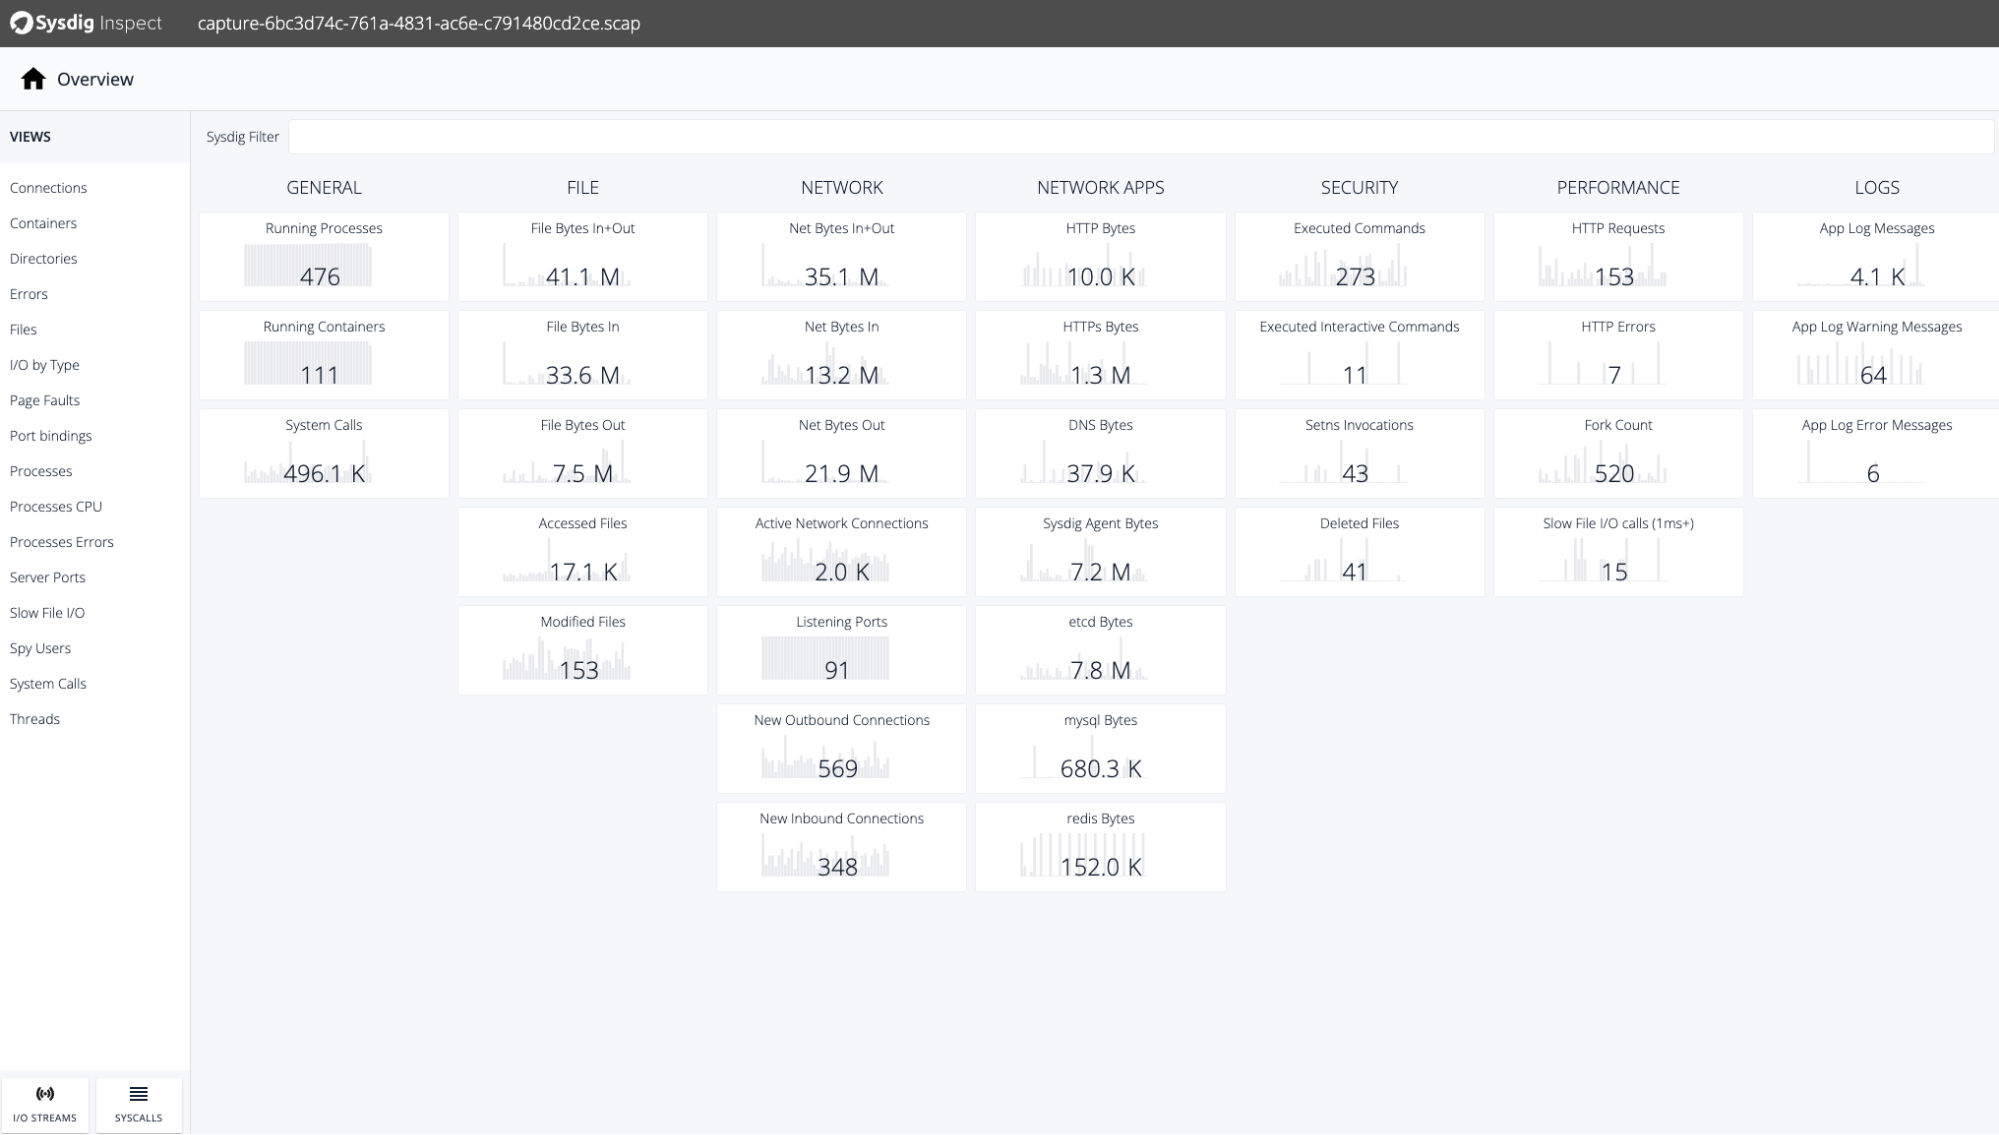
Click on the capture to be analyzed and Sysdig Inspect will show all the data collected straight from the node kernel immediately. This is so impressive!
With all this data, you can check and find the root cause of a problem. Everything you may need to diagnose an issue in a container is in this capture (running processes, network data, files, system calls, etc), collected automatically and stored by Sysdig Monitor for you.
Conclusion
Monitoring OpenShift with Sysdig Monitor provides immediate benefits to organizations from day zero. With no effort, customers have the most complete, robust, agile, and versatile monitoring platform. It is available not only for Kubernetes and OpenShift, but for all the other Kubernetes distributions in any cloud service provider.
Sysdig Monitor offers an easy, fast, and complete OpenShift monitoring solution, able to detect and troubleshoot issues, from the most superficial to the most difficult.
If you want to learn more about how Sysdig Monitor can help you with monitoring and troubleshooting your Kubernetes clusters, visit the Sysdig Monitor trial page and request a 30-day free account. You will be up and running in a few minutes!


