
Falco Feeds extends the power of Falco by giving open source-focused companies access to expert-written rules that are continuously updated as new threats are discovered.

MongoDB is widely regarded as the leading NoSQL database technology. Developers love it because MongoDB is schema-less and it helps them build applications much faster than developing with relational databases, and it scales very well in production. MongoDB also has many features that make it unique from other noSQL databases, including things like geospatial queries and map-reduce operations.Map-reduce is a common pattern when working with Big Data – it's a way to extract info from a huge dataset. But now, starting with version 2.2, MongoDB includes a new feature called Aggregation framework. Functionality-wise, Aggregation is equivalent to map-reduce but, on paper, it promises to be much faster.I thought it might be fun to test this claim ;)So I spent some time utilizing Sysdig Monitor to compare the performance of Aggregate vs map-reduce (read more about Sysdig Monitor new MongoDB support here). The rest of this post will reveal my findings. The process of discovery itself was interesting though, so let's start from the start, and go through it together…
Setup
First of all, I needed some test data for our queries. I can create it using the ruby Faker library. For example, this scripts creates 3 million simulated customer entries:require 'faker'Now let's exclude the script:
require 'mongo'
include Mongo
client = MongoClient.new(ENV['MONGODB'], 27017)
db = client["test"]
collection = db["customers"]
3000000.times do
collection.insert({
:first_name => Faker::Name.first_name,
:last_name => Faker::Name.last_name,
:city => Faker::Address.city,
:country_code => Faker::Address.country_code,
:orders_count => Random.rand(10)+1
})
endMONGODB= ruby filldata.rbAt this point, I can create a script that simulates an app that uses this data to get the sum of the orders grouped by country code:require 'mongo'The collection.aggregate and the collection.map_reduce queries in the script are doing the exactly the same thing, they just leverage a different underlying MongoDB facility.Let's run the script:
include Mongo
client = MongoClient.new(ENV['MONGODB'], 27017)
db = client["test"]
collection = db["customers"]
loop do
collection.aggregate( [
{ "$match" => {}},
{ "$group" => {
"_id" => "$country_code",
"orders_count" => { "$sum" => "$orders_count" }
}
}
])
collection.map_reduce("function() { emit(this.country_code, this.orders_count) }",
"function(key,values) { return Array.sum(values) }", { :out => { :inline => true }, :raw => true});
endMONGODB= ruby query.rbOur servers are already instrumented using Sysdig Monitor's agent. It's a very lightweight agent that listens to all system events, collecting metrics and reporting them back to Sysdig Monitor's services. It can be installed with a single command:curl -s https://s3.amazonaws.com/download.draios.com/stable/install-agent | sudo bash -s
Visualizing MongoDB Activity
Sysdig Monitor is also able to get AWS instance names so I can easily identify our MongoDB server:
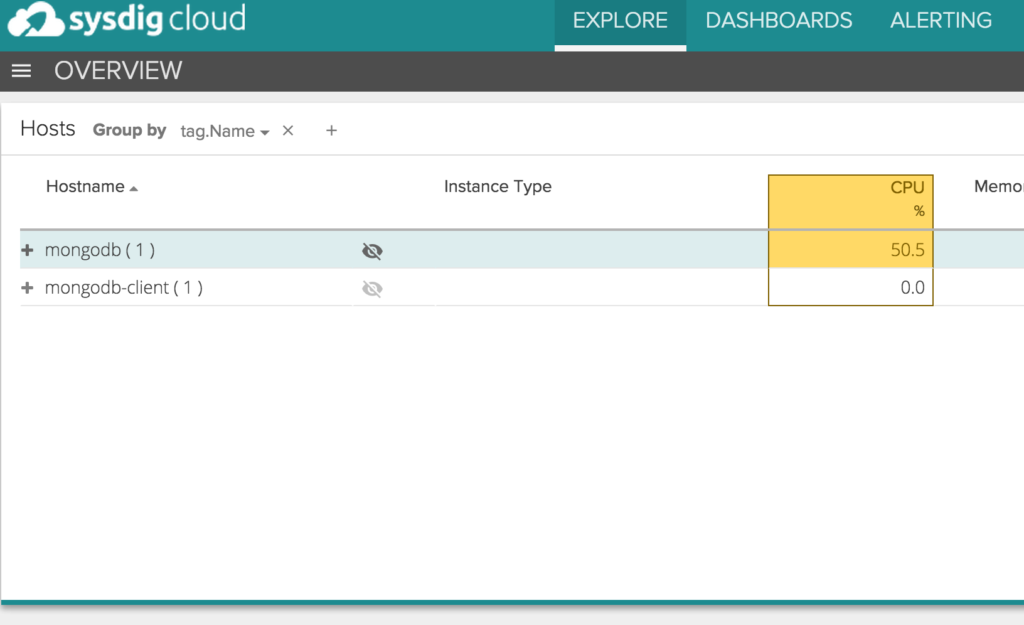
By clicking on it, I'm able to drill down into the rich set of views and metrics that Sysdig Monitor collects with no additional instrumentation. In particular, I'm going to pick the MongoDB Overview view.
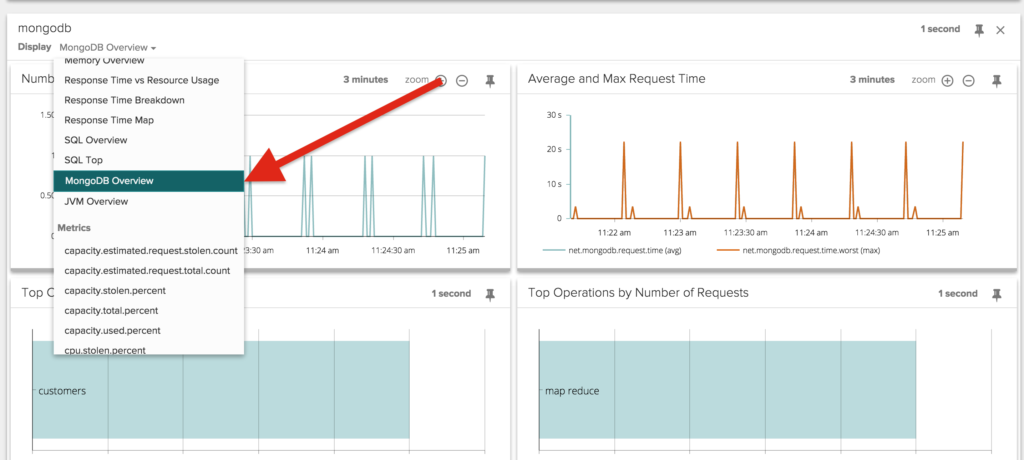
Here's one of the charts in the view:
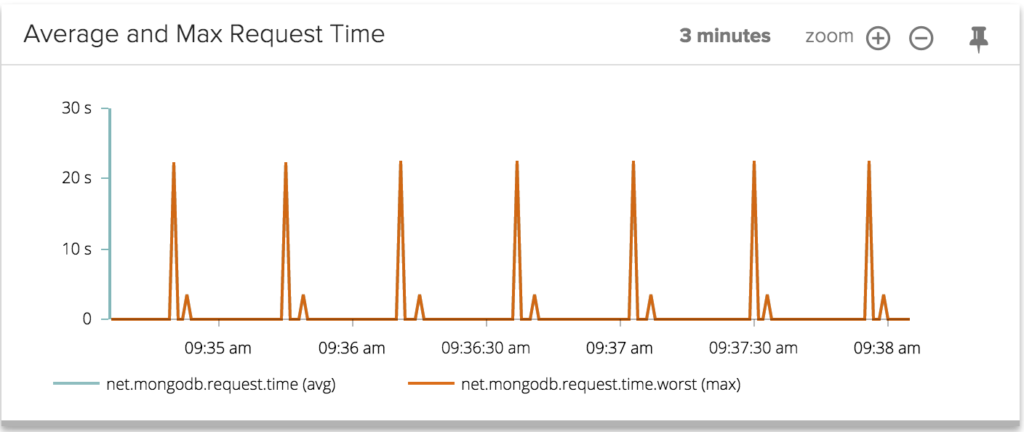
I can clearly see two sets of periodic spikes, with very different magnitude. I bet the higher spikes are generated by the map-reduce queries, while the lower ones are caused by the Aggregate queries. To find out, let's dig deeper by creating a custom chart that shows the MongoDB request time grouped by query type.

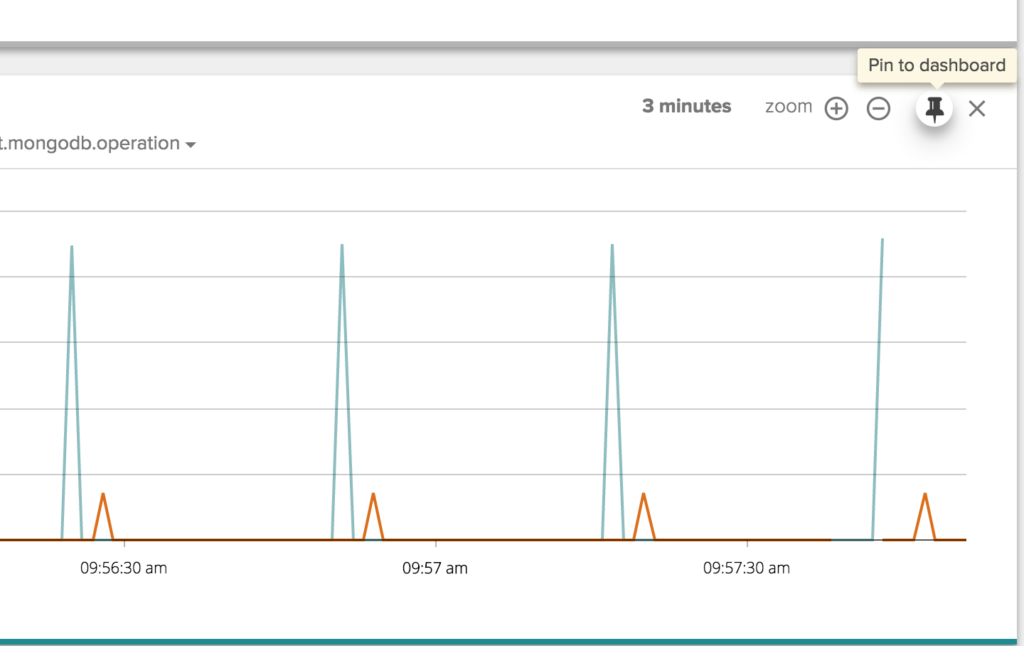
And now let's move this cart into a dashboard.
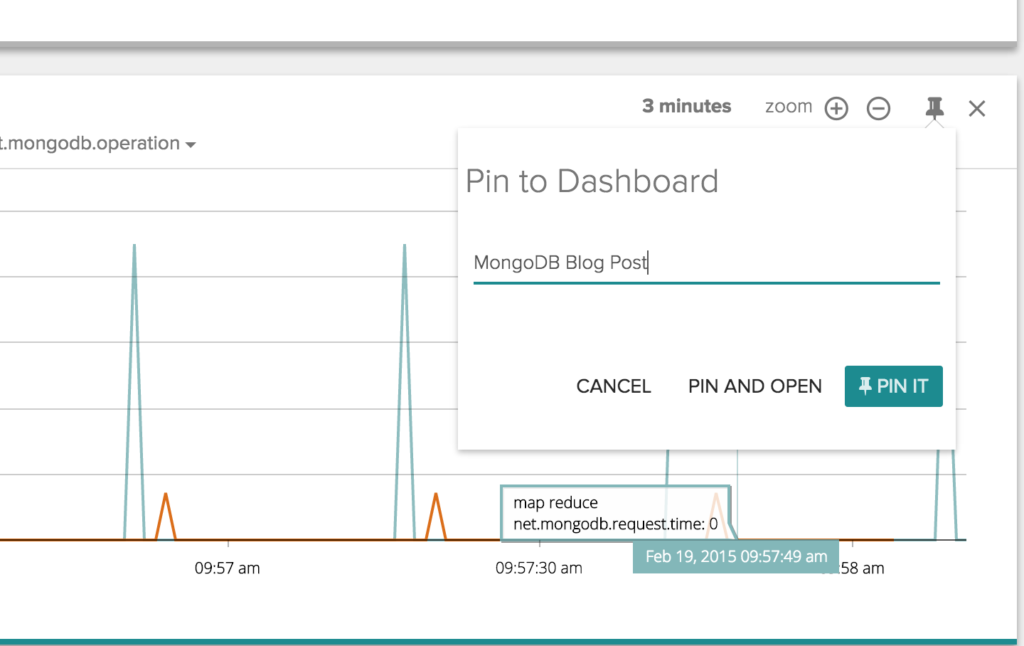
Let's also include a CPU usage chart in the same dashboard, so I can correlate MongoDB activity with CPU usage.With our dashboard opened, I am now going to execute both queries. Let's take a look at the results:
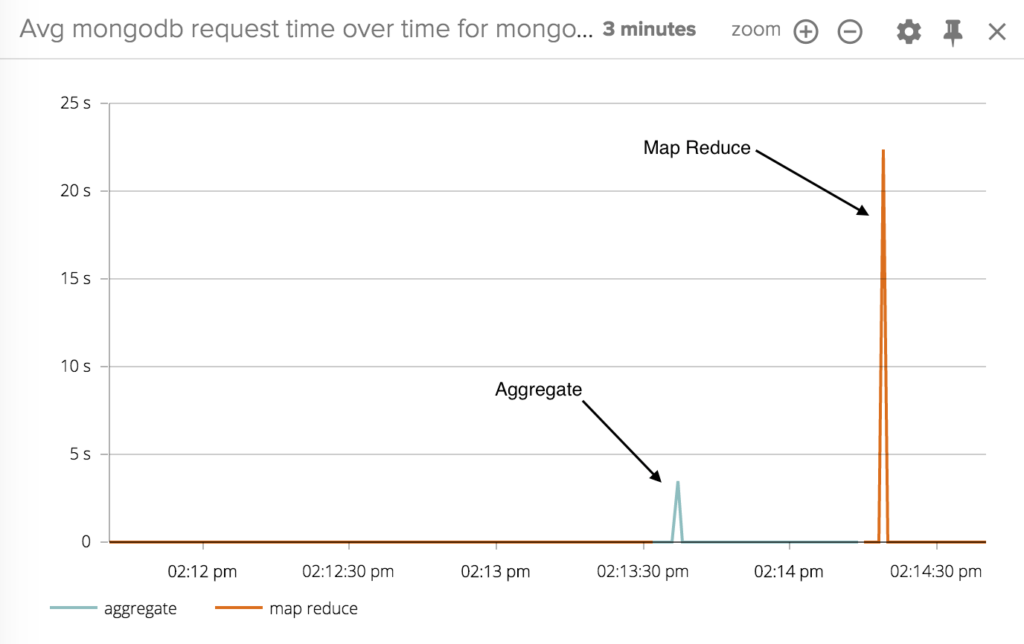
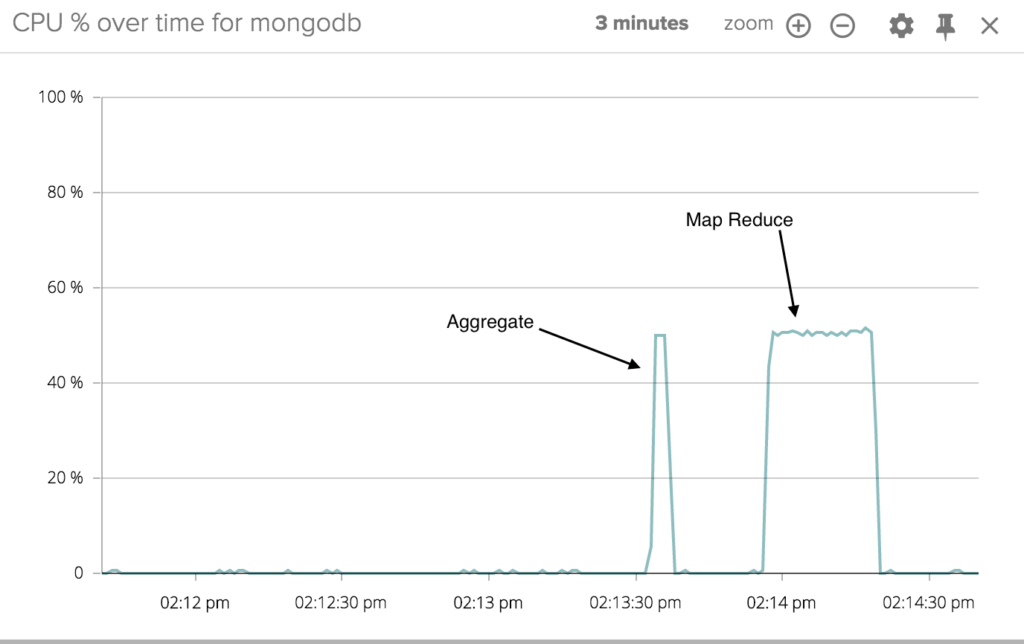
Sysdig Monitor's one-second granularity allows us to very precisely correlate the spikes in CPU utilization with the execution of the queries. You can clearly see that map-reduce uses way more CPU than Aggregate. Also, the duration of the CPU spikes matches quite perfectly with the measured response time, proving that the CPU is used to serve the queries.To better quantify the speed difference I can plot a Top 10 chart with an average on a timespan of 5 minutes. These are the results:
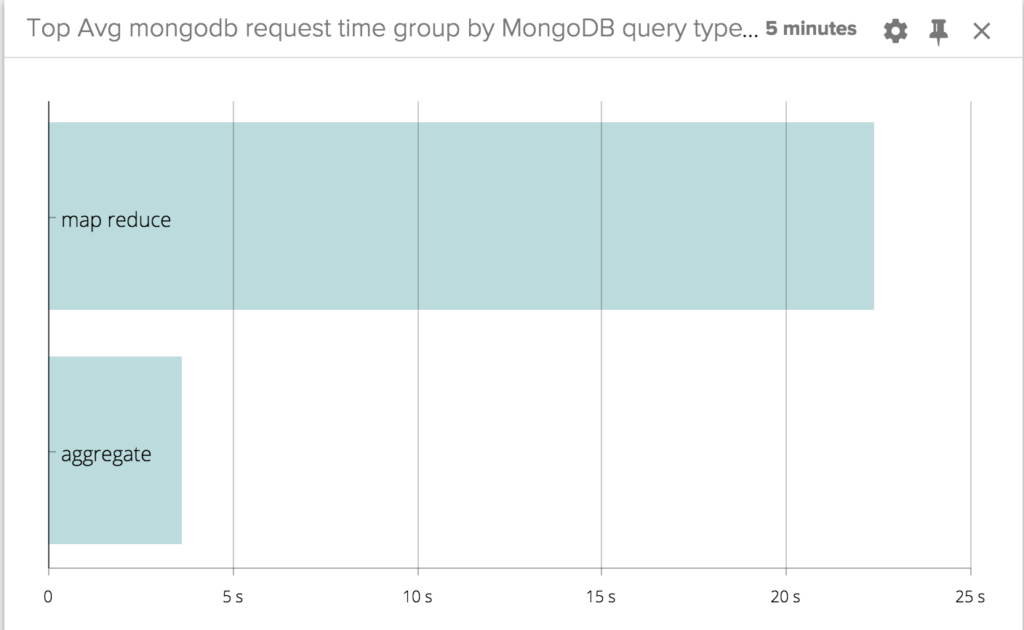
Aggregate is about 6x faster than map-reduce! #Monitoring #MongoDB performance: aggregate is about 6x faster than map-reduce Click to tweet
Conclusion
The obvious conclusion is: if you are sending map-reduce queries to your Mongo backend and are concerned about performance, you should try switching to the Aggregation framework as soon as possible.More importantly: running tests like this can help you and your organization become more data-driven when it comes to making design decisions for your application environment.Curious to see how your own MongoDB deployment performs? Sign up for a 15 days free trial, install the Sysdig Monitor agents, and you'll be running your own MongoDB experiments in just a matter of minutes.


