


Falco Feeds extends the power of Falco by giving open source-focused companies access to expert-written rules that are continuously updated as new threats are discovered.

In Part 1 of A Ceph guide for Kubernetes and Openshift users, we covered:
- Quick Introduction to Ceph and alternatives
- How to Deploy Ceph on AWS
- Other Ceph deployment strategies for Kubernetes and Openshift
While in our second piece we focused on using Ceph as Persistent Volume for Kubernetes or Openshift.Now that we're up and running, we need to talk about how to monitor Ceph. Monitoring and troubleshooting your Ceph storage infrastructure is as important – and arguably more important – as monitoring the containers that your apps run in. Ceph comes with some built-in command line tools for monitoring but Sysdig Monitor can also help you to keep an eye not only on Kubernetes and Openshift but also on Ceph, providing historical and context aware metrics.This final article will cover:
- How to Monitor Ceph with built-in tools
- How to Monitor Ceph with Sysdig Monitor
- Top 5 metrics to monitor in your Ceph cluster
How to Monitor Ceph with built-in tools
Ceph provides built-in monitoring through the command line interface. Our first stop is to check if Ceph health is ok. Running the health command gives us an OK, a warning or error on the overall cluster health status:
$ sudo ceph
ceph> health
HEALTH_OK
but we could also get something like:
ceph> health
HEALTH_WARN 1/3 in osds are down
or
ceph> health
HEALTH_ERR 1 nearfull osds, 1 full osds
osd.2 is near full at 85%
osd.3 is full at 97%
More detailed information can be retrieved with ceph status that will give us a few lines about the monitor, storage nodes and placement groups:
ceph> status
    cluster 3e13cbbe-d9c5-4cd0-b18f-8b349b04ba45
     health HEALTH_OK
     monmap e1: 3 mons at {ip-172-31-17-113=172.31.17.113:6789/0,ip-172-31-17-75=172.31.17.75:6789/0,ip-172-31-20-164=172.31.20.164:6789/0}
            election epoch 4, quorum 0,1,2 ip-172-31-17-75,ip-172-31-17-113,ip-172-31-20-164
     osdmap e15: 3 osds: 3 up, 3 in
            flags sortbitwise,require_jewel_osds
      pgmap v65: 104 pgs, 6 pools, 1588 bytes data, 171 objects
            106 MB used, 76653 MB / 76759 MB avail
                 104 active+clean
We can see here (for each line): 1) cluster ID 2) cluster health status 3-4) monitor map and status of monitor quorum 5-6) OSD map and status of OSD nodes 7-9) placement groups, pools, objects and capacity usage used is the raw storage used (including replicas and snapshots) while xxx MB / xxx MB is the available storage from the total capacity.When looking at your placement groups status, you want them to be active and clean. You can see more details of PG with the pg dump command.To know what the OSD nodes are doing, we have a few different options:
ceph> osd stat
     osdmap e15: 3 osds: 3 up, 3 in
            flags sortbitwise,require_jewel_osds
and
ceph> osd tree
ID WEIGHT  TYPE NAME                 UP/DOWN REWEIGHT PRIMARY-AFFINITY
-1 0.07320 root default
-2 0.02440     host ip-172-31-24-236
 0 0.02440         osd.0                  up  1.00000          1.00000
-3 0.02440     host ip-172-31-29-248
 1 0.02440         osd.1                  up  1.00000          1.00000
-4 0.02440     host ip-172-31-30-149
 2 0.02440         osd.2                  up  1.00000          1.00000
An OSD (object storage daemon) is a node with storage capacity. If you have configured some redundancy (probably you have) multiples copies will be stored across different nodes for data resilience. OSD server status can be either:
- Up: the node (daemon) is running and responding
- Down: the node is either stopped or not responding, other OSD or MON nodes didn't receive any heartbeats from that node
In parallel we have other two statuses for OSD nodes:
- In: the node participates in data placement
- Out: the node does NOT participate in data placement
To protect the cluster from continuously rebalancing data when experiencing a short failure, a node can be in but down at the same time. Will take 5 minutes by default to change into out status .Similar commands exist for the monitor nodes:
ceph> mon stat
e1: 3 mons at {ip-172-31-17-113=172.31.17.113:6789/0,ip-172-31-17-75=172.31.17.75:6789/0,ip-172-31-20-164=172.31.20.164:6789/0}, election epoch 4, quorum 0,1,2 ip-172-31-17-75,ip-172-31-17-113,ip-172-31-20-164
Monitoring the cluster capacity and data distribution across the different pools we can use the df command:
ceph> df [detail]
GLOBAL:
    SIZE       AVAIL      RAW USED     %RAW USED
    76759M     76653M         106M          0.14
POOLS:
    NAME                      ID     USED     %USED     MAX AVAIL     OBJECTS
    rbd                       0         0         0        25551M           0
    .rgw.root                 1      1588         0        25551M           4
    default.rgw.control       2         0         0        25551M           8
    default.rgw.data.root     3         0         0        25551M           0
    default.rgw.gc            4         0         0        25551M          32
    default.rgw.log           5         0         0        25551M         127
Or by OSD node:
ceph> osd df
ID WEIGHT  REWEIGHT SIZE   USE    AVAIL  %USE VAR  PGS
 0 0.02440  1.00000 25586M 35380k 25551M 0.14 1.00 104
 2 0.02440  1.00000 25586M 35256k 25552M 0.13 1.00 104
 1 0.02440  1.00000 25586M 35252k 25552M 0.13 1.00 104
              TOTAL 76759M   103M 76656M 0.13
MIN/MAX VAR: 1.00/1.00  STDDEV: 0
We cannot miss looking at the I/O metrics, latency and reads/writes both in ops per second and bandwidth using osd perf:
ceph> osd perf
osd fs_commit_latency(ms) fs_apply_latency(ms)
  2                    41                   55
  1                    41                   58
  0                   732                  739
ceph> osd pool stats
pool rbd id 0
  nothing is going on

pool .rgw.root id 1
  nothing is going on

pool default.rgw.control id 2
  nothing is going on

pool default.rgw.data.root id 3
  nothing is going on

pool default.rgw.gc id 4
  nothing is going on

pool default.rgw.log id 5
  nothing is going on

pool scbench id 6
  client io 33649 kB/s wr, 0 op/s rd, 8 op/s wr
If you are interested in reading more about troubleshooting and performance in Ceph we recommend checking out Troubleshooting OSDs in the Ceph documentation, and to check out setup limits read Benchmark Ceph Cluster Performance.
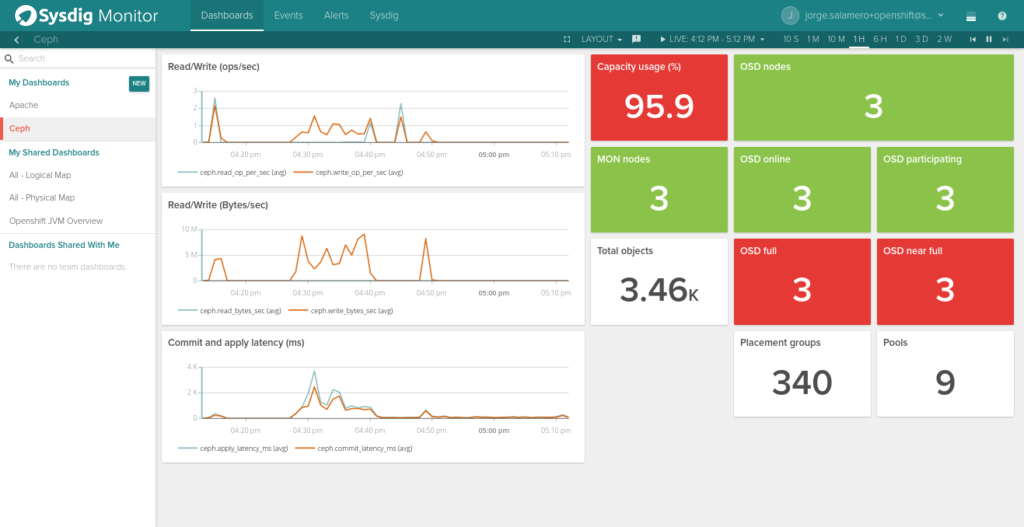
How to Monitor Ceph with Sysdig Monitor
To retrieve Ceph metrics and send them to Sysdig Monitor you just need to have a Sysdig Monitor agent running in one of the monitor nodes but since any node can go down at any point in time in a highly available cluster, we recommend installing Sysdig Monitor agent in all of them, as will also help to collect system level metrics specific of that host. Sysdig uses an auto-discovery mechanism to figure out that Ceph is running, and extract the correct metrics with no human intervention.The default configuration will check if a ceph-mon process (the Ceph Monitor software) is running and will collect the following metrics:
Ceph Cluster Performance Metrics
- ceph.commit_latency_ms: Time in milliseconds to commit an operation
- ceph.apply_latency_ms: Time in milliseconds to sync to disk
- ceph.read_bytes_sec: bytes/second read
- ceph.write_bytes_sec: bytes/second written
Ceph Cluster Availability Metrics
- ceph.num_osds: number of discovered OSD nodes
- ceph.num_in_osds: number of participating OSD nodes
- ceph.num_up_osds: number of reachable OSD nodes
- ceph.num_near_full_osds: number of OSD nodes near full storage capacity
- ceph.num_full_osds: number of OSD nodes in full storage capacity
- ceph.osd.pct_used: percentage of OSD nodes in near full or full storage capacity
- ceph.num_pgs: number of placement groups available
- ceph.num_mons: number of monitor nodes available
- ceph.aggregate_pct_used: percentage of storage capacity used
- ceph.num_pools: number of pools
- ceph.total_objects: number of objects
Per pool metrics
- ceph.op_per_sec: Operations per second
- ceph.read_bytes: Counter of read bytes (to be used with Rate function)
- ceph.write_bytes: Counter of written bytes (to be used with Rate function)
- ceph.read_op_per_sec: bytes/second read
- ceph.write_op_per_sec: bytes/second written
- ceph.num_objects: number of objects
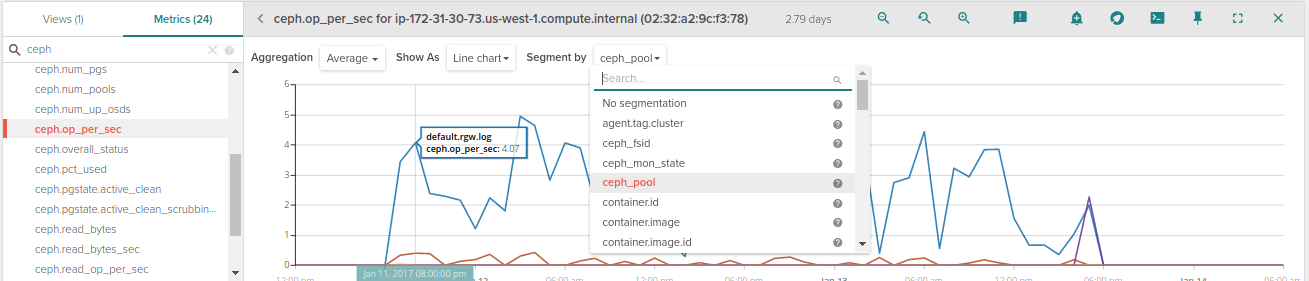
In addition, Sysdig automatically applies metadata tags from Kubernetes, OpenShift, AWS and more to each and every metric. This means you can aggregate and segment data across deployments, pods, datacenters, and more with a couple clicks. For example, if you want to see operations per second for each pool you just need to select ceph.ops_per_second and segment by ceph_pool.To complete the monitoring setup, we recommend creating at a minimum the 5 alerts we recommend below. Here's a quick example of creating a health != OK across all Ceph storage nodes in the system:
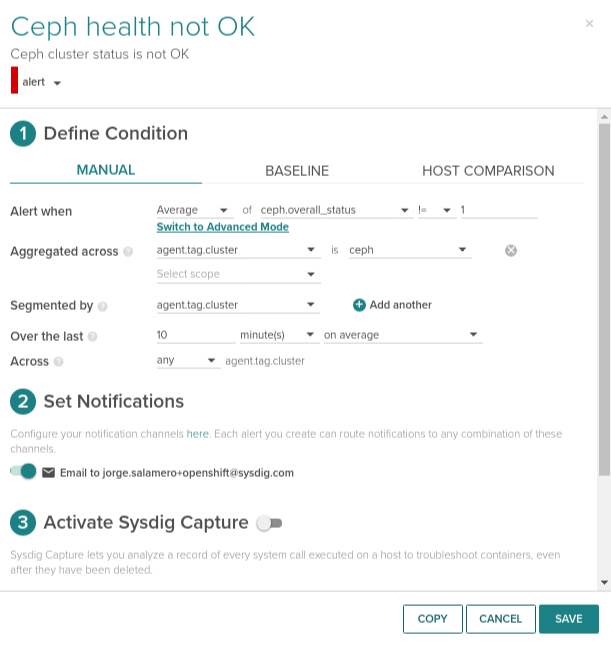
This example allows you to set one alert and have it apply across each Ceph node you're running. This is particularly useful in orchestrated environments, where you system may be spinning up additional Ceph nodes as needed. In this case, we collect the ceph.overall_status across all the Monitor nodes as these can scale up or down. If the alert triggers, we will only send one alert and not an alert for each of the node.
Top 5 Metrics to Monitor in Your Ceph Cluster
Once we have deployed our Ceph cluster, before moving things into production we need to make sure there is some alerting in place.
"There isn’t one rule that fits all scenarios, but these are 5 common alerts that you may want to configure to monitor your Ceph cluster"
1. When health status != OK
If you were going to set up one alert only, this would be it. It brings your attention to where the cluster is not operating normally. You can have your own variations here triggering with a lower priority alert when status is Warning and a higher priority alert when status is Error. Use the ceph.overall_status metric in Sysdig Monitor for configuring this alert.
2. When online monitor nodes doesn't reach quorum
If the number of monitor nodes is less than half plus one, we will end up having a deadlock. Use the ceph.num_mons metric in Sysdig Monitor for this alert.
3. OSD nodes down but in
If OSD nodes that are down but still appear as participating and they remain in that status for more than 5 minutes, Ceph is probably having issues recovering from the node loss. Use ceph.num_osds, ceph.num_in_osds and ceph.num_up_osds metrics in Sysdig Monitor for alerting when this happens.
4.-Reaching full capacity
Either the whole cluster is reaching full capacity or some nodes are near full or full but overall cluster is not. Reasons the later case can be a significant change in the topology or a problem with the CRUSH maps. Use ceph.aggregate_pct_used and ceph.num_full_osds/ceph.num_near_full_osds metrics in Sysdig Monitor for monitoring these cases.
5.Be on time
On distributed systems clock skews are often an unexpected source of issues. Ceph monitors will allow clocks to drift up to 0.05 seconds. Set up some NTP monitoring and keep an eye on NTP offset metric.
Conclusion: Ceph Monitoring
Ceph provides powerful storage infrastructure, and with a little extra work you can ensure that it's running properly and with high performance. After seeing the above options, you may be wondering, What approach should I take to monitoring Ceph? Here's an easy framework to think about it:If you're running a small ceph cluster for a prototype, experiment, or non-critical application, we suggest using Ceph's built-in monitoring tools. They provide sufficient data, though no ability to trend or alert on issues you might see.If, however, you're running Ceph as part of your production application, you probably want to consider something more robust. You'll need a centralized monitoring tool that will allow you to trend and alert not only on Ceph, but also on the rest of your infrastructure.Please feel free to sign up for a trial of Sysdig to see it for yourself!