


Falco Feeds extends the power of Falco by giving open source-focused companies access to expert-written rules that are continuously updated as new threats are discovered.

Editor's note: This is a guest blog post written by Donatas Abraitis, an active sysdig community member and contributor, describing some of his work that has been introduced in the latest versions of sysdig and csysdig. Thank you Donatas!
\r\r\r\r
Among other features, the latest release of sysdig includes two new features that I created initially for my own use, and that I'm happy to be able to share with the sysdig community: 1. A csysdig view to monitor socket queues occupation 2. A sysdig chisel called memcachelog which visualizes memcache activity
\r\r
Open source sysdig is highly extensible, and with such a rich pool of data to work with, I think the possibilities are really endless. If you're interested in creating some custom functionality yourself, I suggest you check out the sysdig wiki for more info.
\r\r
In this blog post, I'm going to cover the two new features mentioned above, including some usage information and a couple of tips.
\r\r
Monitoring Socket Queues
\r\r
When monitoring servers, especially in production, a very useful metric to visualize is the current backlog (ie. queue) for services. This is the number of requests that have been received by the system, but that are still sitting in the network stack queues waiting to be "accepted" by the server (e.g. Apache, Nginx, MySQL, etc.). Ideally, you want this number to be zero or close to zero for your servers. You also want to keep an eye on it, because growing values mean increased latency, higher memory usage and, potentially, dropped to connections if the queue limit is reached1.
\r\r
Here's the challenge though: Linux doesn't make it easy to retrieve backlog utilization, requiring you to dig into the kernel's sock structure (precisely to sk_ack_backlog and sk_max_ack_backlog).
\r\r
My new patch to the sysdig driver now allows sysdig to extract and export the maximum and current backlog value. A corresponding csysdig view renders the information on screen in an easy to consume interface.
\r\r
A quick exampl: this new feature proved useful for me in tuning the capacity of my MySQL server. Before sysdig, my only option was to inspect MySQL's configuration file and hope that the values there were satisfactory. Now I'm able to monitor queue occupation in real time, and use that information to tune the configuration. I can decide whether to increase my max connection count or no. In addition, when the service becomes unresponsive, checking the current queue size lets me understand if the cause is the server being hammered by too many connections or by something like a DDoS.
\r\r
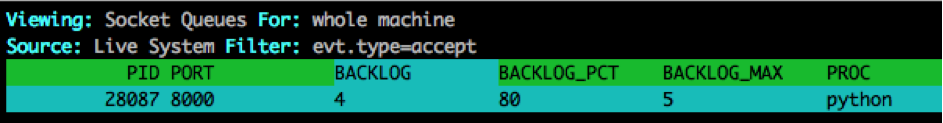
Let's me show you what this new view actually looks like. To simulate full backlog, I'm going to use a simple python web server with maximum connection count as 5. In another console I'm running the ab tool to overload this server with many concurrent connections.
\r\r
In a third console, I'm going to use sysdig with the following command line:
\r$ sudo csysdig -v backlog
\rAnd this is the output:
\r\r

\r\r
This tells that the current queue is almost full (4 / 5) – that's 80% busy. And in fact my server is dropping connections. Note how the view also reports the name and the PID of the server process, making it easy to understand the bottlenecks in a multi-server machine.
\r\r
memcached monitoring
\r\r
By default, memcached has a maximum object size of 1Mb. When this size is reached, the client will see: SERVER_ERROR object too large for cache.
\r\r
The new chisel \r\r
Here's an example:
\r\r
$ sudo sysdig -c memcachelog
\r2015-09-24 07:31:54.862025235 method=set size=2528B key=f0acaa92:user_settings.by_user.449061
\r2015-09-24 07:31:54.862964618 method=get size=0B key=f0acaa92:apps.x.6
\r2015-09-24 07:31:54.863327632 method=get size=0B key=f0acaa92:member.logoff.194959
\r\r
The chisel behavior can be customized through a couple of command line arguments. For example, you can show just get requests only through this command line:
\r\r
$ sysdig -c memcachelog get
\r2015-09-24 07:37:12.135899956 method=get size=0B key=f0acaa92:apps.x.6
\r2015-09-24 07:37:12.133402962 method=get size=0B key=f0acaa92:json_search.data.x
\r\r
Note that Size is 0, because size is specified in set requests only.
\r\r
This command line on the other hand accepts only set requests that have a size of more than 1Mb:
\r\r
$ sysdig -c memcachelog 'set 1048576'
\r2015-09-24 12:41:02.513934659 method=set size=1702608B key=0aaaba6b:common_texts.de
\r\r
As you see in this example above, there is an object with size of 1.7Mb, so the client receives SERVER_ERROR every time, even if this error isn't handled. Useful to know!
\r\r
Conclusion
\r\r
Extensibility is one of the most interesting features in sysdig. I was able to leverage the sysdig APIs to create these two handy tools with very little effort – it's actually quite fun!. I hope that these enhancements can be useful to you too, and I hope you'll try making a chisel or csysdig view of your own.
\r\r\r\r
1 If you are interested in the details: this limit varies from server to server, and is defined by the backlog argument when the server calls listen(). When a connection is created, sk_acceptq_added() increments the backlog value, while sk_acceptq_removed() decrements it. When the three way handshake completes (which means a valid synack was received) tcp_v4_syn_recv_sock() checks if listen() queue is full (sk_ack_backlog > sk_max_ack_backlog):
\r\r
401 if (sk_acceptq_is_full(sk))
\r402 goto exit_overflow;
\r\r
If the queue is full, the packet is dropped, memory is freed and the drop connection counters is increased.