No pain… More gain! Sysdig Monitor radically simplifies monitoring integrations based on open source


Falco Feeds extends the power of Falco by giving open source-focused companies access to expert-written rules that are continuously updated as new threats are discovered.

Monitoring services and applications in just a few clicks – that's the dream of every SRE and developer, but this is very difficult because most applications don't expose metrics in a standardized format.\r
\rThis article will introduce the current pros and cons of the Prometheus exporters ecosystem and how we leveraged the power of the open-source exporters in Sysdig to radically simplify the user experience to allow you to monitor your applications in just a few clicks.\r
\r\r
Finding the right exporter
\r
\rFirst of all, why use Prometheus exporters? Because we love open source! Embracing the Prometheus ecosystem removes the vendor lock-in that other monitoring platforms have with their custom scripts and solutions. After all, you can always use your own Prometheus to get metrics from the exporters.\r
\r
\rSome services are instrumented natively, which means they expose Prometheus metrics directly. But for the vast majority of applications, we need to rely on third-party, open-source exporters to produce metrics. These exporters transform whatever metric format the service uses into Prometheus metrics. This situation has created a wide and diverse ecosystem of applications and Prometheus exporters in which finding and correctly configuring the right exporter for a given application is not straightforward. For example, it's possible that for a given application more than one exporter (or forks of the same exporter) exists which may or may not be maintained. \r
\r
\rLast year we created PromCat.io to offer solutions to these problems to the open-source community. We use PromCat.io to test and select the best exporter for every supported application, contributing to the open-source exporters when needed and committing back to the Prometheus ecosystem.\r
\r
\rNow it's time to simplify things even further.\r
\r\r\r
Automatically discovering and managing your Prometheus monitoring integrations
\r
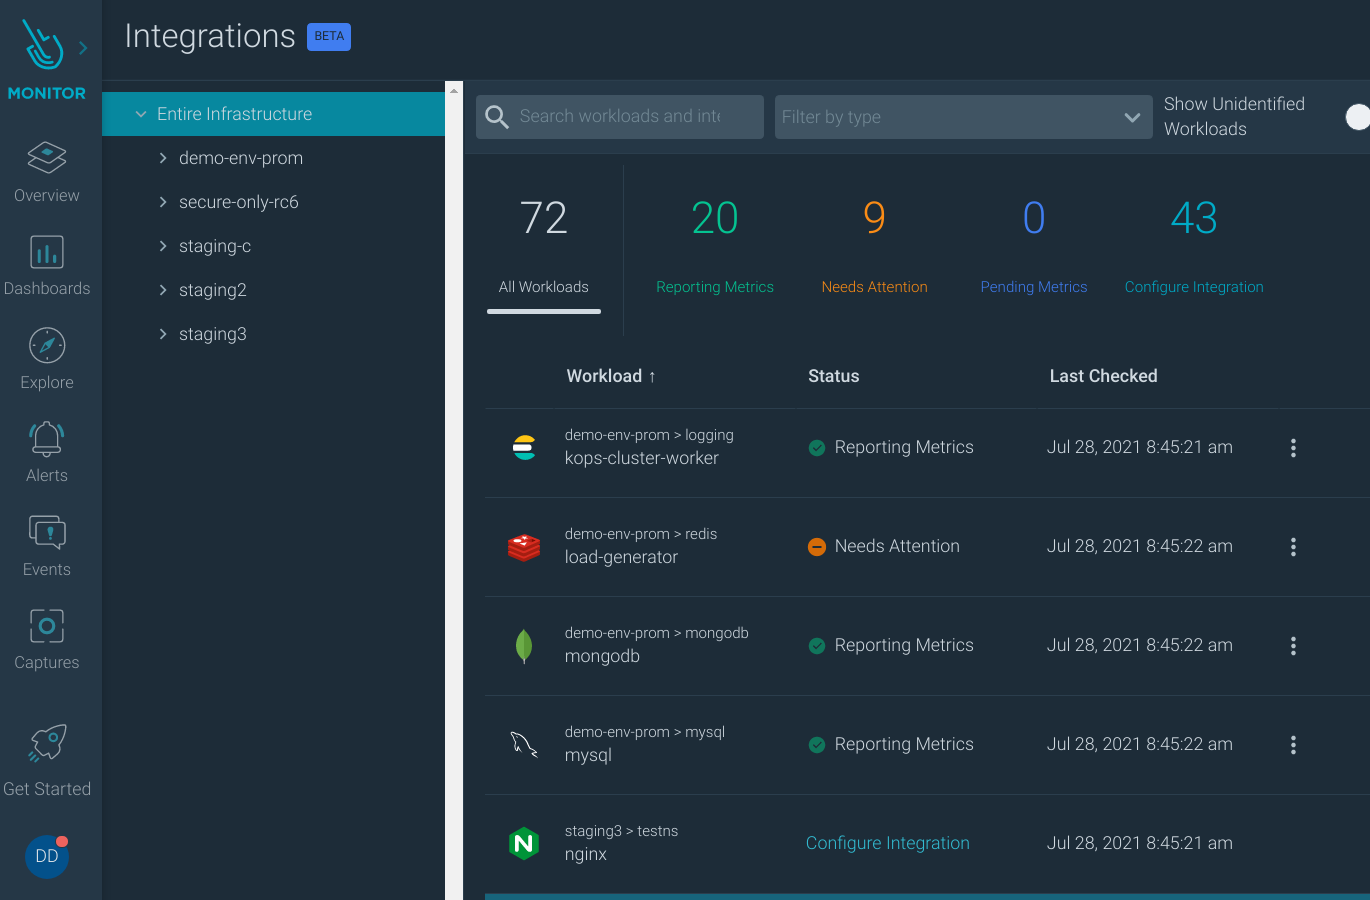
\rAt Sysdig, we think that the main entity in Kubernetes is the workload. They can be either Deployment, DaemonSet, StatefulSet, or even DeploymentConfig in OpenShift. With this in mind, we show you all the workloads, ordered by clusters and namespaces, and identify which kind of application they are.\r
\r
\rThis way, you can manage Prometheus monitoring integrations more easily. At a glance you can see which workloads need attention, which are reporting metrics correctly, and install exporters for some or all of the workloads easily.\r
\r
\r
\r
\r
\rAuto discovery in other monitoring solutions can find out if you have a service running, but it doesn't allow you to configure metric collection on a per instance basis. Sysdig Monitor approach identifies every instance of every workload, even if they are in the same host, and without requiring host access. This creates a great experience not only for the first user that is setting up a monitoring integration, but for everyone that comes behind as well, making every user self-sufficient even if they only have access to their namespace, and not the entire cluster, the host or the monitoring agent. \r
\r\r
Guided configuration for exporters
\r
\rWe know that one of the hardest steps of deploying an exporter is configuring it to connect to your application and generate metrics. This is one of the most exciting improvements that we have created for you.\r
\r
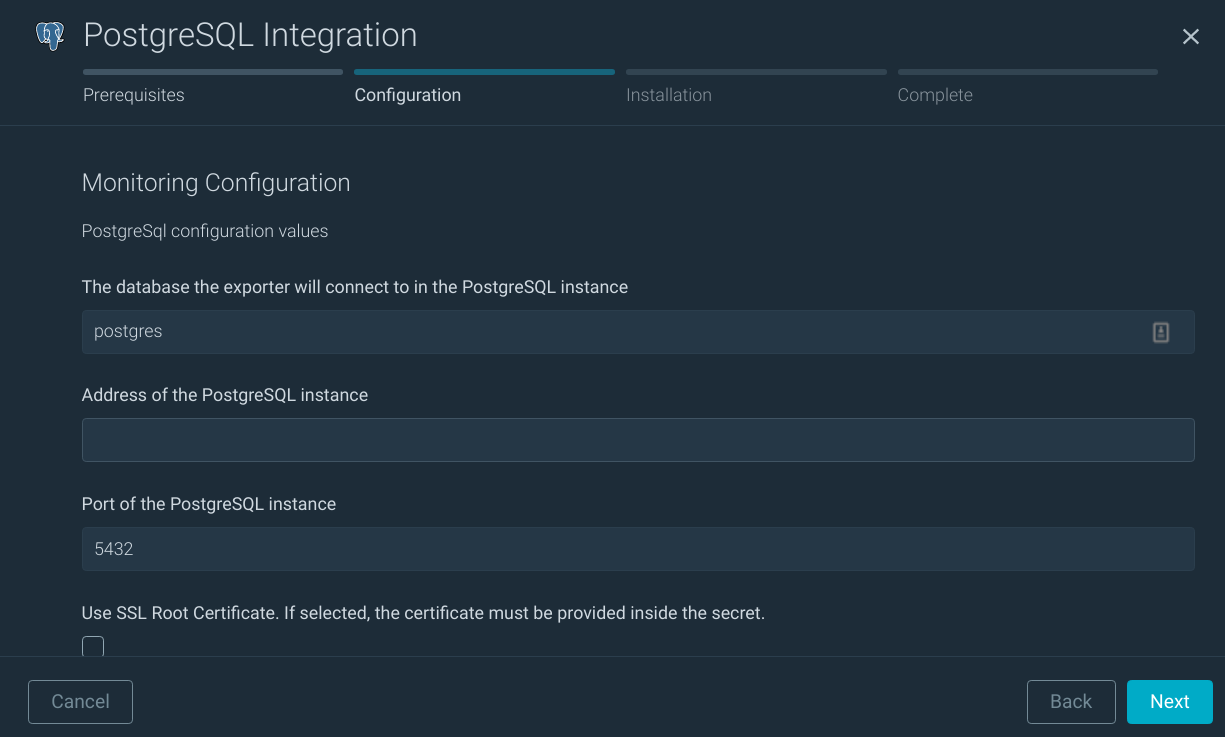
\rYou don't need to dive into the documentation and code of a given exporter to guess the name of the variable to set up the user and password of your database, or how to configure the SSL certificate in the connection string. We do it for you!\r
\r
\rIn every application, you will find a wizard-like form that will ask you all the needed information so it can provide a one-line command that will set up the exporter in your cluster.\r
\r
\r
\r\r
\r\r\r
Curated and enterprise-grade images
\r
\rLike most open-source projects, Prometheus exporters are normally maintained by the community and its images are hosted in free image repositories, where pull restrictions, volatility, or lack of control can affect your production environment.\r
\r
\rAt Sysdig, we own our image repository where we host the images and secure them. All the exporter images that we use pass Sysdig Secure image scanning to detect possible threats. If threats are found, we fix them.\r
\r
\rIf you need images with special requirements, like Universal Based Images, we also provide a version ready for hardened environments.\r
\r\r
\r\r\r\r are OCI-compliant, freely redistributable, container base operating system images that include complimentary runtime languages and packages.\r\r\r
\r\r
\rAlso, the compatibility of the exporter with different versions of the application is not straightforward to find and verify. Don't worry, though, we got you covered. Our engineering team has verified the compatibility of the chosen exporter with different versions of the application, and we offer to our customers a compatibility matrix of exporter vs. application versions that you can rely on.\r
\r\r\r
Direct integration in your CI/CD workflow
\r
\rOnce the exporter is ready to deploy, we offer you different options. First, you can quickly install it with a one-line command. Superfast!.\r
\r
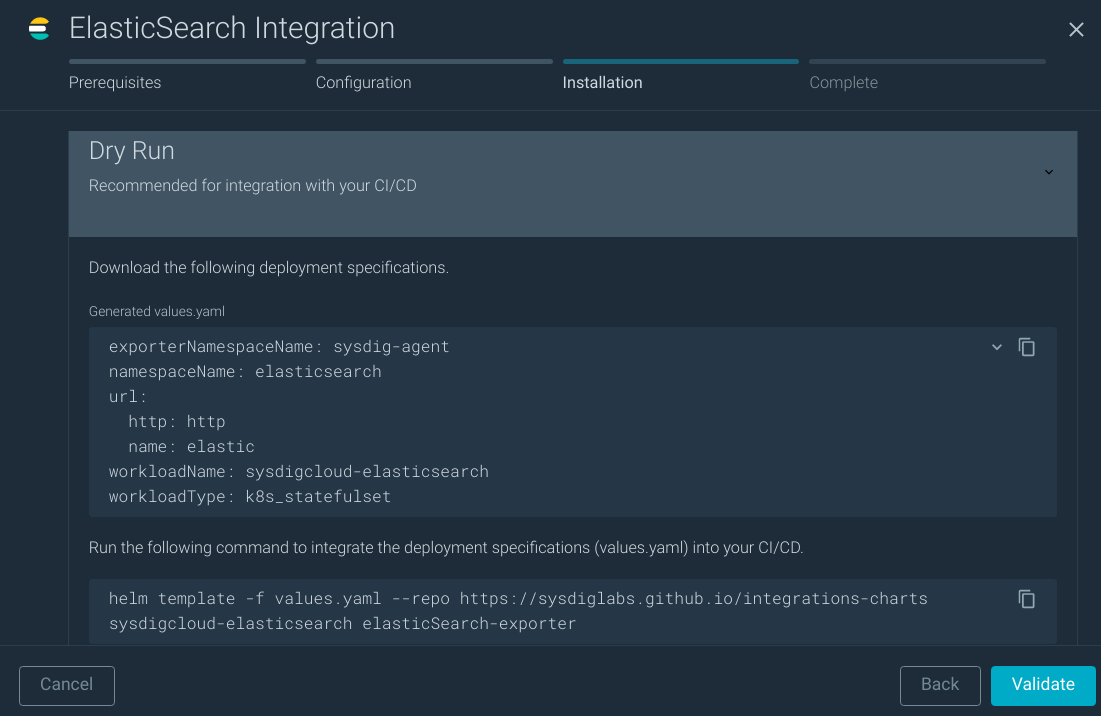
\rIf there are hard controls over your production clusters and you deploy through a pipeline and you cannot run commands directly in production, we also offer the option to generate the manifests to upload to your repository. Ready to commit and push into your CI/CD.\r
\r
\r
\r\r
\r
\rDo you need more options? The wizard that we offer is flexible enough for the vast majority of the users, but we know that environments are diverse and you can have special needs.\r
\r
\rFor customers optionsthat prefer a package management approach, we have created Helm charts for the Prometheus monitoring integrations that are easy to use and well documented, so you can customize all the possible options.\r
\r\r\r
Is it working?
\r
\rSo, you deployed the exporter. Now what? How do you know that the exporter is working?\r
\r
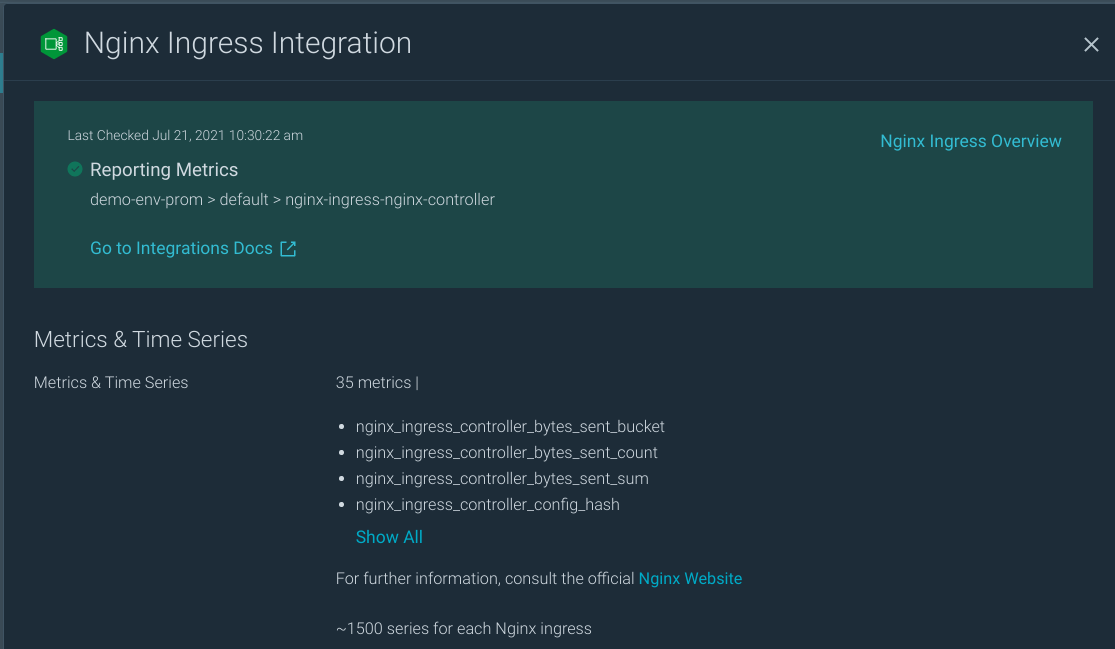
\rSysdig Monitor automatically detects the metrics arriving at your account and associates them to the workload. This way, it is easy to visually detect the applications that are correctly reporting metrics and those that need some attention.\r
\r
\r
\r\r
\r
\rImage of integration successfully reporting metrics\r
\r\r\r
Ready to use dashboards and alerts
\r
\rYou have metrics now in your account, let's make the most of them! Normally, now you'll have to create a set of alerts and dashboards to start monitoring your applications, but we've already done this for you.\r
\r
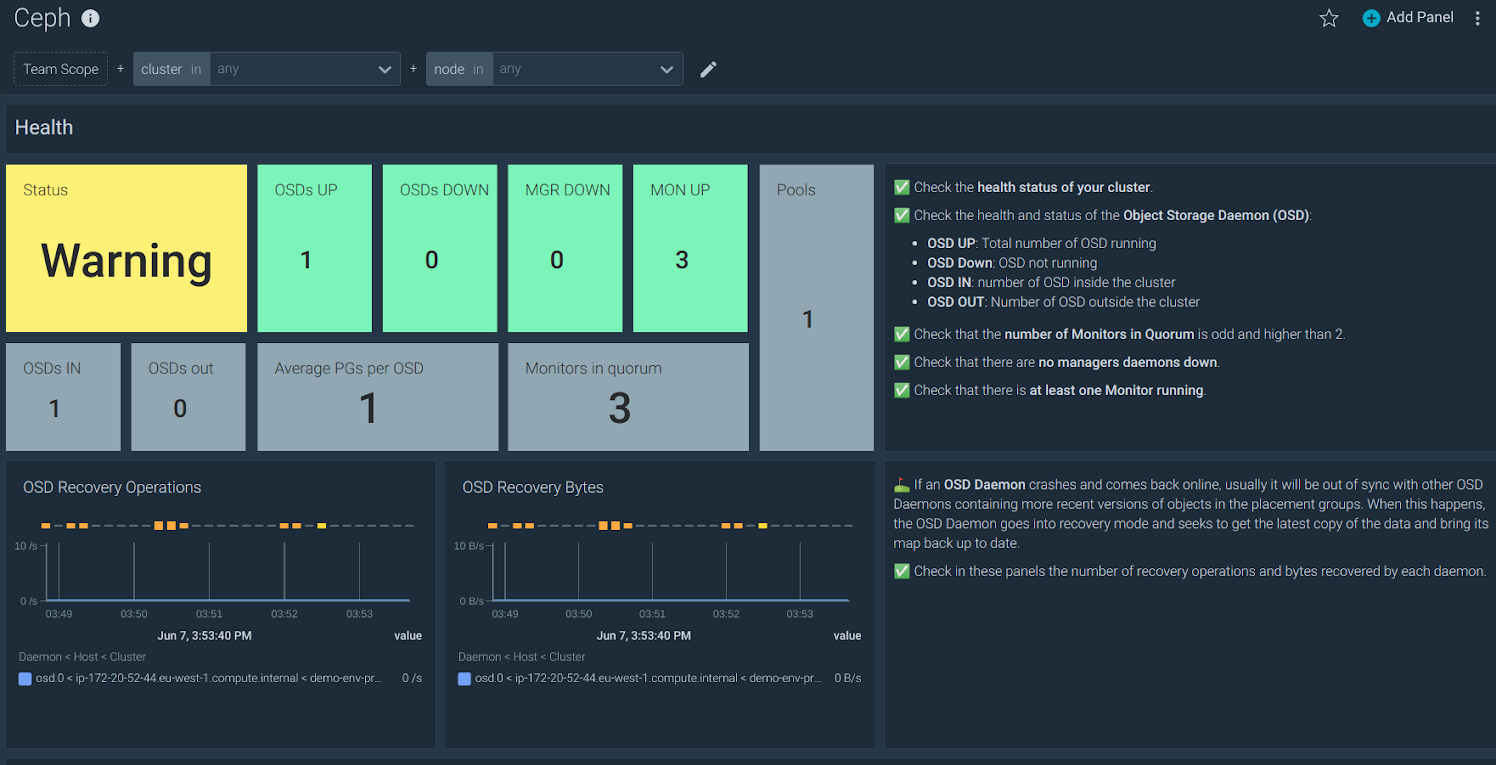
\rWe have created special out-of-the-box dashboards for each integration. These dashboards are made using the monitoring best practices (Golden Signals, USE, or RED frameworks) and they are focused on use cases and usability. To help you make the best of them, we also included some information and troubleshooting tips next to the visualization panels.\r
\r
\rYou can go directly to the dashboards from each of the integration workloads. They'll automatically be scoped to the relevant cluster, namespace, and workload.\r
\r
\r
\r
\r
\rHere, we've added more magic under the hood. Even if the metrics are generated by a Prometheus exporter, that will be transparent for you and your team. The metrics will be associated directly with the namespace and workload of the application that you are monitoring. You don't need to remember every time which exporter is generating the metrics of what application, for the metrics will seem to come directly from your Redis, PostgreSQL, ElasticSearch, etc. This is part of what we call ServiceVision on PromQL, our extended version that simplifies querying.\r
\r
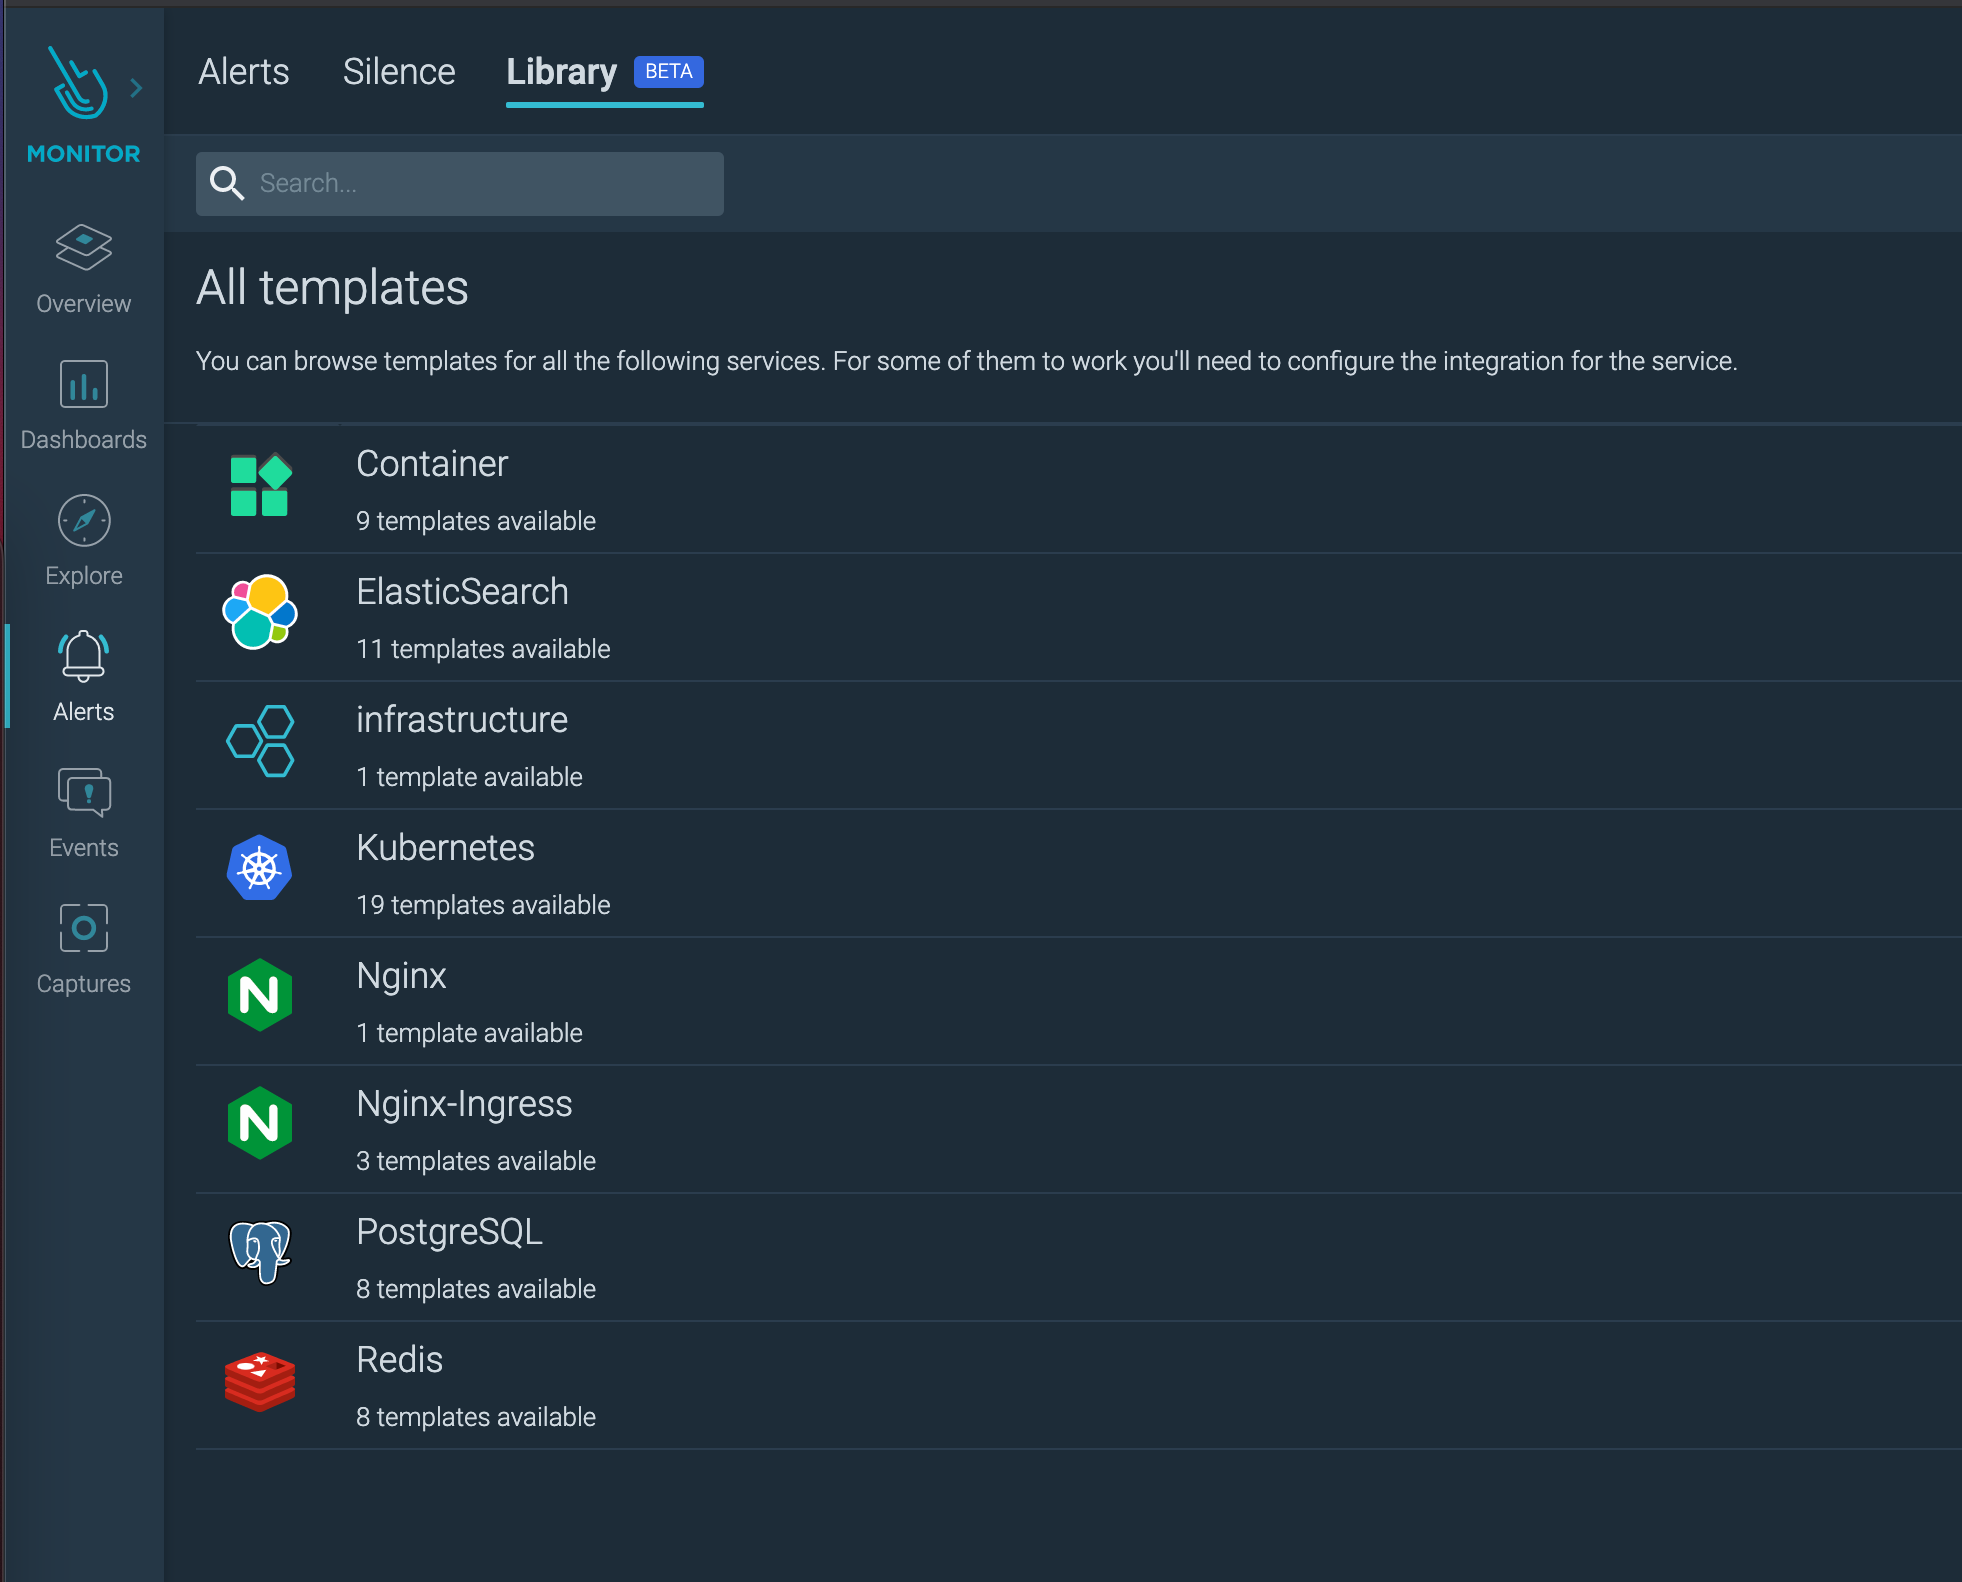
\rWhen Sysdig Monitor starts receiving metrics for a configured integration, you can find all the available dashboards for that integration in the Dashboard Templates section.\r
\r
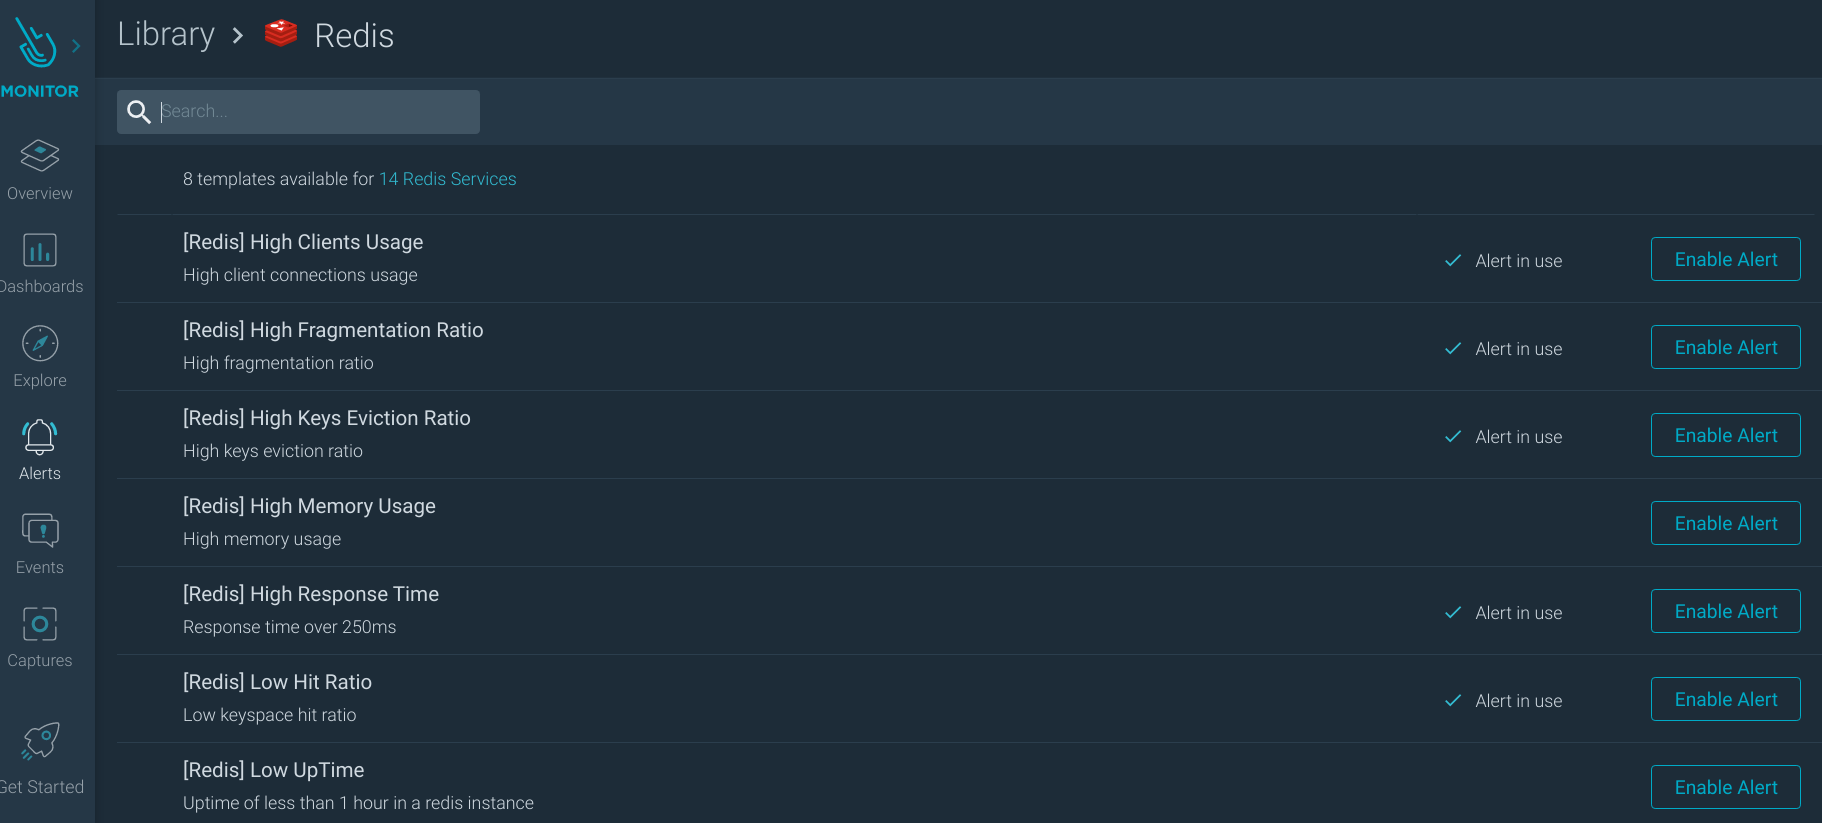
\rAlong with the dashboards, we also automatically create a curated set of alert templates for your applications in our Alerts Library.\r
\r
\r
\r\r
\r
\rThis set of alerts help you to easily start monitoring your applications following the best practices. Also, it lets you customize the alerts for different workloads to different levels and notification channels. You can find them in the Alerts section.\r
\r
\r
\r
\r\r\r
Start now
\r
\rThe Prometheus open-source ecosystem is wide and diverse. We believe our approach will save you a lot of time and effort while avoiding vendor lock-in with our open standards approach and professional support. Sysdig has developed integrations using the best Prometheus exporters for your applications to give you the ability to easily configure and use them. This reduces time and complexity by having ready-to-use metrics, dashboards, and alerts in your account so you can focus on what matters most.\r
\r
\r
\r
\r
\rSounds too good to be true? Take a few minutes and try it yourself. Monitoring your services is now just a few clicks away, just sign-up for a free trial of Sysdig Monitor.\r
\r\r