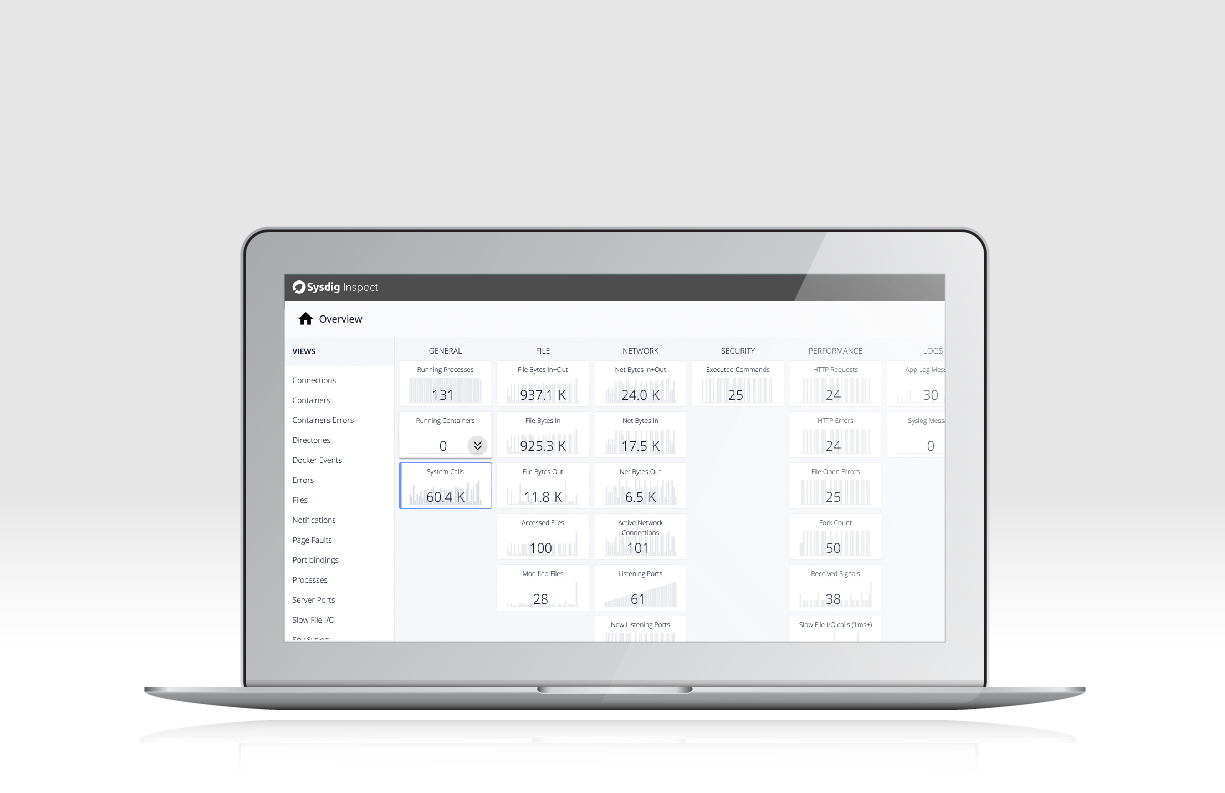
Sysdig Inspect – a powerful interface for container troubleshooting and security investigation


Falco Feeds extends the power of Falco by giving open source-focused companies access to expert-written rules that are continuously updated as new threats are discovered.

Sysdig is routinely praised by users for the richness of the data it's able to capture and for the ability to store system, application and container that data into capture files that can be easily shared with other people.
However, extracting insights from rich data can be hard. Mastering the art of analyzing sysdig capture files requires dedication and skills. This is why we constantly try to improve workflows around sysdig and find ways to get better insights with less effort. Today, we bring these efforts to a new level with the release of Sysdig Inspect.
Sysdig Inspect is a powerful, intuitive tool for sysdig capture analysis that runs natively on your Mac or your Linux PC, with a user interface that has been designed for performance and security investigation.
Sysdig Inspect, and the experience of using it, are really best explained by trying it, which requires just a 30 second installation. But in case that's too much for you, here's a one minute video to get you started:
Let me share a few of the principles that we used to guide the design of Sysdig Inspect.
Instant highlights
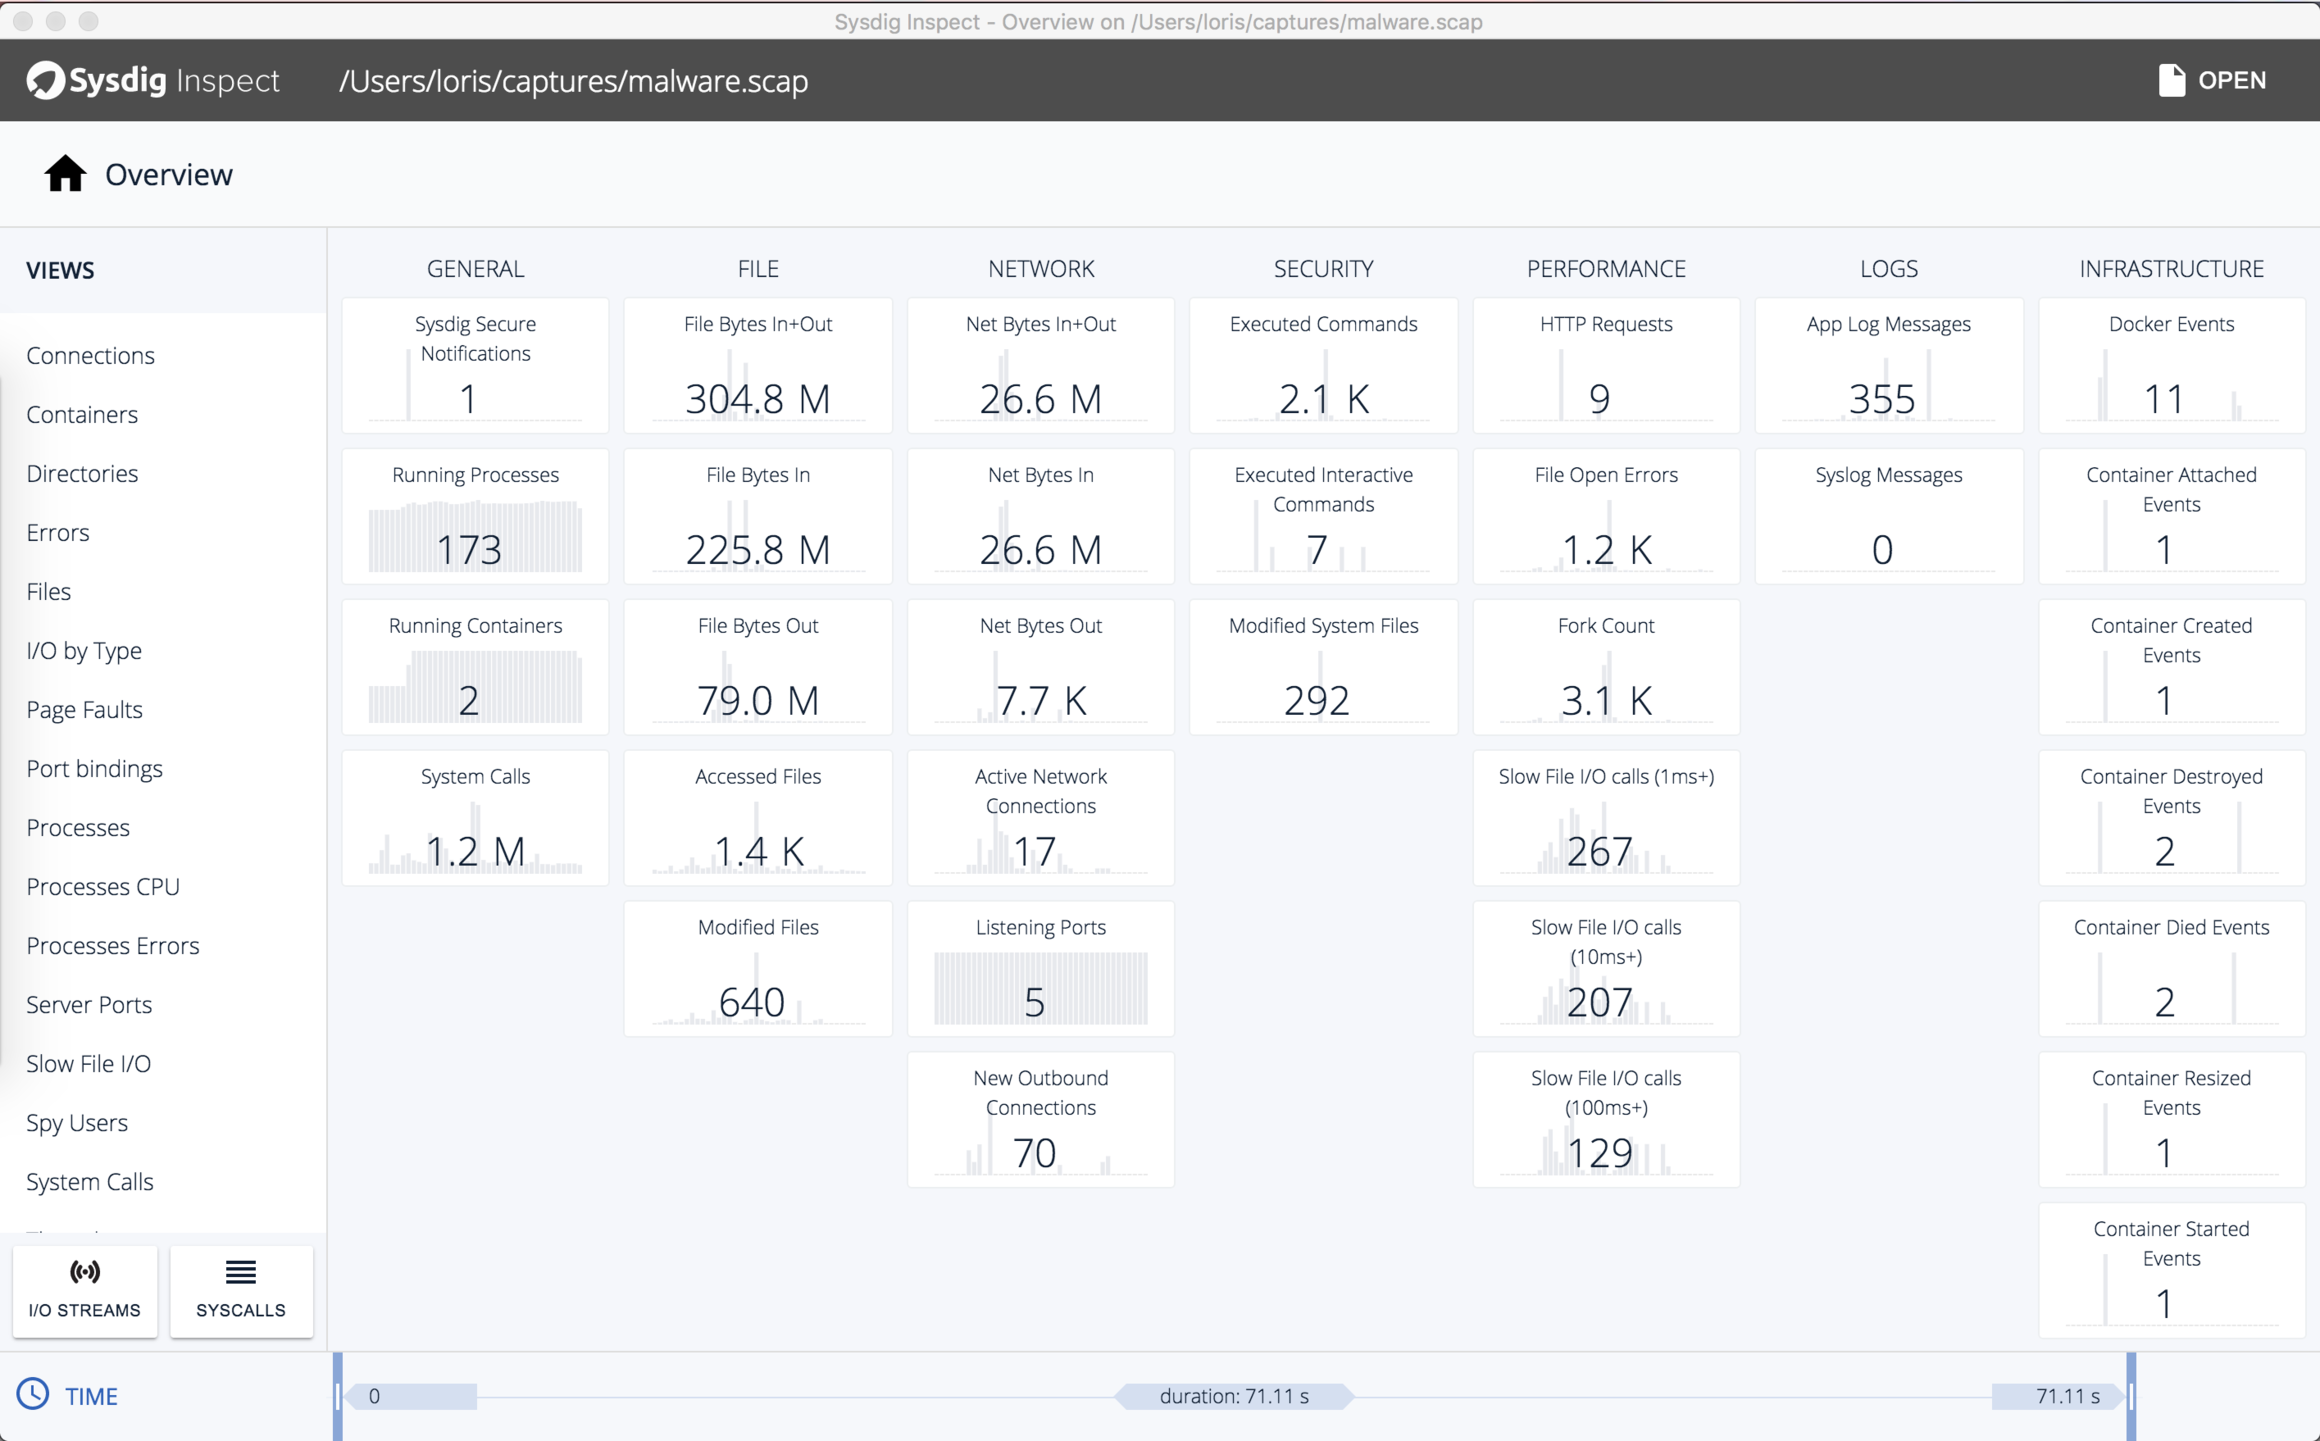
The overview page offers an out of the box, at a glance summary of the content of the capture file. Content is organized in tiles, each of which shows the value of a relevant metric and its trend. Tiles are organized in categories to surface useful information more clearly and are starting point for investigation and drill down.
Sub-second microtrends and metric correlation
Once you click on a tile, you will see the sub-second trend of the metric shown by the tile. Yes, sub-second. You will be amazed at how different your system, containers and applications look at this level of granularity. Multiple tiles can be selected to see how metrics correlate to each other and identify hot spots.
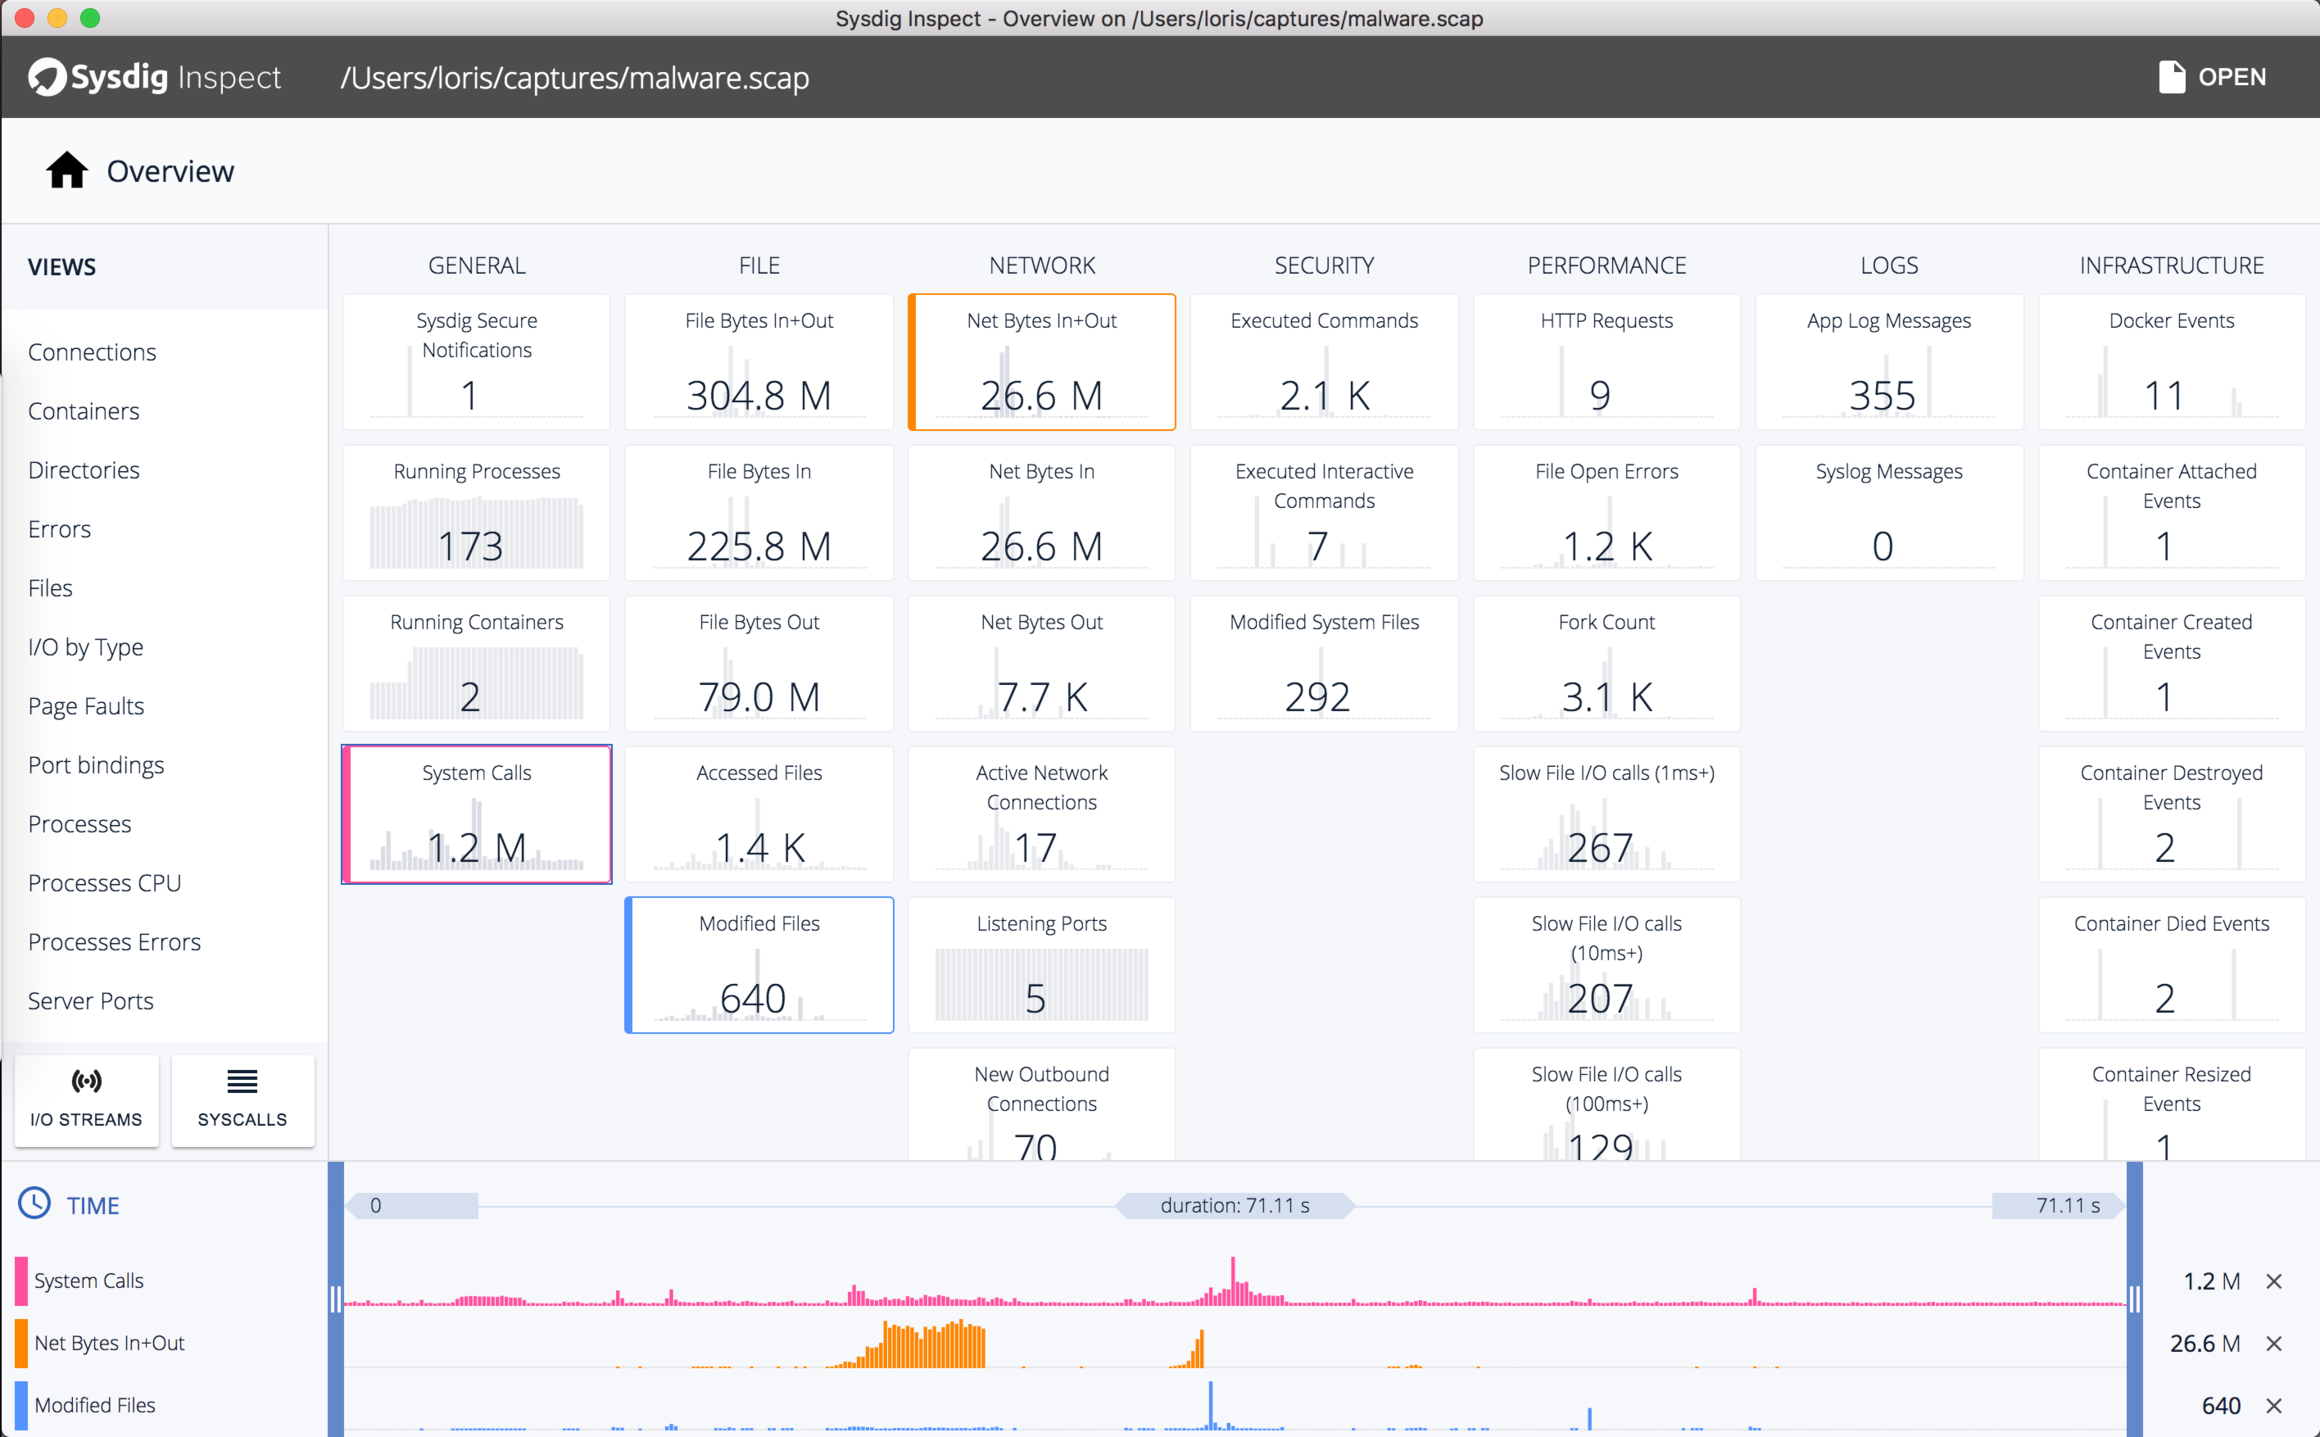
Intuitive drill-down-oriented workflow
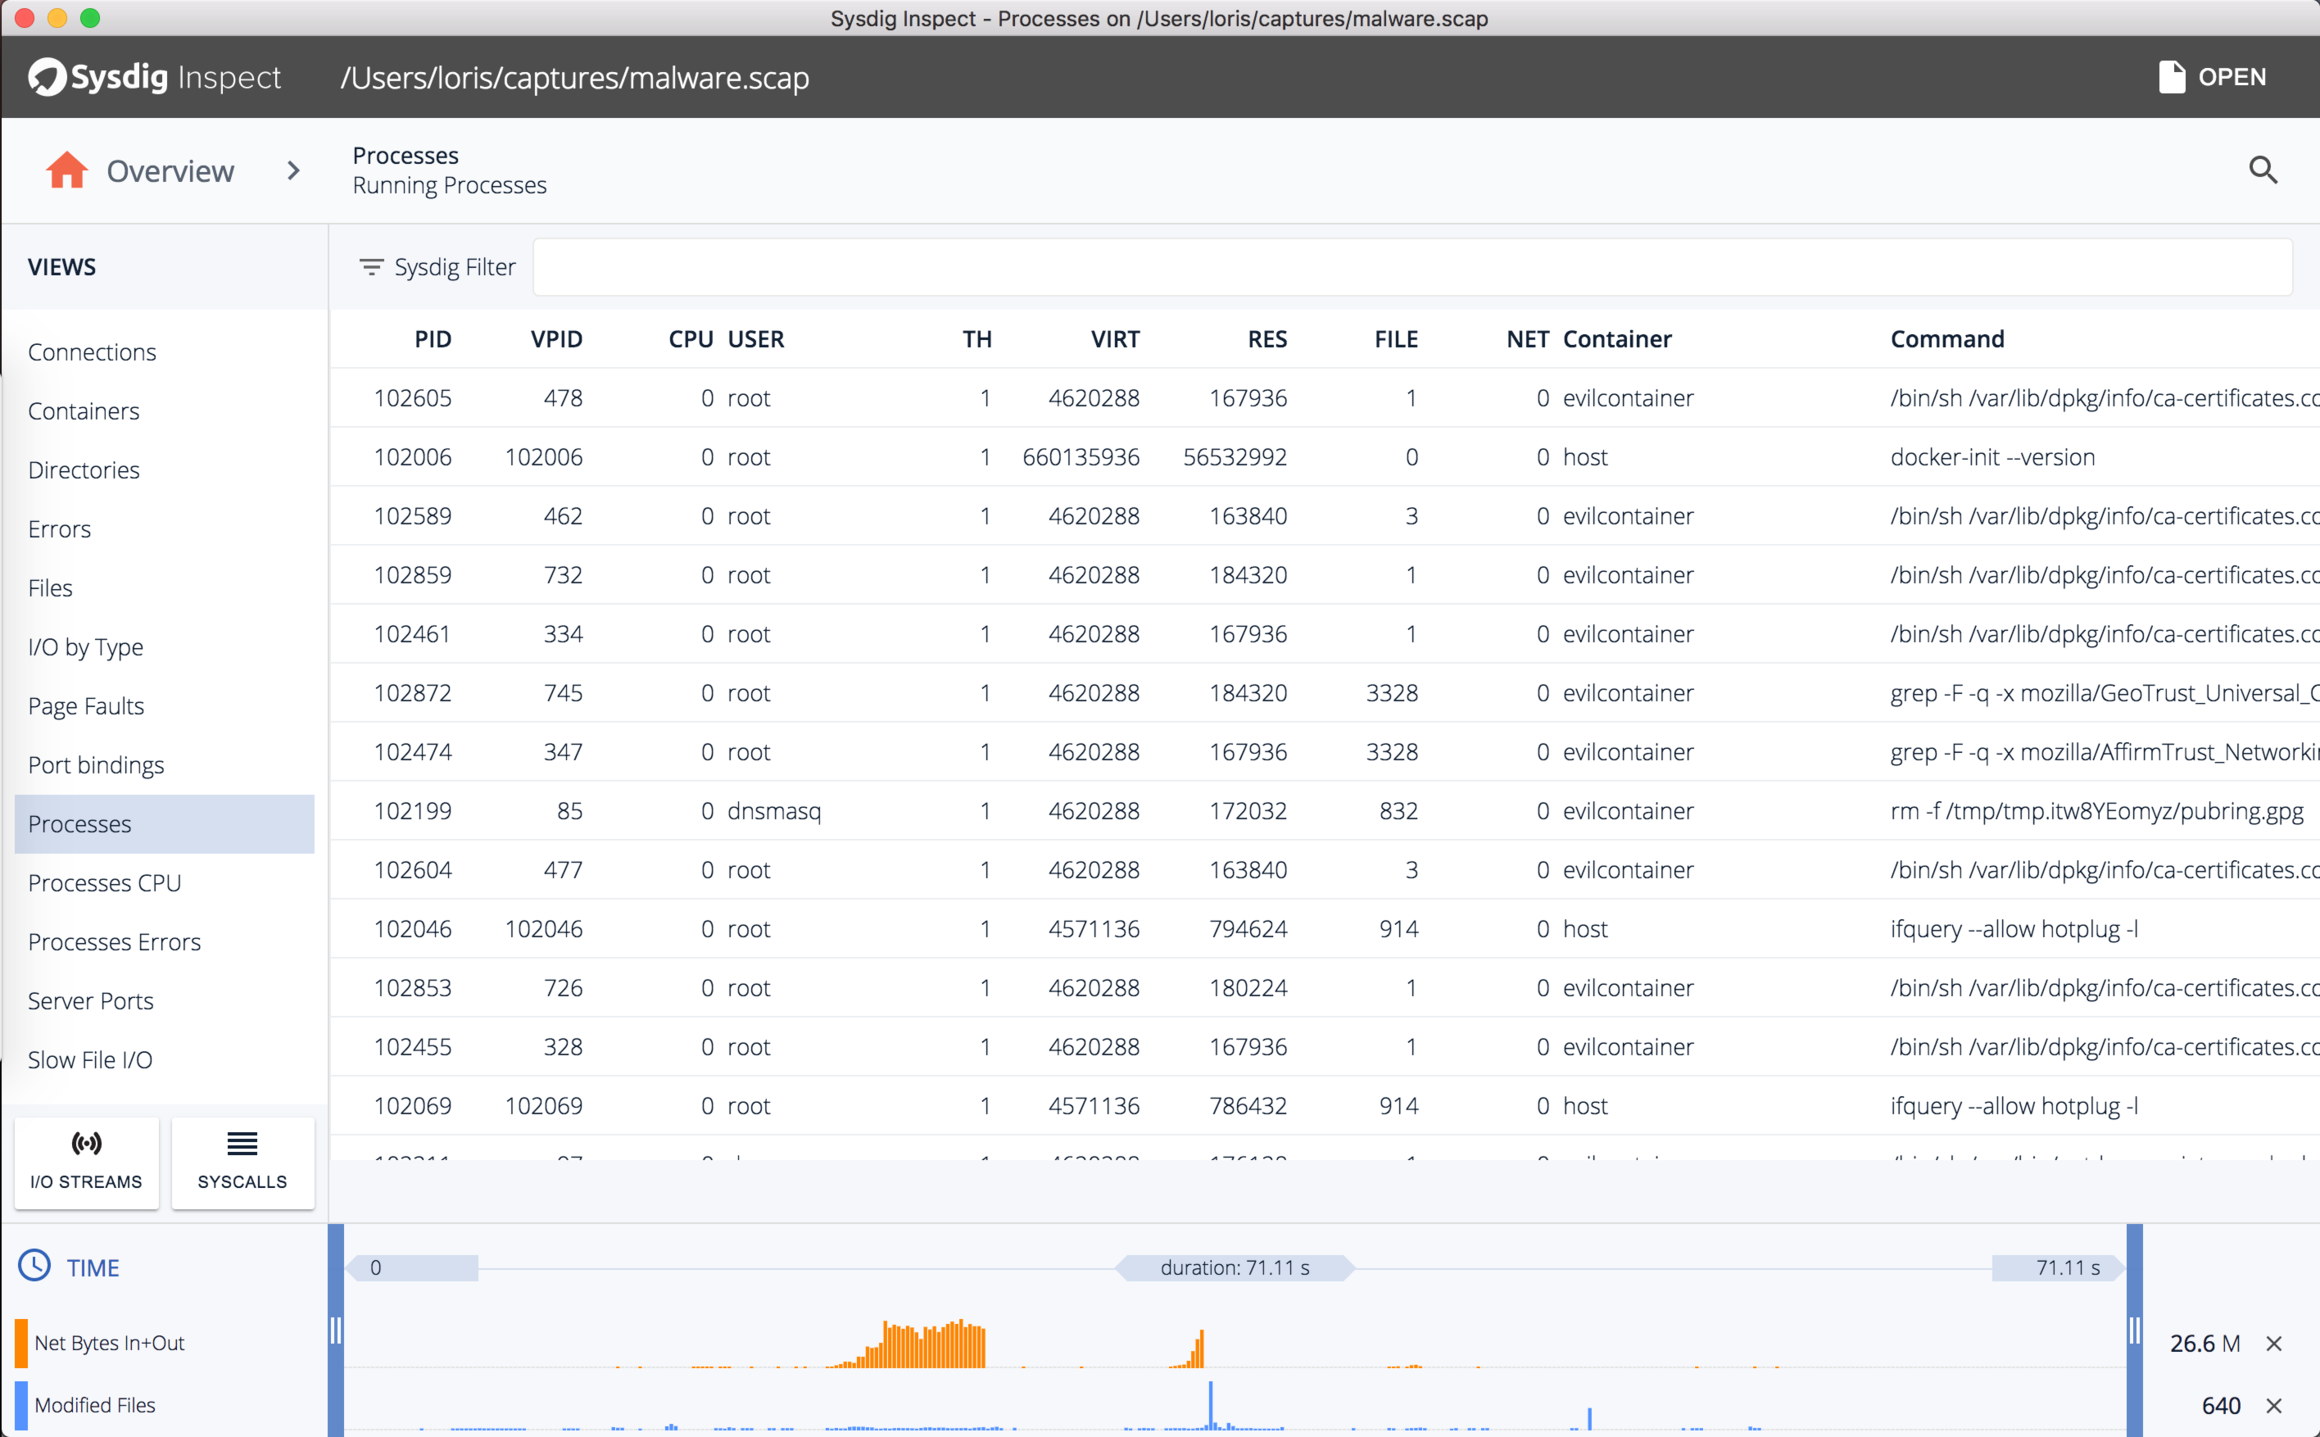
You can drill down into any tile to see the data behind it and start investigating. At this point you can either use the timeline to restrict what data you are seeing, or further drill down by double clicking on any line of data. You will be able to see processes, files, network connections and much more.
All the details when you need them
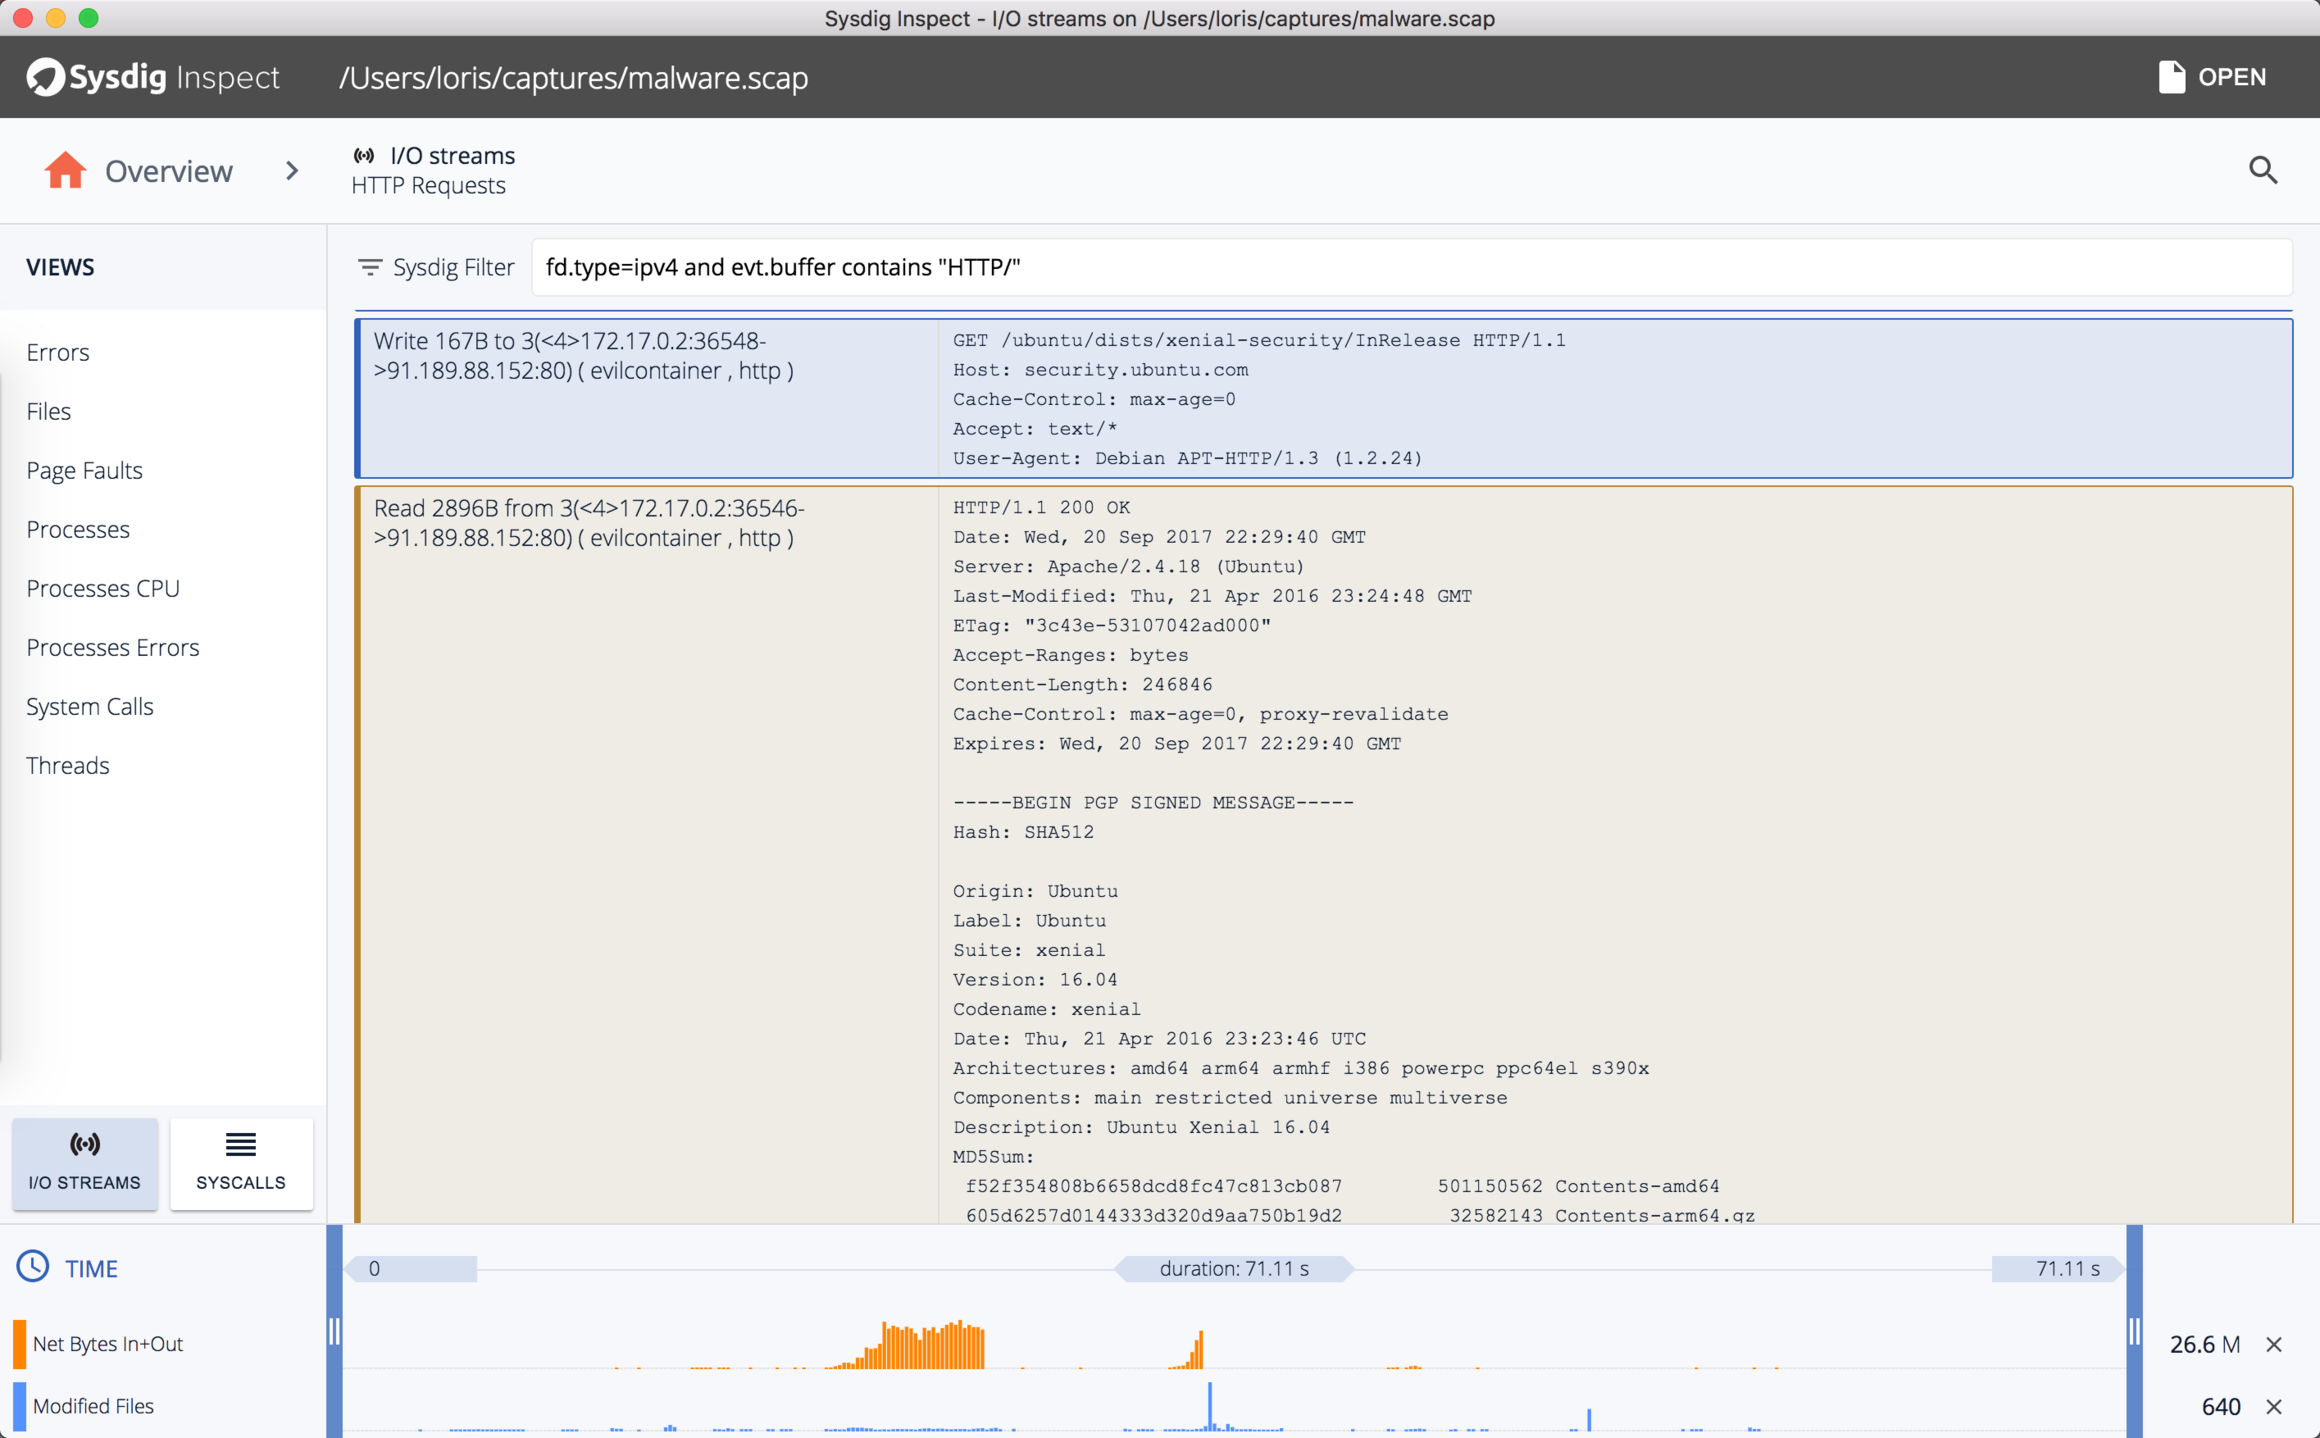
Every single byte of data that is read or written to a file, to a network connection to a pipe is recorded in the capture file and Sysdig Inspect makes it easy to observe it. Do you need to troubleshoot an intermittent network issue or determine what a malware wrote to the file system? All the data you need is there. And, of course, you can switch at any time into sysdig mode and look at every single system call.
Conclusion Most of all, the guiding principle when designing Sysdig Inspect was: make troubleshooting and security investigation easy, effective and, as much as possible, a pleasure. Either if you took the capture file manually or you used
Sysdig Monitor to launch a capture just when an alert triggered, we aim at providing all the tools you need to monitor, troubleshoot and do forensics in your container platform. Did we succeed achieving this goal? You can judge by yourself by trying it! To make your life easy, here are some capture files that you can use to play with it.
What's next?
- Tune into the Sysdig Camp-Con-World-Fest-Summit Livestream for two days of new announcements and hands on container troubleshooting sessions
- Download Sysdig Inspect
- Join our Slack group and let us know what you think!