


Falco Feeds extends the power of Falco by giving open source-focused companies access to expert-written rules that are continuously updated as new threats are discovered.

First off, let me start with a big thank you to all of you for your interest in sysdig! We have been overwhelmed by the positive response from the community, and by the quality of the comments, questions, and contributions we're receiving. For the uninitiated, sysdig is a system-level exploration and troubleshooting tool for Linux. In this post, I want to try to answer two important and recurring questions we've received: 1. "How does sysdig work?" 2. "How is this different from the plethora of tools already available to analyze a Linux system or the processes that run on top of it (SystemTap, LTTng, DTrace, strace, ktap to name few of them)?" I'll address both questions by providing a technical breakdown of sysdig's architecture. But before doing that, let's look at two very well-known tools: strace and DTrace.
How does strace work?
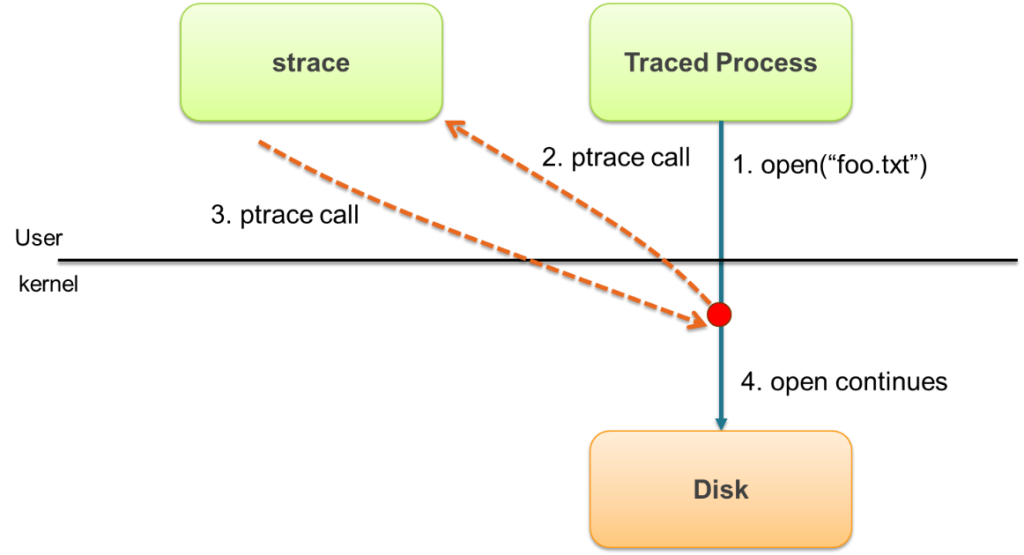
Strace is based on a facility called ptrace that is exported by Linux and other operating systems. Ptrace can do many complex things and is used, for example, by debuggers like gdb to look into a running process. Strace uses it to instrument a target process and "listen" to that process's system calls.The ptrace mechanism makes it possible for strace to interrupt the traced process every time a system call is invoked, capture the call, decode it, and then resume the execution of the traced process. The challenge is that, as you may know, every time a system call is invoked (eg. open, read, write, close), a transition from user level to kernel level is required – this is known as a context switch. This is accomplished in different ways depending on the CPU family and model, but it tends to be complex and relatively slow.By now it should be clear why strace is not very efficient: every original context switch now turns into multiple context switches, and the traced process is stuck waiting for strace to do its decoding.****TLDR**: ptrace, and subsequently strace, add massive performance overhead to your system.
How does DTrace work?
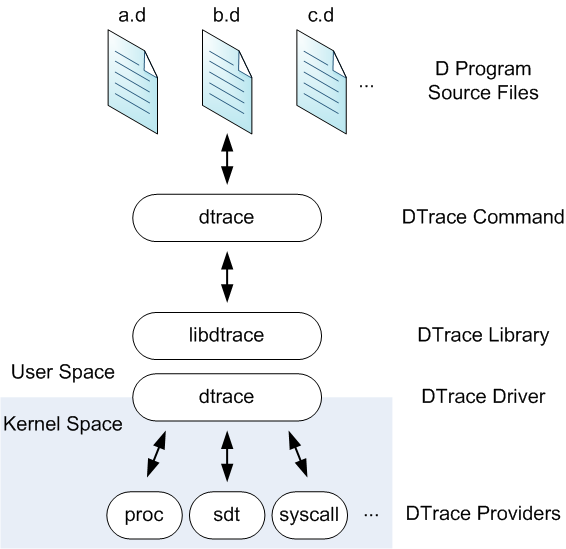
DTrace is more sophisticated than strace, and much more efficient. Here is its architecture from theOracle documentation: DTrace takes scripts written in a domain-specific language called D, converts them into bytecode, and then injects the bytecode into specific places in the kernel. The bytecode can be executed when specific events happen, for example when a system call is invoked. The (usually) summarized script output can be collected through libdtrace by user level consumers, who print it on the screen or save it to disk. DTrace is very flexible, thanks to the versatility of D and the many places in the kernel where you can attach scripts (as well as in userspace). It is also much more efficient than strace, because no context switch is involved in processing a system call. Since scripts are run inline, however, there's still a chance that a complex or badly written D script can slow down the original execution. It's also possible that, even if single scripts are fast, running many of them at the same time could cause performance degradation.****TLDR**: DTrace is a powerful and dynamic tool, which requires significant technical knowledge to utilize and optimize.
How does sysdig work? Ok, now the fun part – let's talk about sysdig.
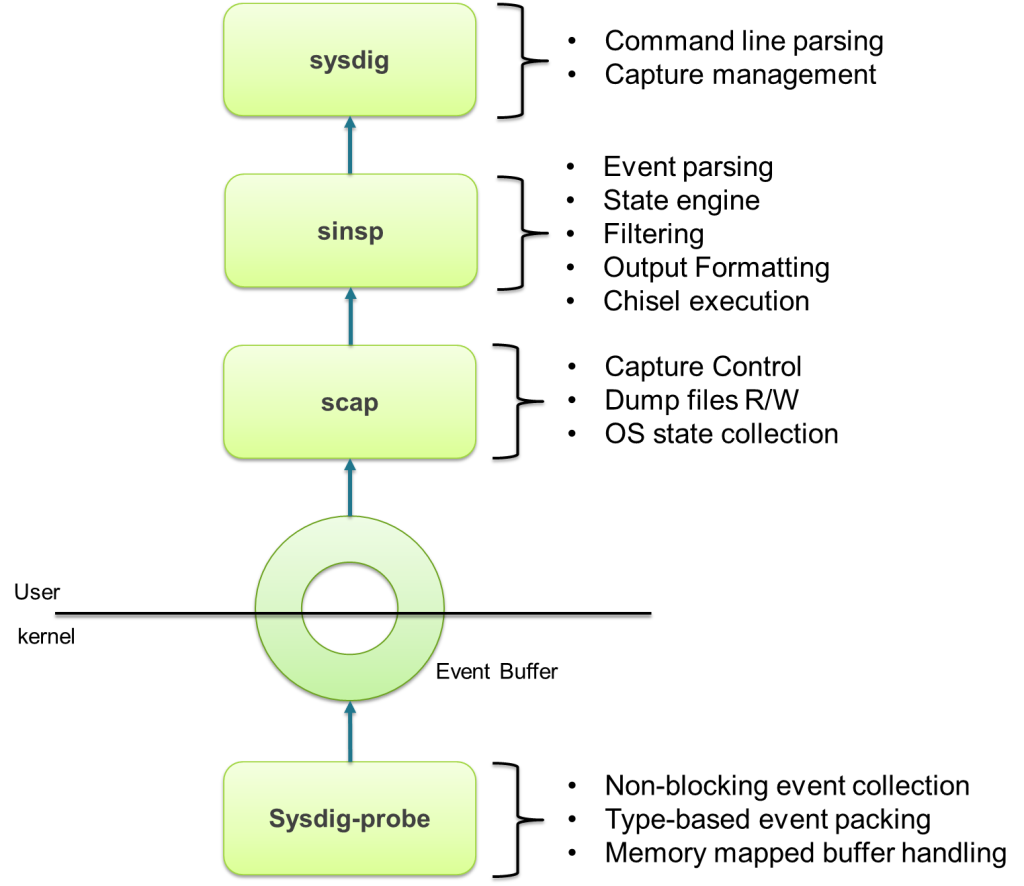
Sysdig has an architecture that is very similar to that of libpcap/tcpdump/wireshark. First, events are captured in the kernel by a small driver, called sysdig-probe, which leverages a kernel facility called tracepoints. Tracepoints make it possible to install a "handler" that is called from specific functions in the kernel. Currently, sysdig registers tracepoints for system calls on enter and exit, and for process scheduling events. Sysdig-probe's handler for these events is super simple – it's limited to copying the event details into a shared buffer, encoded for later consumption. The reason to keep the handler simple, as you can imagine, is performance, since the original kernel execution is "frozen" until the handler returns.That's all the driver does. The rest of the magic happens at user level.The event buffer is memory-mapped into user space so that it can be accessed without any copy, minimizing CPU usage and cache misses. Two libraries, libscap and libsinsp, then offer support for reading, decoding, and parsing events. Specifically, libscap offers trace file management functionality, while libsinsp includes sophisticated state tracking functionality (e.g. you can use a file name instead of an FD number) and also filtering, event decoding, a Lua JIT compiler to run chisels, and much more. Finally, sysdig tops it off as a simple wrapper around these libraries.But what if sysdig, libsinsp or libscap are not fast enough to keep up with the stream of events coming from the kernel? Will sysdig slow down my system just like strace (the wise reader asks)? Well of course not. In this scenario, the event buffer fills up, and sysdig-probe starts dropping the incoming events. So you will lose a bit of trace information, but the machine, and the other processes running on it, will not be slowed down.This is a key advantage of sysdig's architecture. It means the tracing overhead is very predictable, and it means sysdig is ideal for running in production environments. It also means that our chisels don't need to be as carefully optimized as DTraces's D scripts. And on top of that, chisels get to leverage the rich set of libraries written for Lua (want to pipe your chisel's data to Redis? There's a library for that!).TLDR: Sysdig is versatile, easy to use and won't break your system! sysdig vs strace vs dtrace: this is how they compare Click to tweet
Conclusions
So what's best? Strace? DTrace? Sysdig? As usual, the answer is "it depends". Strace is a very mature tool that is preinstalled on pretty much every unix system in the world, so it's very often the only alternative. It also has a very complete decoding logic that interprets the details of every system call, even the esoteric ones. On the other hand, its impact on performance doesn't make it a great choice for troubleshooting in production environments.DTrace's strengths are efficiency, flexibility and coverage. It sports a massive set of scripts that can look into the most exotic places, inside and outside the OS kernel. Moreover, its overhead is very low because the scripts are run "in place", making it more suitable for live troubleshooting (provided you make sure your scripts are well behaved). These same features, however, make it quite hard to master, so DTrace is considered a tool for "experts".While flexible and powerful, we think sysdig's real appeal lies in its pragmatism. Key features include the ability to export data to trace files, the rich and natural filtering language, the ability to use file names and IP addresses instead of FD numbers, and the versatile and forgiving scripting infrastructure that works both on live systems and on trace files. All in, we believe these features add up to create a natural workflow that makes it really easy to get really productive. That's why we made sysdig, and that's why we use it every day on our team. I hope you find it useful as well!And by the way, if you like sysdig: we're hiring. Thanks!