


Falco Feeds extends the power of Falco by giving open source-focused companies access to expert-written rules that are continuously updated as new threats are discovered.

What if we could do application monitoring without complex dependencies, overhead and for free? That's why we recently launched Sysdig Tracers: a new functionality that extends the open source Sysdig troubleshooting tool from the infrastructure layer towards the application layer.Tracers allow you to monitor execution time of any segment of code from a start point to the exit point. Tagging these code spans is as easy as writing a string to /dev/null, with almost no performance impact and easy to accomplish with any programming language (even your bash scripts!). Sysdig also allows you to go much deeper than measuring API requests – you can get deep into understanding application, file and network processing that makes up the latency in your processes. There is no need to link new libraries or instrument application frameworks, although if you don't want to write tags to /dev/null manually, we have wrappers for some of the most popular programming languages like Python or Go.In order to illustrate how to use Sysdig Tracers with a real example, we have created a simple API service. Let's run some requests against it and see what Sysdig can show us.
API endpoint tracing instrumentation
The server uses Python SimpleHTTPServer and listens on port 8888 for incoming HTTP GET requests on these endpoints:
/fib/{number}: returns the Fibonacci of the given parameter{number}/empty: returns an empty response/download: returns a randomly chosen file
We are going to be tracing the performance of every HTTP GET request to each endpoint. As opposed to what Sysdig users are accustomed to, Sysdig Tracers requires a very small amount of code instrumentation (actually just tagging). Sysdig is awesome in its ability to give you application layer metrics without any code instrumentation, decoding application protocols like HTTP requests or SQL queries from system calls writing on file descriptors (including sockets and also files). Now we are digging even deeper into apps, and this requires tagging the code we want to profile.Using Tracers in your Python code is as simple as importing sysdig_tracer and encapsulating your code within a with section. To know more about the Python wrapper we suggest reading Introducing Python Sysdig Tracers.
<pre><code><br>File: sysdig_tracers_example.py<br>-------------------------------<br><br>from sysdig_tracers import Tracer, Args, ReturnValue<br><br>[...]<br><br> @Tracer(enter_args={"n": Args(1)}, exit_args={"ret": ReturnValue})<br> def do_download_write(self, filename):<br> with open(filename, 'r') as f:<br> self.wfile.write(f.read())<br><br> # randomly download a file between a collection of 4<br> def download_handler(self, num):<br> with Tracer("download_handler") as t:<br> with t.span("download_headers"):<br> self.do_headers()<br><br> with t.span("download_write"):<br> filename = '/tmp/blob.bin.{}'.format(random.randint(1,4))<br> self.do_download_write(filename)<br></code></pre>Here we can see how the entire code that handles a request to /download is under the scope of the download_handler tracer using a with statement. Inside, we have identified two subsections we want to measure individually: writing the HTTP headers and writing the body content in the response. Using tracer spans we can tag each section individually.In order to get some traffic we'll use the HTTP load testing tool siege to simulate a bunch of clients accessing our API. siege will load a text file with a long list of URLs with the 3 existing endpoints that have random parameters.To launch this scenario on your own you can either install sysdig_tracers library from pip and the siege package to run things manually or let docker-compose do everything for you running the server and the client in Docker containers.With both the server and the client running, let's use sysdig to dump a capture into a file. This capture will contain all the syscalls, some of them tagged with the tracer name that scoped the piece of code that generated the syscall. Leave sysdig running around 30 seconds to gather some data and stop with Ctrl+C:$ sudo sysdig -zw capture.scap container.name=sysdig-tracers-server
API endpoint performance monitoring
We can now stop both the server and the client to explore the capture with csysdig:$ csysdig -v traces_summary -r capture.scap
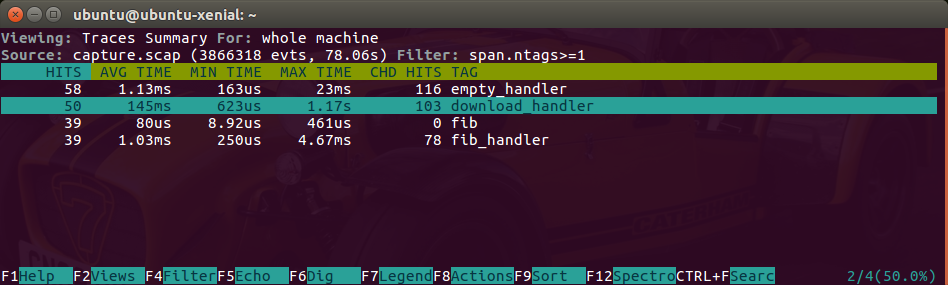
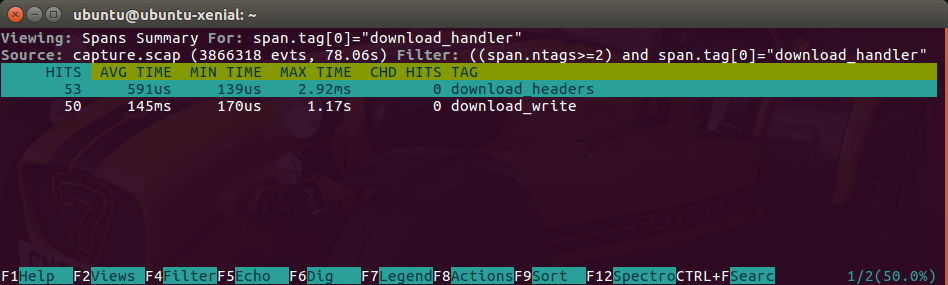
This view gives us a report containing the average, minimum and maximum execution time of the different Tracers we instrumented. In this example we can see how the download handler sometimes is quite slow compared with the rest of handlers. This is especially interesting as the maximum exec time peaks at 1.17 seconds. We can drill down and observe the spans inside that trace:
So far these views have given us good information, but it's all aggregate. Sysdig also offers an excellent view to observe the execution time distribution: Sysdig spectrograms. This view can be accessed through F2 Views > Traces Spectrogram or with $ csysdig -v spectro_traces.
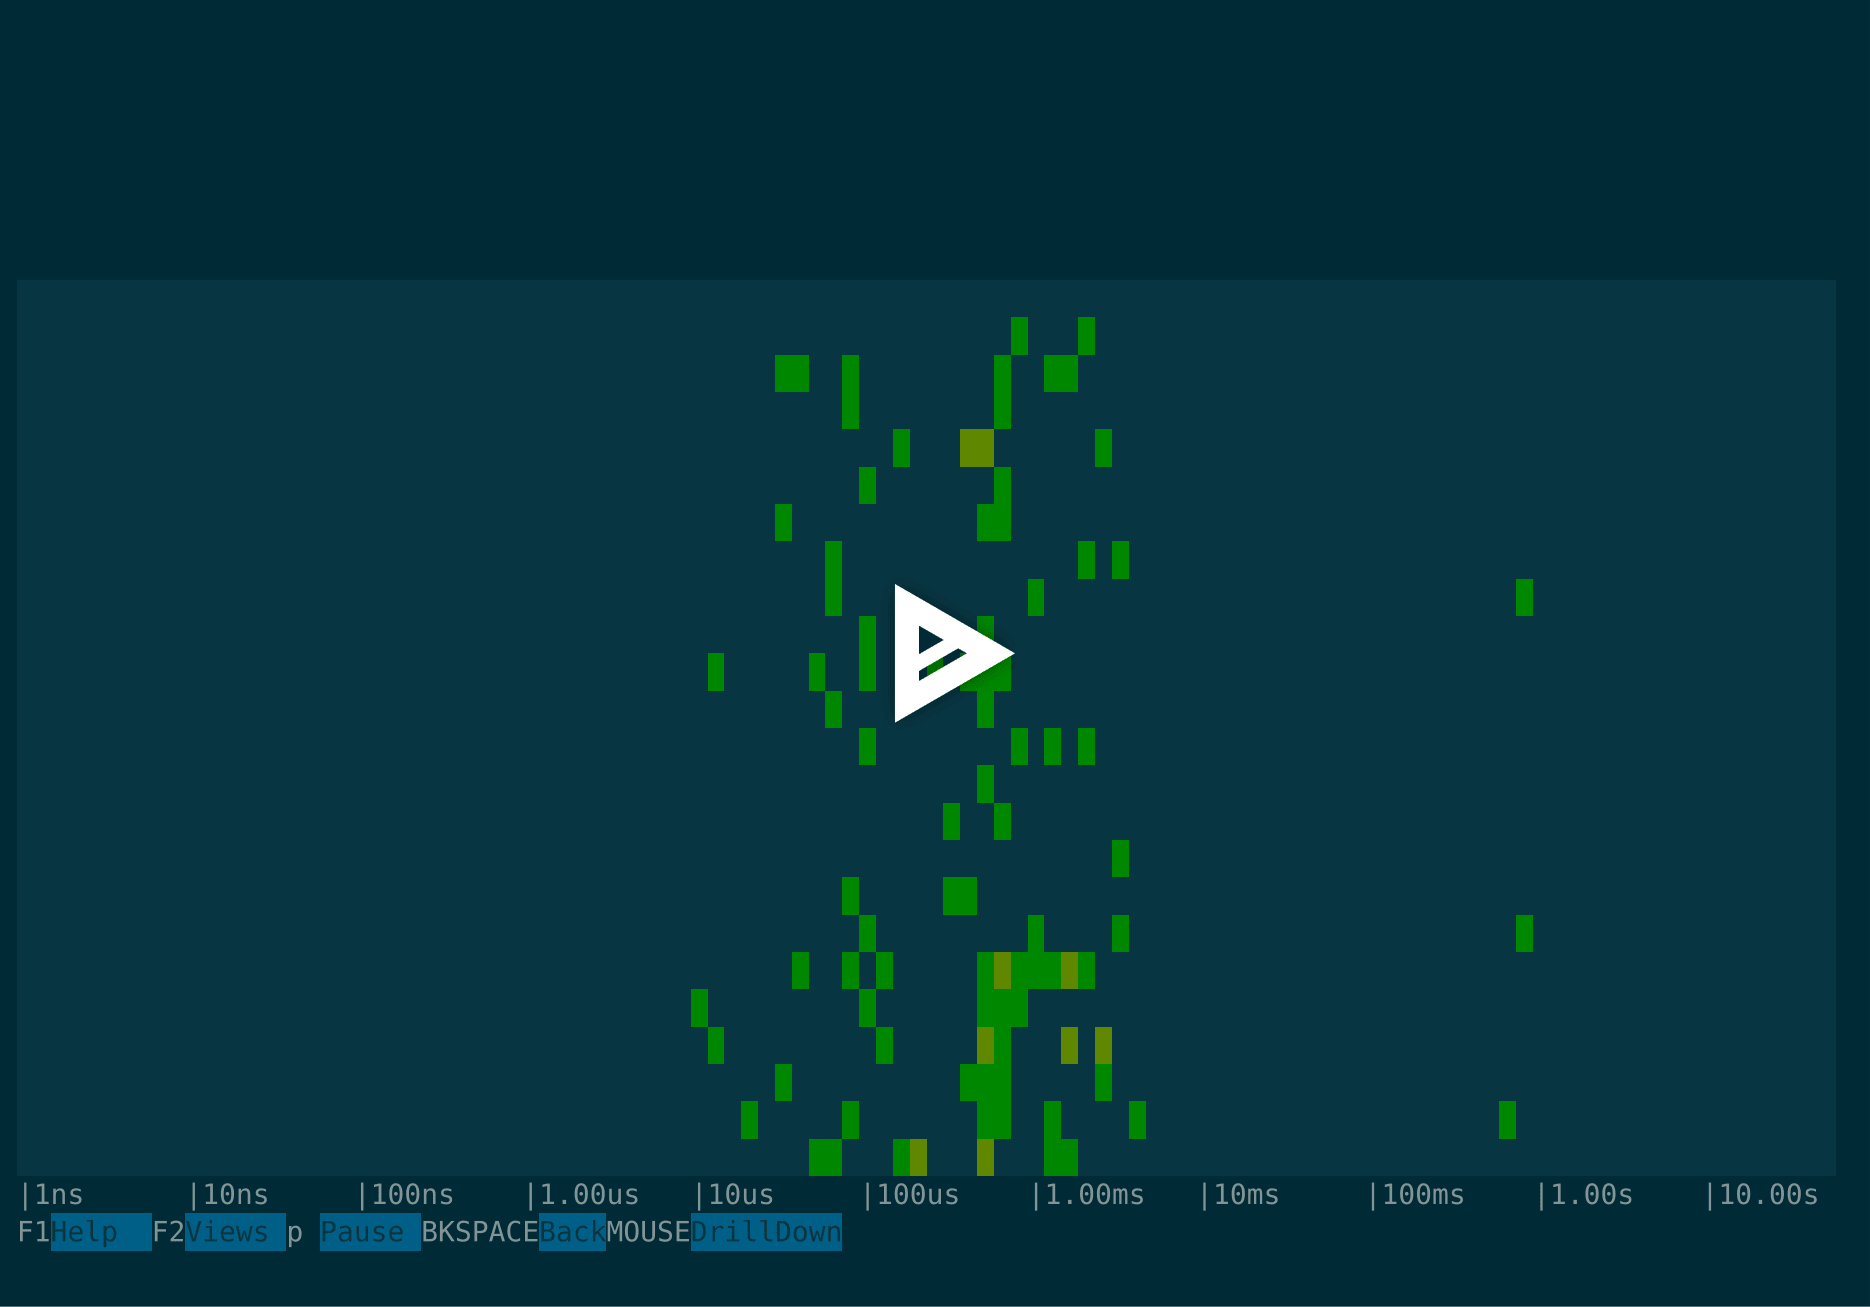
Here we can clearly identify how the execution time of a number of API requests goes up an order of magnitude (~1.5 s). How can we leverage Sysdig to troubleshoot this? Well, all the Sysdig filters we know are also available when using Sysdig Tracers.
Troubleshooting slow requests with Sysdig
A good way to start would be to filter out Tracers from requests that took more than 500ms to complete:$ sysdig -r capture.scap "span.duration>5000000"We are pretty sure that code inside the download handler is going to be very I/O resource intensive: needs to read a file and then write it on the network socket. We can confirm that grouping the syscalls by the span tags and report on I/O. chisels are great for this kind of aggregation and reporting, if you haven't used Sysdig chisels before, we wrote about them in Using Sysdig to Explore I/O with the "fdbytes_by" Chisel.
515960 09:31:41.850237092 0 python (31161) < tracer id=31161 tags=download_handler.download_write args=
515962 09:31:41.850242102 0 python (31161) < tracer id=31161 tags=download_handler args=
539207 09:31:47.005441052 0 python (31198) < tracer id=31198 tags=download_handler.download_write args=
539211 09:31:47.005528202 0 python (31198) < tracer id=31198 tags=download_handler args=
540582 09:31:47.046939010 1 python (31199) < tracer id=31199 tags=download_handler.download_write args=
540584 09:31:47.046943497 1 python (31199) < tracer id=31199 tags=download_handler args= $ sysdig -r capture.scap -c fdbytes_by "evtin.span.tags"8.82G of I/O on
Bytes evtin.span.tags
--------------------------------------------------------------------------------
8.82G download_handler.download_write
10.59KB empty_handler.empty_headers
9.83KB download_handler.download_headers
7.04KB fib_handler.fib_headers
3.78KB fib_handler.fib_writedownload_handler.download_writes, it did a lot of I/O indeed!Was this disk I/O or network I/O? Again filters to the rescue. Let's see network traffic first:$ sysdig -r capture.scap -c fdbytes_by "evtin.span.tags" "fd.type=ipv4"And now disk I/O:
Bytes evtin.span.tags
--------------------------------------------------------------------------------
3.94G download_handler.download_write
6.57KB empty_handler.empty_headers
6.11KB download_handler.download_headers
4.49KB fib_handler.fib_headers
3.78KB fib_handler.fib_write$ sysdig -r capture.scap -c fdbytes_by "evtin.span.tags" "fd.type=file"But I'm particularly interested in finding out which were the files that this download_handler was serving and how much I/O generated each:
Bytes evtin.span.tags
--------------------------------------------------------------------------------
4.87G download_handler.download_write
3.91KB empty_handler.empty_headers
3.72KB download_handler.download_headers
2.55KB fib_handler.fib_headers$ sysdig -r capture.scap -c fdbytes_by fd.name "fd.type=file and evtin.span.tag[0]=download_handler and fd.directory!=/dev/pts"Interesting! from all the files the download_handler is serving we have identified one which generated way more I/O than the rest:
Bytes fd.name
--------------------------------------------------------------------------------
4.82G /tmp/blob.bin.4
21.00M /tmp/blob.bin.2
16.00M /tmp/blob.bin.1
15.00M /tmp/blob.bin.3/tmp/blob.bin.4. What do these files look like?$ ls -lh /tmp/blob.bin.*Bingo! the reason for the slow down is this big (512M) file being sent over the network.
-rw-r--r-- 1 root root 1.0M Dec 14 10:50 /tmp/blob.bin.1
-rw-r--r-- 1 root root 1.5M Dec 14 10:50 /tmp/blob.bin.2
-rw-r--r-- 1 root root 1.3M Dec 14 10:50 /tmp/blob.bin.3
-rw-r--r-- 1 root root 512M Dec 14 10:50 /tmp/blob.bin.4
Summary
When trying to find performance bottlenecks in your application, traditional operating system tools are sometimes not enough as they have a limited visibility of what's happening.Today we learned how to combine system calls profiling with code transaction tracing to analyze the performance and find why slow requests are happening in a simple application.Instead of dealing with complex profiling solutions, Sysdig Tracers tags different spans of your code and these tags can be used to filter the syscalls, do aggregations and reporting like we already know with Sysdig.Download this example from GitHub and install Sysdig to start profiling your applications code. Find those bottlenecks and kill them all!