
Sysdig recently launched Teams, a way to create service-based access control across your monitoring environment. The idea was simple and powerful: Teams of developers want to isolate and focus on the analytics data, dashboards, and alerts that are relevant to their team. Operators want multi-tenant monitoring for their platforms, whether it’s Kubernetes, Docker, or others. As your environment and team grow, shrinks, or moves, your monitoring environment adapts.
It’s proven to be quite popular with our users so far. Some of the common use cases have been splitting out dev/test/prod, isolating monitoring and performance data per service, and also isolating data for each of our customer’s users.
Great… but we wanted to push things further. What if we could automate the set-up of a multi-tenant monitoring environment like developers automate application set-up with Kubernetes?
Teams in Kubernetes – Automated Multi-tenant Monitoring
This would make it even simpler for operations teams to get dev teams up and running, with a monitoring environment tuned to what they need. Think about it… set up a new microservice deployment via Kubernetes and you instantly have the right monitoring dashboards and alerts defined, and you’ve given access to the right team of folks. As you might have guessed, we built this! Let me show you.
If you’re new to Sysdig, it’s important to know that we’re specialists in monitoring Docker containers and the orchestrators that control them. Read this for more background on how we monitor Kubernetes.
OK, given we can already monitor anything that Kubernetes is running, how do we know when it’s time to set up a new team? Enter Kubewatcher.
Kubewatcher
Kubewatcher is a small service that synchronizes your Sysdig Teams settings with details from your Kubernetes infrastructure. The script acts as a bridge between the Kubernetes API and the Sysdig Cloud Teams framework. It continuously polls the Kubernetes API for changes and reflects the changes into the Sysdig Cloud user’s Teams structure.
By using Kubernetes annotations, the user can decorate Kubernetes namespaces, deployments, and services with configurations that will be recognized by the script. As the annotations appear or change, Kubewatcher understands these decorations, tracks their changes, and applies them to Sysdig Cloud by using the Sysdig Cloud Python API.
Kubewatcher is pretty simple, with just a few configurable parameters in kubewatcher.yaml:
- SDC_ADMIN_TOKEN – The Sysdig Cloud API Token of an admin user in your environment. This is needed because only admin users are capable of creating and configuring monitoring Teams.
- SDC_URL (optional) – The URL you use to access Sysdig Cloud. The default is set for SaaS users but will need to be changed if you have a Sysdig Monitor on-premise install.
- TEAM_PREFIX (optional) – A string that will be prepended to the names of Teams and Notification Channels automatically created by Kubewatcher. This will make them easier to identify in the Sysdig Cloud UI.
From inside the pod where it runs, Kubewatcher will automatically attempt to contact the Kubernetes API server at the DNS name Kubernetes using the credential and certificate bundle as described in the Kubernetes docs.
Then install with:
# kubectl create -f kubewatcher.yaml
Teams with Kubernetes annotations
In order to walk you through this whole experience, let me first show you our complete environment. Below you’ll see a screenshot of our Kubernetes-based environment. Using Sysdig Monitor, we can get a logical view of our Docker containers, aggregated by the Kubernetes namespace/deployment/replicaset/pod hierarchy.
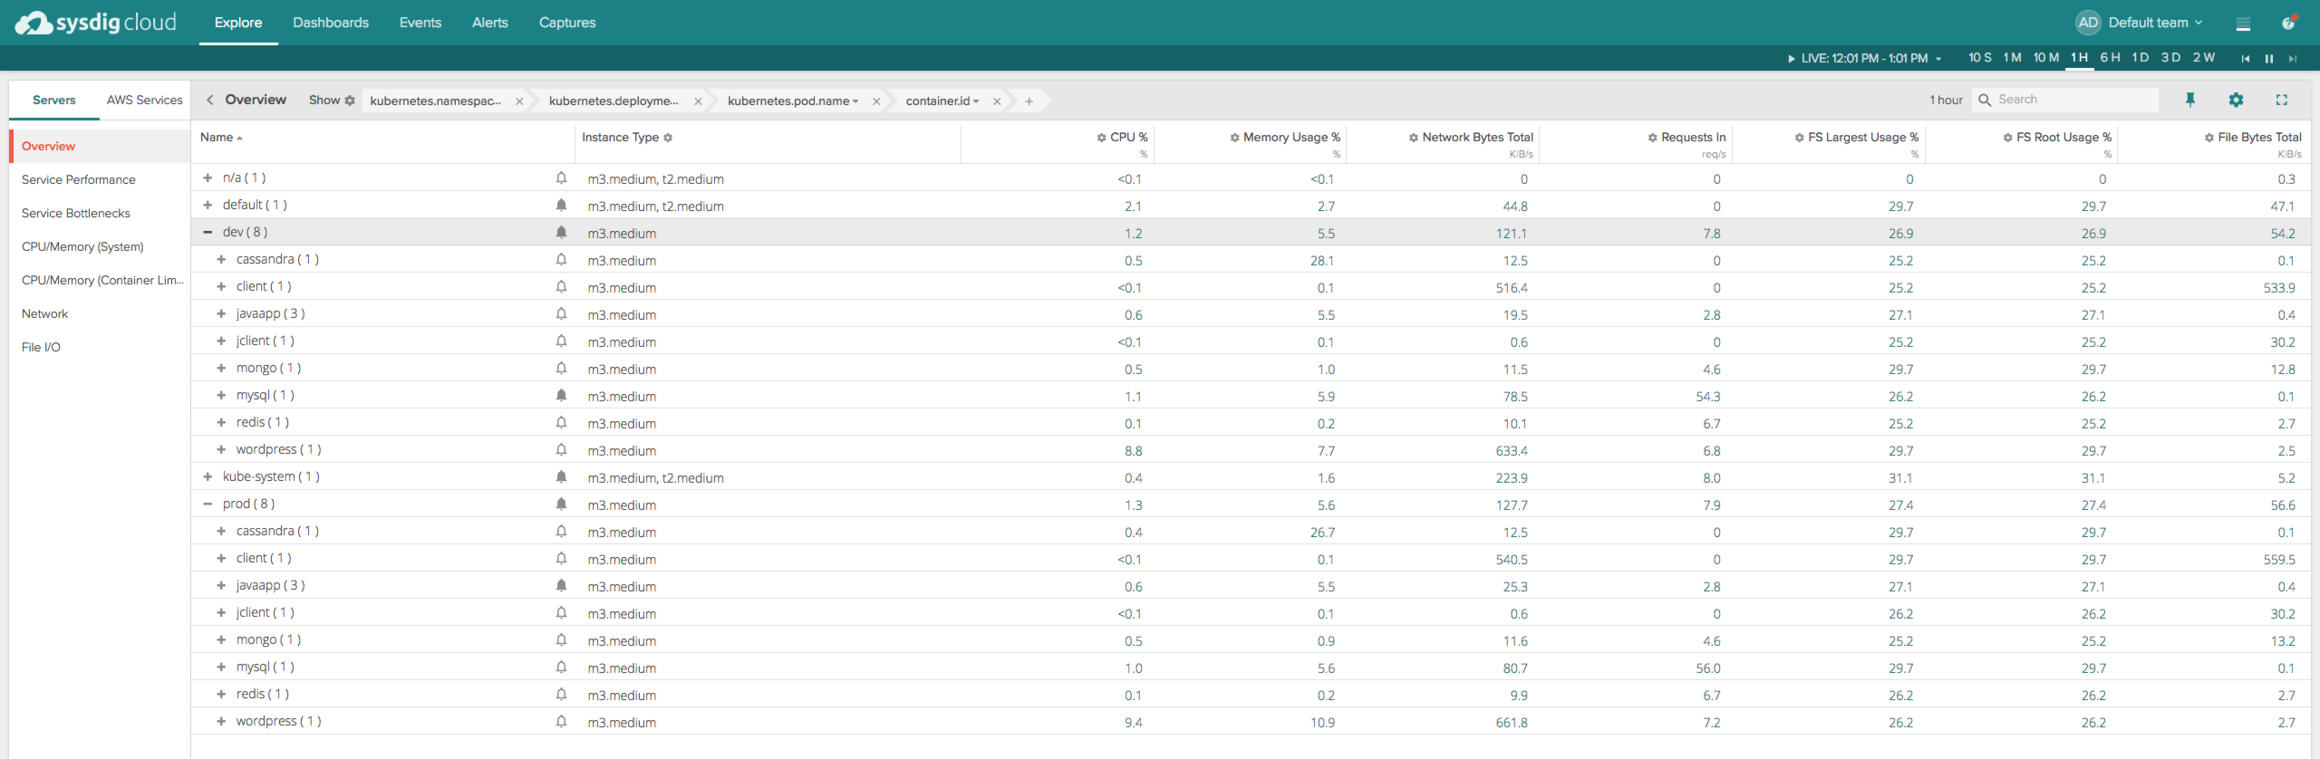
As you can see, we have a dev and prod namespace, and multiple deployments within each one. Let’s suppose we wanted to create a Team just for our front-end deployment, ie, our WordPress application.
The gist below is an excerpt of a manifest file.
Note the annotations on the deployment that set up Kubernetes team members with access to monitoring dashboards and alerts. If a team member (ie email address) included doesn’t already have a Sysdig account, the user will be invited to create an account. I’d like to say more here…. But you’re done!
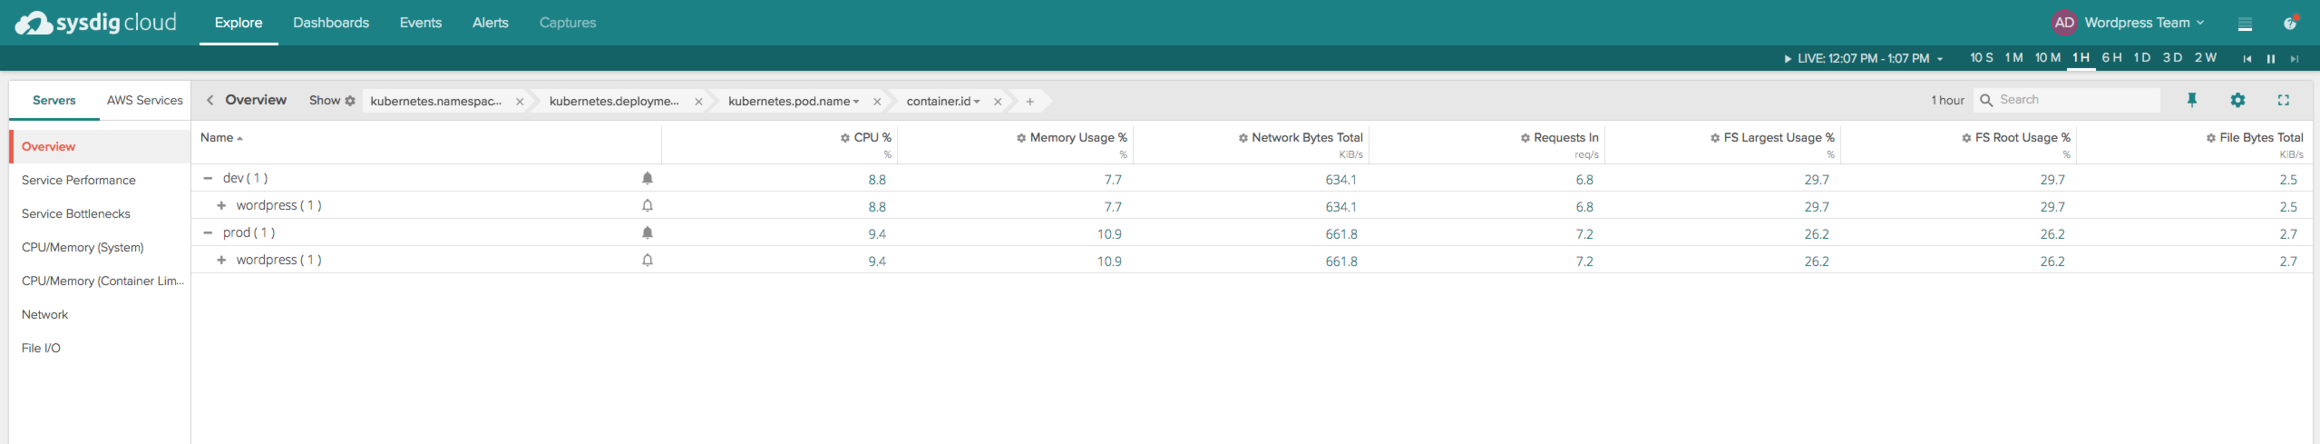
If you now log in as one of those users, you’ll see the below. Notice how you’re limited to the WordPress deployments (regardless of the namespace).
You can use any mix and match of metadata to create teams. Imagine using AWS region information with Kubernetes data combined with custom docker labels, or anything else to create teams.
Creating Kubernetes alerts with annotations
Creating alerts is possible in the same manner, albeit slightly more complex annotations. The beauty of doing this is, if you’ve got best practices in place for your teams about which alerts you want to start with, you can have it all in place from day 1. Again, a manifest excerpt:
Notice that we’ve defined multiple alerts, including one that uses multiple thresholds. One had to do with the response time of the application, and the other had to do with underlying resource utilization. At provisioning, these alerts will be in place and ready to route to the users’ location of choice.
If you want to watch this glorious experience in YouTube HD, look no further:
Results
Sysdig Teams for Kubernetes provide you a simple way to set up isolated, dynamic, service-based monitoring in Kubernetes environments for your development and operations teams. Our effective integration with Kubernetes and other orchestrators like Docker Swarm and DC/OS means you can also automatically define those monitoring environments alongside your applications in an easy and standardized way.
For more tips on how to think about monitoring microservice environments, check out our paper: “The Five Principles of Monitoring Microservices.” Or, if you’re more of a “see it to believe it” person, just start a trial of Sysdig and see teams for yourself!