


Falco Feeds extends the power of Falco by giving open source-focused companies access to expert-written rules that are continuously updated as new threats are discovered.

Kubernetes security logging primarily focuses on orchestrator events. The Kubernetes documentation provides a good starting point for auditing events of the Kubernetes API. Using Sysdig Falco and Fluentd can provide a more complete Kubernetes security logging solution, giving you the ability to see abnormal activity inside application and kube-system containers. If you're unfamiliar with Falco, you can learn more over on the Falco project page.
Kubernetes logging: ELK vs EFK
You might already be familiar with the term "ELK stack" or rather Elasticsearch, Logstash, and Kibana. ELK stacks have been part of the "standard" DevOps tool stack for sometime. Replacing Logstash with Fluentd seeks to improve upon some of the limitations of Logstash such as buffering, declarative event routing, and memory overhead. Fluentd is also part of the Cloud Native Computing Foundation, and is used by different Kubernetes distributions as the default logging aggregator. You can learn more about the benefits of Fluentd on the Fluentd project site.
Collecting Security Events with ElasticSearch + Fluentd
To get started collecting security events, we'll need to deploy an EFK stack on Kubernetes. Luckily Kubernetes provides an add-on for deploying an EFK stack. In our example, we're using Google Kubernetes Engine, and deploying our stack to their Kubernetes version 1.8.8-gke.0. To deploy Falco and our EFK stack, we made the following changes to the default deployment options of GKE:
- Memory and CPU: Elasticsearch was overwhelming the default 1 core, 3.5 GB ram machine type. We went with a
n1-standard-4(4 vCPUs, 15 GB memory) machine type, but an1-standard-2(2 vCPUs, 7.5 GB memory) should be sufficient. - Node image: Ubuntu – The kernel module Falco uses to collect data requires Ubuntu.
- Stackdriver Logging: Disabled – This option installs Fluentd to ship logs to Stackdriver. Since this is instance of Fluentd is managed by GKE, we opted to install our own version.
Additionally we needed to Grant our Kubernetes user account the ability to create authorization roles. GKE enables RBAC by default, and you need additional privileges to create authorization roles. This is a common first step when configuring a GKE cluster.The addon for the EFK stack has been updated for Kubernetes 1.9. Since we are running on 1.8.8-gke.0 we need to change the API version for a few of the Kubernetes Resources. If you don't make these changes, Kubernetes will throw the following error.fluentd-elasticsearch$ kubectl create -f kibana-deployment.yamlTo specify the correct API version, update the below files as shown (- the old line, + the new line).
Error from server (BadRequest): error when creating "kibana-deployment.yaml": Deployment in version "v1" cannot be handled as a Deployment: no kind "Deployment" is registered for version "apps/v1"/cluster/addons/fluentd-elasticsearch/es-statefulset.yamlAfter you make this change, you can deploy your EFK stack. Elasticsearch takes the longest to start, and other services and dependent on it so start it first.
roleRef:
apiGroup: ""
---
# Elasticsearch deployment itself
-apiVersion: apps/v1
+apiVersion: apps/v1beta2
kind: StatefulSet
metadata:
name: elasticsearch-logging
/cluster/addons/fluentd-elasticsearch/fluentd-es-ds.yaml
roleRef:
-apiVersion: apps/v1
+apiVersion: apps/v1beta2
kind: DaemonSet
metadata:
name: fluentd-es-v2.0.4
/cluster/addons/fluentd-elasticsearch/kibana-deployment.yaml
-apiVersion: apps/v1
+apiVersion: apps/v1beta2
kind: Deployment
metadata:
name: kibana-loggingfluentd-elasticsearch$ kubectl create -f es-service.yamlBecause this is a Statefulset, Kubernetes will deploy the first pod, wait for it to be ready, then deploy the next pod. While Elasticsearch starts we can deploy Fluentd and Kibana.
service "elasticsearch-logging" created
fluentd-elasticsearch$ kubectl create -f es-statefulset.yaml
serviceaccount "elasticsearch-logging" created
clusterrole "elasticsearch-logging" created
clusterrolebinding "elasticsearch-logging" created
statefulset "elasticsearch-logging" createdfluentd-elasticsearch$ kubectl create -f fluentd-es-configmap.yamlIt will take a few minutes for the EFK Stack to stabilize. Tailing the logs (
configmap "fluentd-es-config-v0.1.4" created
fluentd-elasticsearch$ kubectl create -f fluentd-es-ds.yaml
serviceaccount "fluentd-es" created
clusterrole "fluentd-es" created
clusterrolebinding "fluentd-es" created
daemonset "fluentd-es-v2.0.4" createdkubectl logs -f ) for the Elasticsearch Pods will show when the two Pods have discovered each other. The Fluentd Pods logs will show when the Pods have successfully connected to the Elasticsearch Service. The Kibana UI is exposed as a cluster service and can be accessed via the by the URL http://127.0.0.1:8001/api/v1/namespaces/kube-system/services/kibana-logging/proxy/. This will give you a page that asks to choose an index, which we will do when we create our security events dashboard. Collect logs of abnormal behavior in #Kubernetes deployed applications with @Sysdig Falco and @fluentd Click to tweet
Kubernetes Security Logging with Falco
Falco can be deployed as a Daemonset on Kubernetes. Falco's configuration and rules are stored in a Configmap that is mounted on each Pod. For a walkthrough on deploying Falco refer to the Sysdig blog post or the Falco Daemonset example on Github. You'll need to:
- Clone the Falco Daemonset example
- Create the Falco account, cluster role, and cluster role binding
- Copy the Falco config and rules.
- Enable JSON output for alerts in the Falco config. Fluentd will collect any output to stdout and send it to Elasticsearch. Having the alert output in JSON format allows Elasticsearch to parse the alert fields.
- Create the Falco Configmap.
- Create the Falco Daemonset.
- Verify the installation by running an interactive shell on a Falco Pod and examining the Pod's logs.
- Create the
falco-event-generator-deploymentDeployment to populate the EFK stack with Falco alert data. This will create a large amount alerts, about 2,800 per hour.
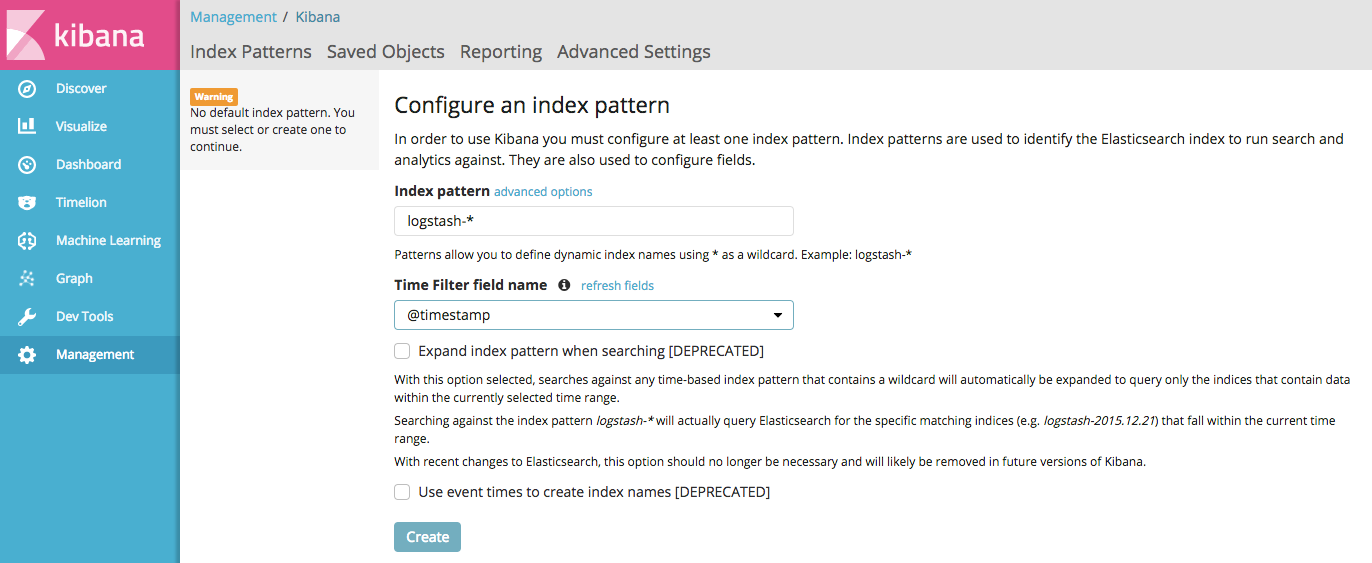
Now that we have our Falco Daemonset and EFK Stack running, we can configure Kibana to make it aware of our Elasticsearch index. Accessing the Kibana dashboard will present you with a page to configure the Index. The Fluentd add on we are using is configured to emulate logstash. That means we can accept the default logstash-* that Kibana gives us as shown.
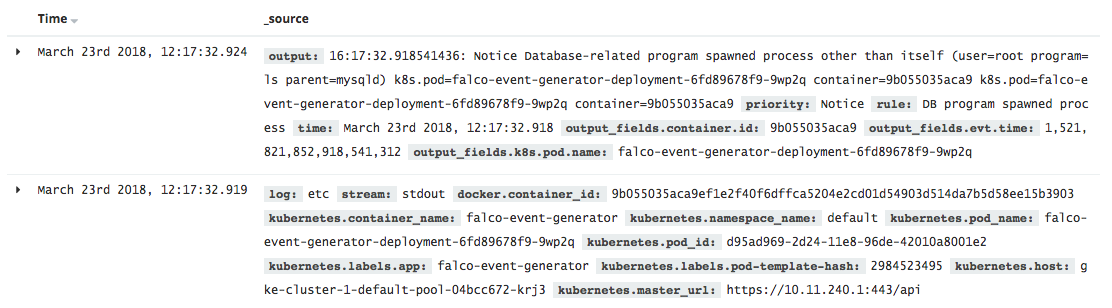
If everything is working as expected, we should see alerts from Falco in Kibana's Discover view.
Filtering on Falco Security Events
Now that we have our EFK stack running and capturing alerts from Falco, we'll start to create the actual visualizations and dashboards. To create visualizations for our dashboard we first need to create a saved search to filter for our Falco security events. It's easiest to filter on kubernetes.container_name: falco and that the priority field exists. This allows us to filter stdout messages from Falco that are not alerts. To filter on a field, expand a row and click the magnifier as shown.

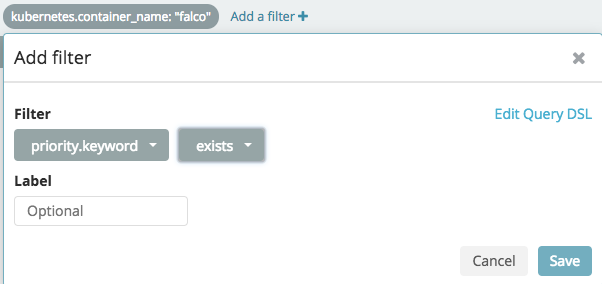
You can also add filters by clicking + Add filter, as shown below for the priority:exists filter.
The Discover view should now be filtered to show only Falco alerts. This filtering should be saved as a search so that it can later be used to build visualizations. Click Save on the top of the Kibana screen and give the saved search a name such as "Falco Alerts".
Kubernetes Security Event Visualizations in Kibana
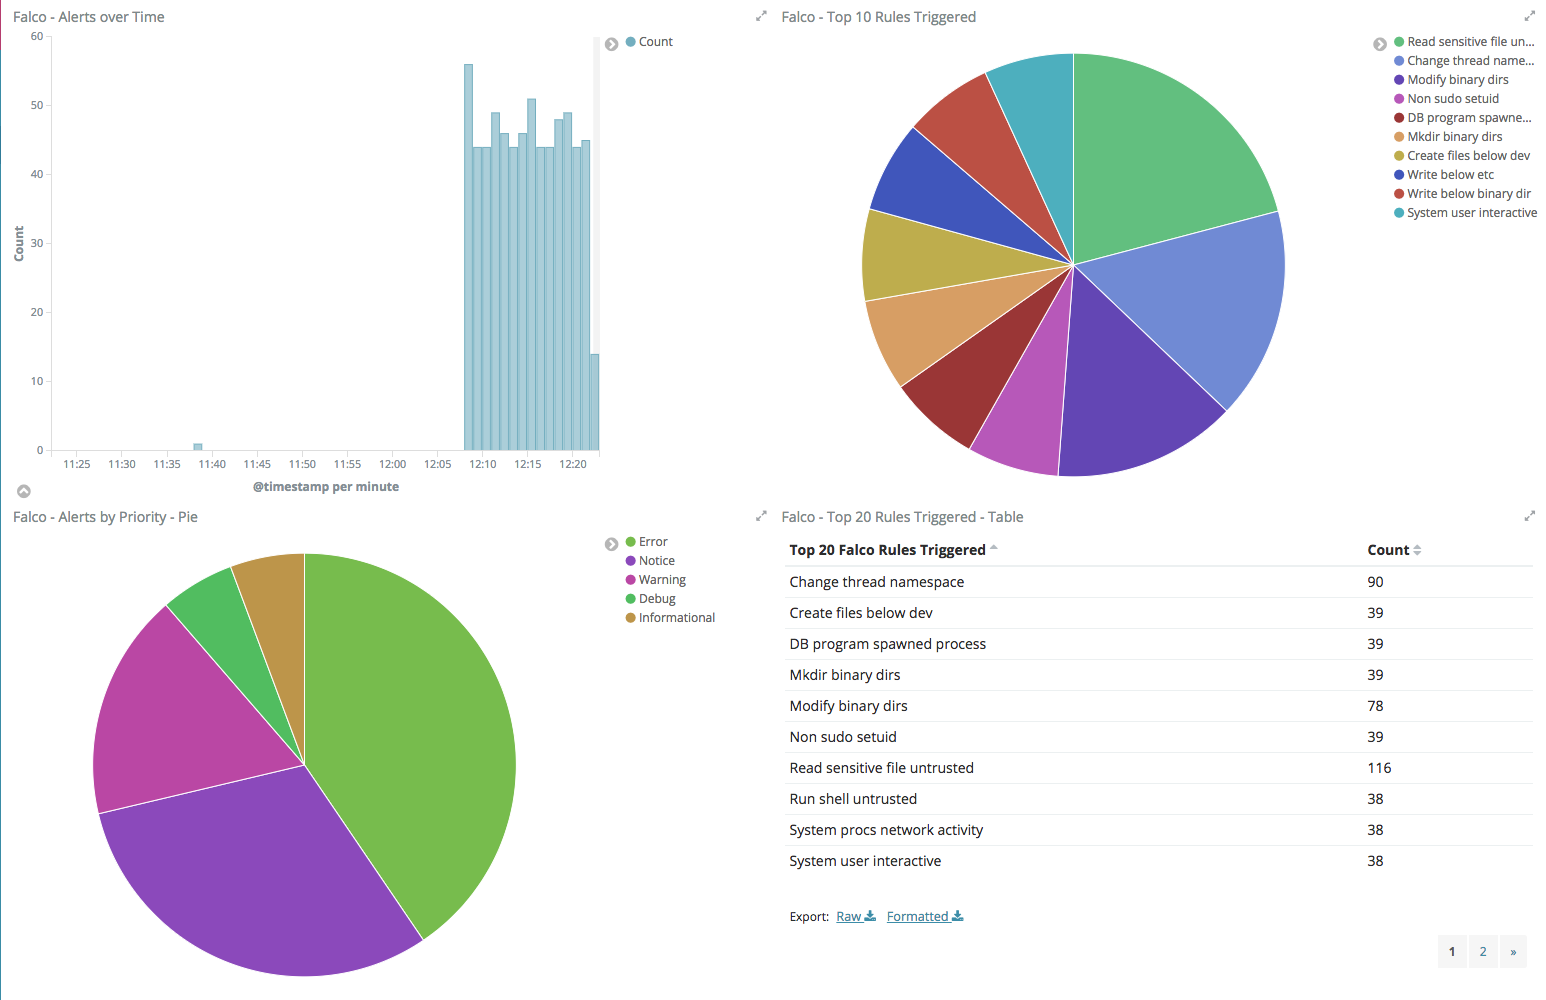
Visualizations in Kibana allow you to create graphs, charts, tables, etc of your data to allow you to make sense of it. For our security events dashboard we created the following visualizations (the options we chose for each are shown below):
- Area chart of all Falco alerts over time.
- Aggregation: Date Histogram
- Field: @timestamp
- Interval: Minute
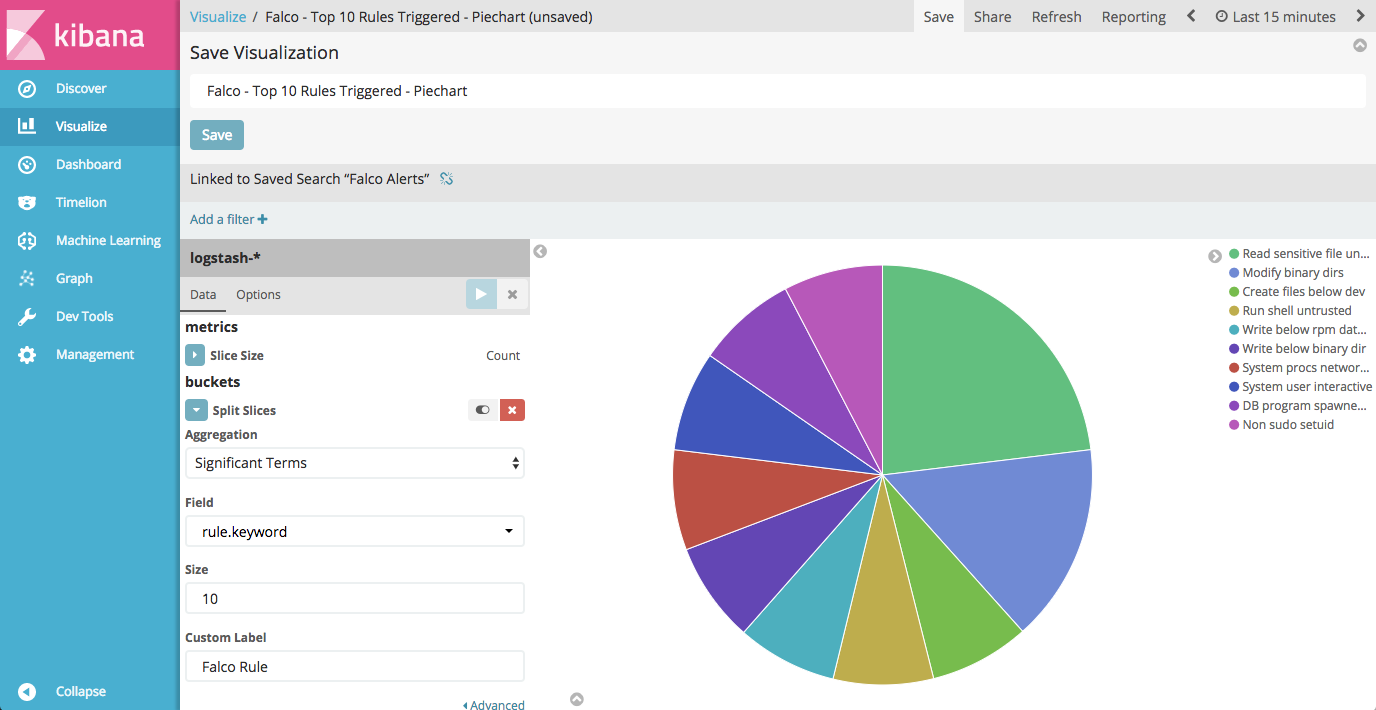
- Pie chart of top 10 Falco rules triggered.
- Split Slices
- Aggregation: Significant Terms
- Field: rule.keyword
- Count: 10
- Pie chart of alerts by priority.
- Split Slices
- Aggregation: Significant Terms
- Field: priority.keyword
- Count: 10
- Table of top 20 Falco rules triggered.
- Split Rows
- Aggregation: Significant Terms
- Field: rule.keyword
- Count: 20
- Table of Falco alerts by Kubernetes Node
- Split Rows
- Aggregation: Significant Terms
- Field: kubernetes.host.keyword
- Count: 20
- Table of Falco alerts by Kubernetes Pod
- Split Rows
- Aggregation: Significant Terms
- Field: output_fields.k8s.pod.name.keyword
- Count: 20
Create our Falco Security Event Dashboard
Now that we have different visualizations in Kibana, we can use them to create a Dashboard. Creating a Dashboard in Kibana is simple, you simply need to click "Add" on the Dashboard view, then click "Add" again to be presented with a list of your available visualizations. Selecting a visualization will add it to your dashboard. You can resize the visualization once it's on the dashboard, reorder the visualizations, etc. We added the visualizations in the following order:
- Area chart of all Falco alerts over time.
- Pie chart of top 10 Falco rules triggered.
- Pie chart of alerts by priority.
- Table of top 20 Falco rules triggered.
- Table of Falco alerts by Kubernetes Node
- Table of Falco alerts by Kubernetes Pod
Another nice feature of Kibana dashboards is the ability to add a saved search. Doing so allows us to drill down into our data by clicking on any of the aggregations in our visualizations. If you click on "Saved Search" in the "Add Panel" section, you can add the "Falco Alerts" search to our dashboard.
With this saved search in our dashboard, we can drill down into individual rules, priorities, Kubernetes Nodes, or even individual pods to see the Falco alerts relevant for that filter.
Learning More
As we've seen, the combination of Falco and Fluentd provide a robust solution to Kubernetes security logging, and provide a powerful tool in detecting abnormal system behavior. In the world of containers, immutable infrastructure, and microservices, Falco can help ensure that deployed applications are following security best practices of Cloud Native.Need more info? Check out the Falco documentation on the GitHub wiki, or join the conversation on the Sysdig Slack team.
Special Thanks
We at Sysdig would like to thank Jean-Philippe Lachance who shared with us the work he did with Falco and Fluentd, as well as visualizations he created in Kibana. His work formed the basis of this blog post, and is a great example of sharing in the open source spirit.