


Falco Feeds extends the power of Falco by giving open source-focused companies access to expert-written rules that are continuously updated as new threats are discovered.

In this article, you will learn how to monitor kube-proxy to ensure the correct health of your cluster network. Kube-proxy is one of the main components of the Kubernetes control plane, the brains of your cluster.
One of the advantages of Kubernetes is that you don't worry about your networking or how pods physically interconnect with one another. Kube-proxy is the component that does this work.
Keep reading to learn how you can collect the most important metrics from kube-proxy and use them to monitor this service.
What is kube-proxy?
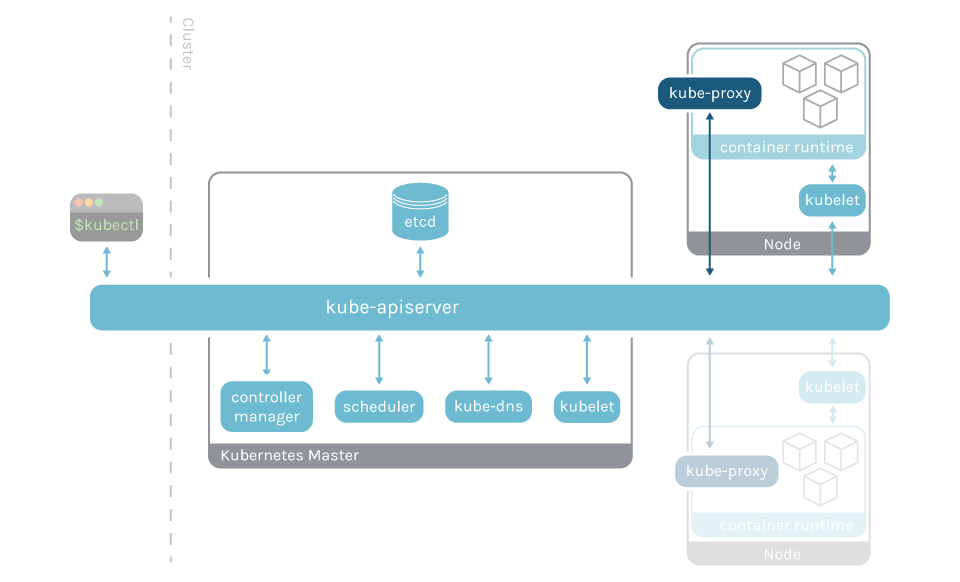
Kube-proxy is an implementation of a network proxy and a load balance that serves as the link of each node with the api-server. It runs in each node of your cluster and allows you to connect to pods from inside or outside of the cluster.
How to monitor kube-proxy
You'll have to monitor kube-proxy, under the kube-system namespace, on all of the cluster nodes except the master one.
Getting metrics from kube-proxy
Like the rest of Kubernetes control plane parts, the kube-proxy is instrumented with Prometheus metrics, exposed by default in the port 10249. This metrics endpoint can be easily scraped, obtaining useful information without the need for additional scripts or exporters.
As the metrics are open, you can just scrape each kube-proxy pod with curl:
It will return a long list of metrics with this structure (truncated):
If you want to configure a Prometheus server to scrape kube-proxy, just add the next job to your scrape configuration:
Remember to customize it with your own labels and relabeling configuration as needed.
Monitor kube-proxy: What to look for?
You should use Golden Signals to monitor kube-proxy; Golden Signals is a technique to monitor a service through the metrics that give the right insights on how it's performing for the customer. These metrics are latency, requests, errors, and saturation.
Disclaimer: kube-proxy metrics might differ between Kubernetes versions. Here, we used Kubernetes 1.18. You can check the metrics available for your version in the Kubernetes repo (link for the 1.18.3 version).
Kube proxy nodes are up: The principal metric to check is if kube-proxy is running in each of the working nodes. Since Kube-proxy runs as a daemonset, you have to ensure that the sum of up metrics is equal to the number of working nodes.
An example alert to check Kube-proxy pods are up would be:
Rest client latency: It's a good idea to check the latency for the client request; this information can be found in the metric rest_client_request_duration_seconds_bucket:
This alert will warn you if there are more than 60 slow POST requests in your cluster network in the last five minutes:
Rule sync latency: The kube-proxy is synchronizing its network rules constantly between nodes. It's a good idea to check how long this process takes, because if it increases, it can cause the nodes to be out of sync.
Code of the requests: You should monitor the HTTP response codes of all the HTTP requests in the cluster. Something wrong is happening if the number of requests with errors rise.
For example, to warn on a rising number of requests with code 5xx, you could create the following alert:
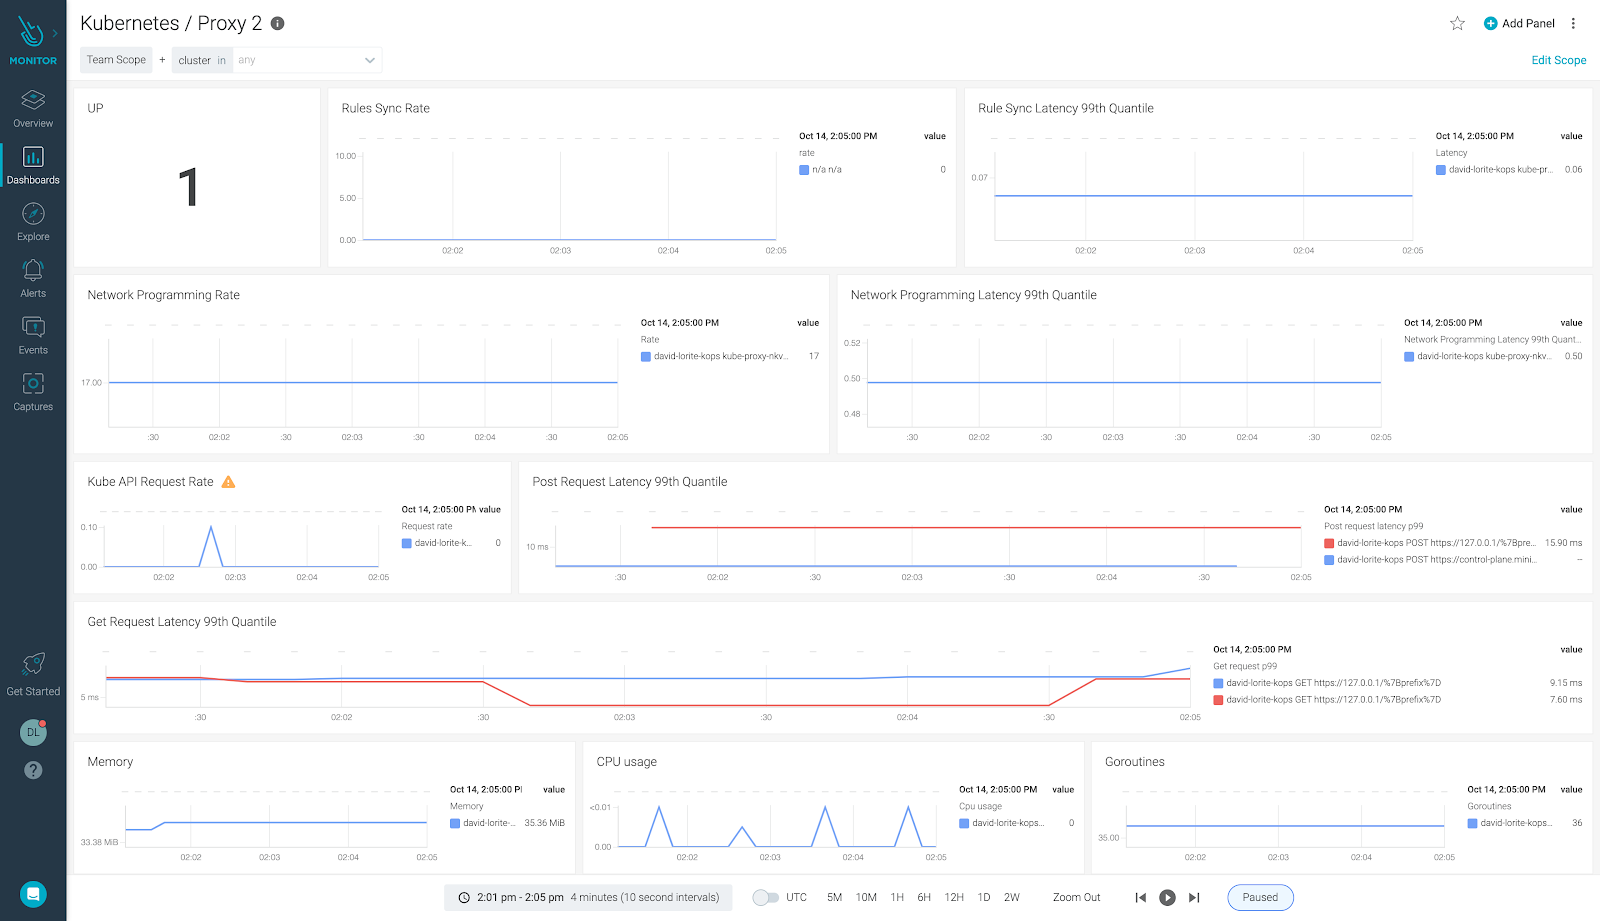
Monitor kube-proxy metrics in Sysdig Monitor
In order to track kube-proxy in Sysdig Monitor, you have to add some sections to the Sysdig agent YAML configuration file, and use a Prometheus server to filter the metrics.
You can choose not to use an intermediate Prometheus server, but you have to keep in mind that kube-proxy provides a lot of metrics. You only need a few of them, so this strategy simplifies things a lot.
First of all, you need a Prometheus server up and running.
If you don't have it, then don't worry. Deploying a new Prometheus is as simple as executing two commands. The first is to create a namespace for the Prometheus, and the second is to deploy it with helm 3.
Being the contents of the values.yaml file as follows:
Once Prometheus is up and running, you have to create filtering rules to select the metrics you want. These rules create new metrics with a custom label that is then used by the Sysdig agent to know which metrics should be collected.
You can find the rules on PromCat.io. You can also find all of the steps needed to monitor kube-proxy in Sysdig.
This is an example agent configmap:
Conclusion
The kube-proxy is usually a forgotten part of your cluster, but a problem in kube-proxy can bring down your cluster network. You should know when something weird is happening and be alerted about it.
Monitoring kube-proxy with Sysdig Monitor is easy. With just one tool you can monitor both kube-proxy and Kubernetes. Sysdig Monitor agent will collect all of the kube-proxy metrics, and you can quickly set up the most important kube-proxy alerts.
If you haven’t tried Sysdig Monitor yet, you are just one click away from our free trial!