


Falco Feeds extends the power of Falco by giving open source-focused companies access to expert-written rules that are continuously updated as new threats are discovered.

Intro
JMX (Java Management Extensions) is a set of specifications conceived to monitor and manage Java applications. To implement the JMX technology, you need to create and register MBeans (Managed Beans) as part of your Java code. Using JMX technology and tools, Java application developers can get the dynamic state of the application and use it for performance tuning, troubleshooting and debugging. In this post we will explain how to monitor the existing JMX metrics and attributes, and demonstrate how to create new MBeans in your Java application to publish and monitor custom metrics.
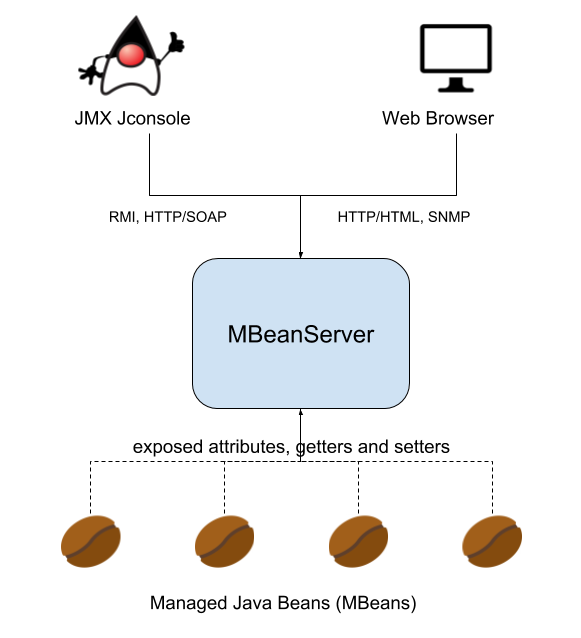
For large applications that, for example, read or write from a database many times per second, it's good practice to provide a monitoring interface like Java Management Extensions instead of logging output messages. Custom Java metrics are easier to maintain, troubleshoot and integrate with external monitoring tools. Any class that exports data to JMX is called a Managed Bean (MBean). These MBeans publish (export) their metrics to a MBean Server provided by the Java platform.
The MBeanServer can be assimilated to a metric collection agent that scrapes the configured endpoints (MBeans) and publishes the metrics exposing different interfaces like Java RMI or HTTP/SOAP.
Monitoring JMX applications – Default MBeans
Class properties exported through MBeans are called attributes, and methods exported through MBeans are called operations.
There is a collection of MBeans and attributes which are already provided by the Java platform out of the box. Let's take a look at the performance and troubleshooting information that we can collect from those classes before creating our own metrics:
LoadedClassCount
MBean: java.lang:type=ClassLoading
This is the number of classes that are currently loaded in the JVM.
If this count keeps increasing you may have a problem with multiple classloaders loading the same classes at different times.
TotalLoadedClassCount
MBean: java.lang:type=ClassLoading
This is the number of classes that have been loaded since the JVM was started.
UnloadedClassCount
MBean: java.lang:type=ClassLoading
Classes are unloaded when the Classloader that loaded them is garbage-collected. This is the number of classes that have been unloaded from the JVM since it was started.
TotalCompilationTime
MBean: java.lang:type=Compilation
TotalCompilationTime is the accumulated time in milliseconds spent in JIT compilation. It can be used to monitor JIT performance in your scenario.
Garbage Collector – CollectionCount
MBean: java.lang:type=GarbageCollector,name=[your GC name]
This is the number of garbage collection events fired since the JVM was launched.
Garbage Collector – CollectionTime
MBean: java.lang:type=GarbageCollector,name=[your GC name]
CollectionTime is the total time spent doing garbage collection in milliseconds and is another good candidate to profile your Java application behaviour.
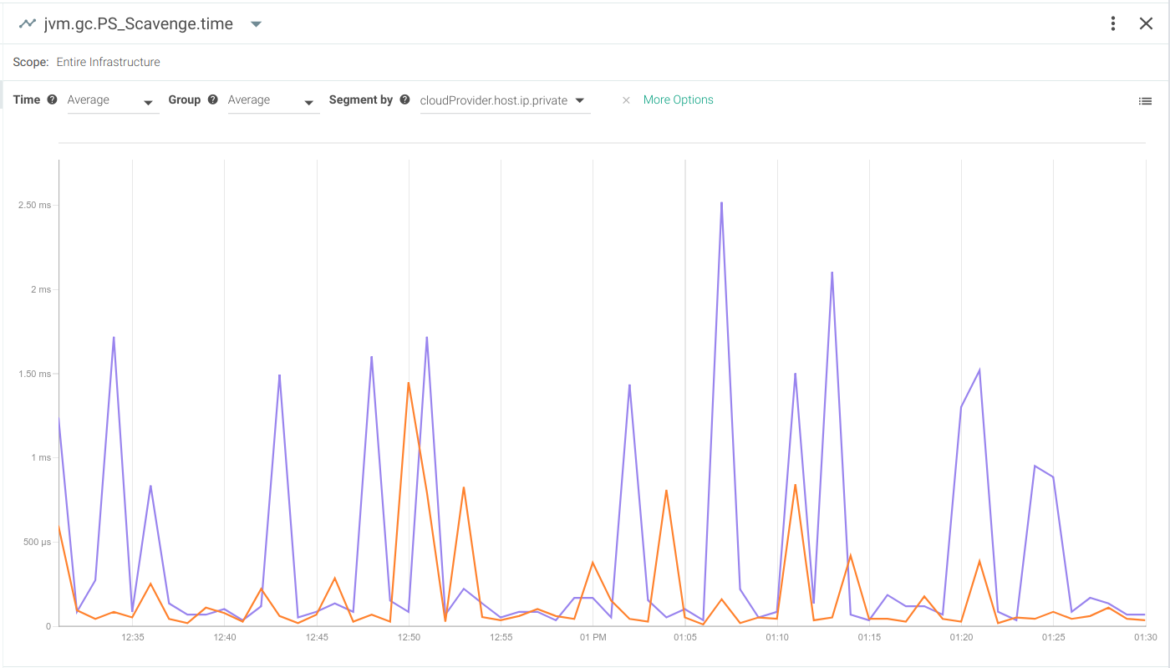
Monitoring Java GC Collection time (PS Scavenge algorithm) with Sysdig Monitor.
Garbage Collector – LastGcInfo
MBean: java.lang:type=GarbageCollector,name=[your GC name]
LastGcInfo is a structure of information about the last garbage collection event performed with the following data:
Arch
MBean: java.lang:type=OperatingSystem
Processor architecture.
AvailableProcessors
MBean: java.lang:type=OperatingSystem
Number of available central processing units.
CommittedVirtualMemorySize
MBean: java.lang:type=OperatingSystem
This represents the amount of memory -in bytes- that is guaranteed to be available for use by the JVM.
FreePhysicalMemorySize
MBean: java.lang:type=OperatingSystem
This represents the amount of memory of free physical memory in the host (free = total – (used + shared + cached + buffered)).
MaxFileDescriptorCount
MBean: java.lang:type=OperatingSystem
This is the number of file descriptors we can have opened in the same process, as determined by the operating system. You can never have more file descriptors than this number.
OpenFileDescriptorCount
MBean: java.lang:type=OperatingSystem
This is the number of opened file descriptors at the moment, if this reaches the MaxFileDescriptorCount, the application will throw an IOException: Too many open files. This could mean you're are opening file descriptors and never closing them. You can monitor this variable, and alert if it approaches the MaxFileDescriptorCount value.
FreeSwapSpaceSize
MBean: java.lang:type=OperatingSystem
FreeSwapSpaceSize is the amount of swap memory -in bytes- still available in the host.
ProcessCpuLoad
MBean: java.lang:type=OperatingSystem
ProcessCpuLoad represents the CPU load in this process.
ProcessCpuTime
MBean: java.lang:type=OperatingSystem
This is the time the CPU has spent running this process.
SystemCpuLoad
MBean: java.lang:type=OperatingSystem
Represents the current load of CPU in the host system.
SystemLoadAverage
MBean: java.lang:type=OperatingSystem
Represents the average load in the host system. Matches with the value given by the command: cat /proc/loadavg | awk '{print $1}'
TotalPhysicalMemorySize
MBean: java.lang:type=OperatingSystem
Host memory size in bytes.
TotalSwapSpaceSize
MBean: java.lang:type=OperatingSystem
Host swap memory size in bytes.
Version
MBean: java.lang:type=OperatingSystem
Host's kernel version. It matches the value given by: uname -r
InputArguments
MBean: java.lang:type=Runtime
The InputArguments are the array of arguments with which the JVM was started.
SpecVersion
MBean: java.lang:type=Runtime
SpecVersion represents the JVM version.
StartTime
MBean: java.lang:type=Runtime
Time JVM started in the Unix Epoch format.
Uptime
MBean: java.lang:type=Runtime
Number of milliseconds the JVM has been running.
DaemonThreadCount
MBean: java.lang:type=Threading
Number of daemon threads running.
PeakThreadCount
MBean: java.lang:type=Threading
Maximum number of threads being executed at the same time since the JVM was started or the peak was reset. This metric (as well as the next two) can be useful in monitoring and profiling the dynamic behaviour of your Java application.
ThreadCount
MBean: java.lang:type=Threading
The number of threads running at the current moment.
TotalStartedThreadCount
MBean: java.lang:type=Threading
The number of threads started since the JVM was launched.
Monitoring a Java application using JMX MBeans and custom metrics
Any non-trivial application require management, monitoring, and if necessary, troubleshooting.
Creating user-defined JMX metrics is the recommended way to do this. We can count the number of active database connections, the http response time for every query, track the number of logged in users, and identify any flaws or bottlenecks within the application.
To show you what this looks like, we are going to implement a simple custom JMX metric into this application to find out how many calls to the endpoint we are receiving in total.
First, clone the example repository:
git clone https://github.com/tembleking/spring-boot-memory-blog.git
There is a .jar file you can run directly, but let's examine the source code first. If you go to the spring-boot-memory-blog/demo/src/main/java/com/example you will see two files:
- GreetingMBean.java: Managed Bean interface
- DemoApplication.java: Application that implements this interface
We need to define an interface with all the information we want to export. Since we want to export the number of greetings our application has received, we'll create a getNumberOfGreetings method. The get will be omitted by JMX by default, so it will be called NumberOfGreetings:
# GreetingMBean.java file
package com.example;

public interface GreetingMBean {
    int getNumberOfGreetings();
}
The interface name must end with MBean and the class must now implement that interface with the desired behaviour. In our case, this looks like:
# DemoApplication.java file, line 53
public String getMessage() {
        numberOfGreetings += 1;
        return this.message;
}
...
# DemoApplication.java file, line 62

@Override
public int getNumberOfGreetings() {
        return numberOfGreetings;
}
To conclude, we must register the class we will monitor:
# DemoApplication.java file, line 25
MBeanServer mBeanServer = ManagementFactory.getPlatformMBeanServer();
ObjectName name = new ObjectName("app:greeting=HelloWorld");
mBeanServer.registerMBean(DemoApplication.greeting, name);
You can compile this application yourself using mvn package in the repo root directory. Or, just execute the pre-packaged jar file:
java -jar demo/target/main-0.0.1-SNAPSHOT.jar
Monitoring Java MBeans with Sysdig Monitor
Sysdig Monitor can collect JMX metrics by directly communicating with the Java process exposing the MBeans. This method has two relevant advantages:
- You don't need to worry about exposing ports, hostnames, firewalls, etc
- You don't need to use Java-specific tooling for monitoring and troubleshooting, you can transparently integrate JMX, statsd and Prometheus metrics in the same platform, creating Dashboards and alerts that use any combination of them.
For example, to collect metrics from this application in particular you just need to edit the Sysdig agent configuration file and append the following yaml block:
jmx:
  per_process_beans:
     spring_jmx:
        pattern: "main-0.0.1"
        beans:
        - query: "app:greeting=HelloWorld,*"
          attributes:
            - name: NumberOfGreetings
              alias: NumberOfGreetigs
The pattern attribute will filter processes based on java process name and the query attribute will filter by Java object name and metrics exposed by this object. In this case we are using a wildcard to collect all the exported metrics. Note that we can also declare alias if you want to rename the original Java string to a more succinct name.
After a few seconds, Sysdig Monitor will pick up the new metric:
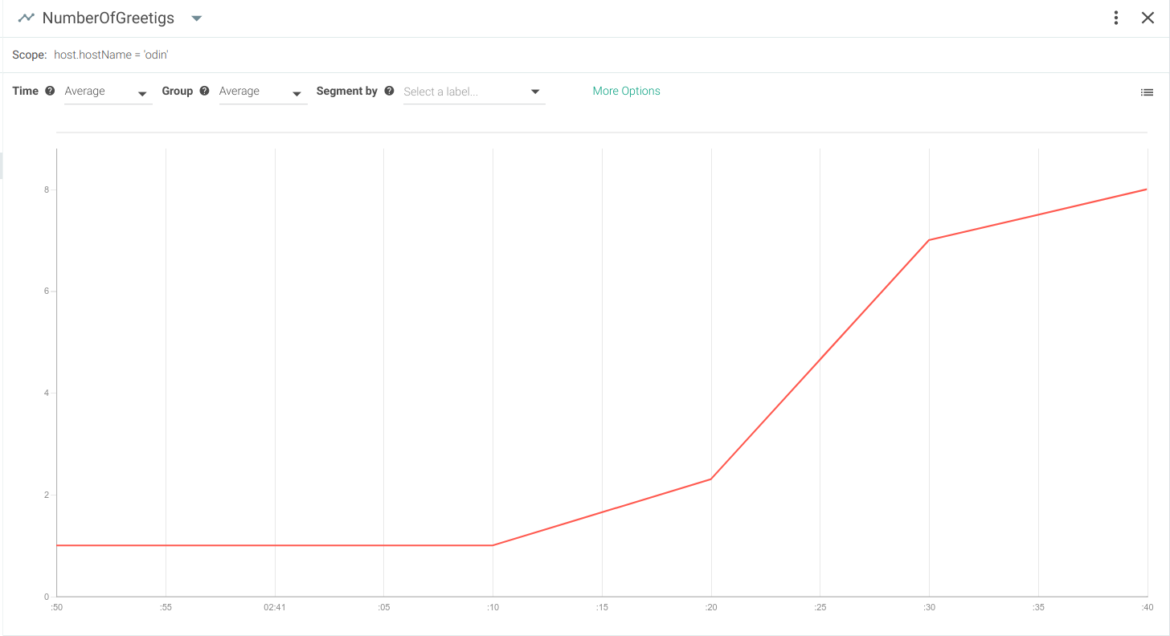
It's important to note that the query syntax allows for dynamic metric autodiscovery. For example, if a new Java process appear with the same bean name but different attributes, these new metrics will automatically show up in your interface without having to modify the configuration or restarting the agent process.
You can look up all the JMX configuration options for Sysdig Monitor here.
Monitoring Java MBeans with Jconsole
Execute jconsole and connect to the local process:
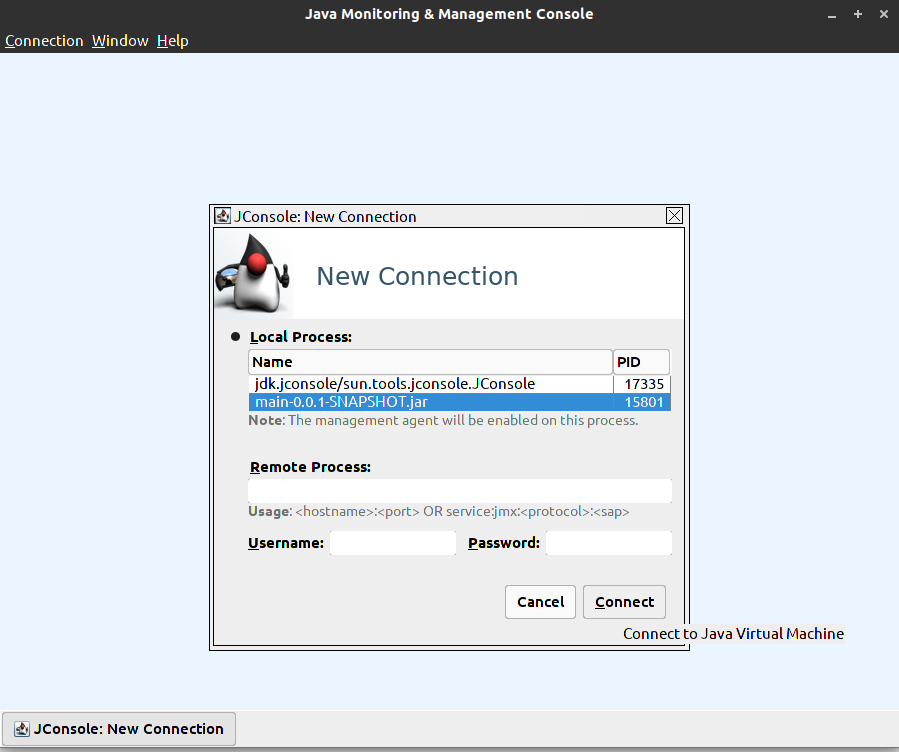
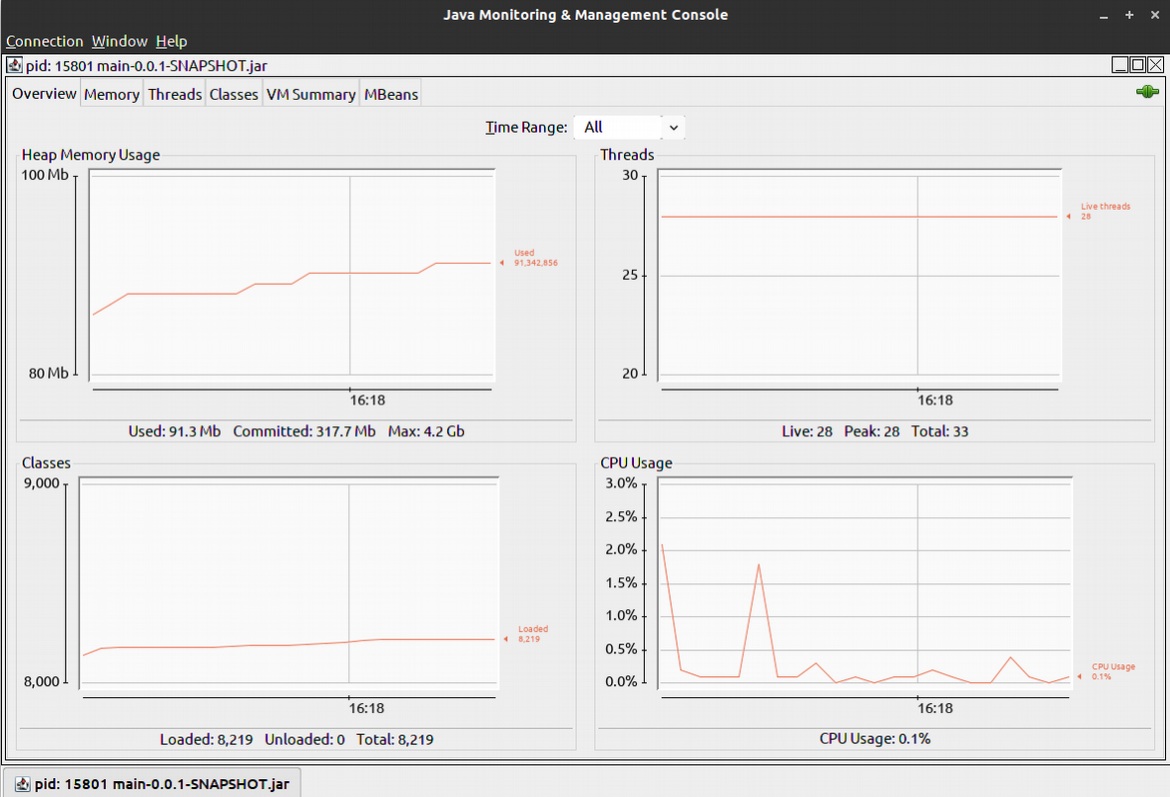
You may receive an insecure connection warning, but it's ok to continue. Now you should be able to monitor all the general JMX and profiling metrics we covered in the previous section:
And of course, the user-defined JMX metrics, as well. Click on the MBeans tab. In the MBeans tree navigate to app -> HelloWorld -> Attributes:
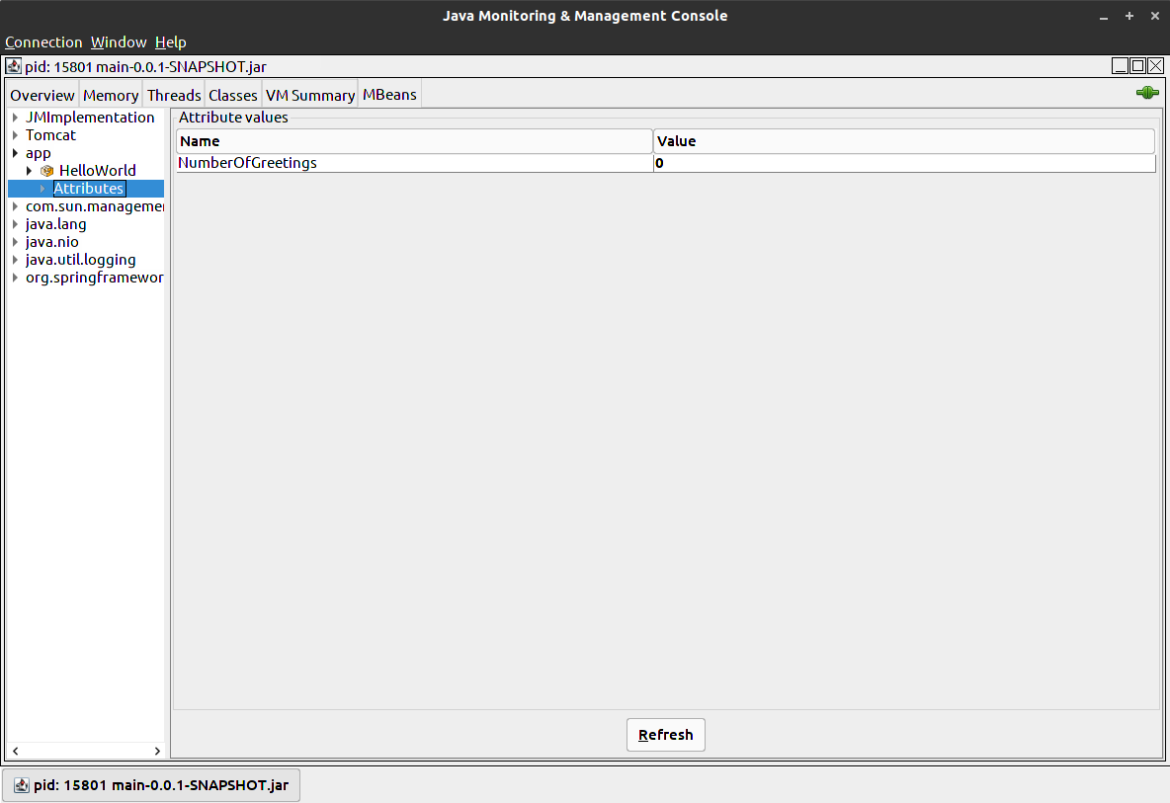
The number of greetings is '0' at the moment. Navigate to http://localhost:8080 (the web port that this Java application is using by default) and refresh as many times as you like. You should be able to see the metric increasing each time you refresh the jconsole interface.
Conclusions
Using Java Monitoring Extensions, you can easily add profiling and application-level monitoring to any of your Java applications. You're also equipped with a set of generic JMX metrics to troubleshoot cpu load, memory usage, class loading and threads.
Want to import JMX metrics from your Java apps but also have other metrics sources like Prometheus or statsd? Sysdig Monitor supports scraping JMX metrics, so you can unify all your metrics and generate dashboards and alerts from a single platform. Using Sysdig's JMX query language you can automatically scrape any new Java processes and metrics that spawn on your environment (for example if you are using service autoscaling with Docker or Kubernetes).