


Falco Feeds extends the power of Falco by giving open source-focused companies access to expert-written rules that are continuously updated as new threats are discovered.

Developers are responsible for creating new, powerful software. This is what we do, day in and day out. But much of the software we create is based on the work of others. It's not only their software from yesterday, but also from years or decades before. That creates a complex set of challenges when it comes to understanding the behavior of our own software, let alone someone else's.
\r\r
In this article I'm going to show you a situation that I ran into recently. It gave me the opportunity to do a little troubleshooting in Linux, and even understand the different ways you can create new processes on Linux.
\r\r
Sysdig host instrumentation
\r\r
First let's recap a little bit how the sysdig open source tool works, as well as our commercial agent that runs on top of it.
\r\r
Our core piece of technology is the sysdig kernel module. It's loaded into the kernel and it traces every system call happening on the host. For more detailed information you can read our previous blog post on this.
\r\r
This flow of events then goes to our sysdig userspace utility that reads them, parses them, and allows you to do filtering and scripting on top. For example sysdig is able to isolate all network related activity of your database, sort processes based on docker containers, or tail the logs of your webserver. You can find a cheatsheet of common tasks here.
\r\r
\r\r
Our commercial product uses an agent built on top of the sysdig technology. But it uses system calls for a different purpose: we aggregate system, application, container, and statsd metrics across thousands of hosts and tens of thousands of containers. These are sent to our backend service, where you chart them, analyze, setup alerts and so on.
\r\r
Ok, enough background, let's get into the story.
\r\r
The tale: statsd is broken
\r\r
Everything started with a customer who was not able to see statsd metrics being collected from our agent. Our agent has a statsd capture capability that should just work – no additional endpoint needed… But it didn't work for our customer. They were using a php-fpm configuration behind nginx.
\r\r
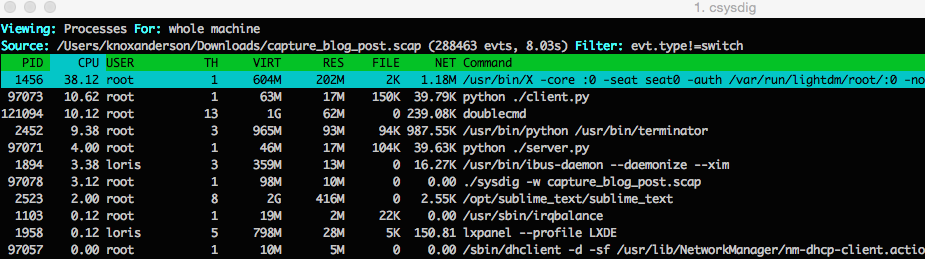
Usually we ask customers to send us a sysdig capture (sysdig -w capture.scap), which is similar to a Wireshark trace though instead of packet info it contains rich system call data.
\r\r(sysdig -w capture.scap)\r\r
With it we can troubleshoot it offline and not require ssh access to their host. But the capture didn't have any issues – our agent was correctly parsing statsd protocol from the system calls.
\r\r
I decided to simulate their environment locally on my host. I launched a setup with nginx + php-fpm using docker-compose. Our agent detected the statsd protocol and was working fine. I was no closer to figuring out why it wasn't working for our customer.
\r\r
Then, I had a lucky breakthrough: by a chance I restarted the php-fpm engine while the agent was running and suddenly statsd wasn't working anymore!
\r\r
So I was able to replicate it, quite good starting point. I now understood that the reason we weren't seeing statsd metrics was that php-fpm didn't have the appropriate container metadata (namely: ID, image name and labels) attached. If statsd traffic does not come from a container our agent does not forward it to our embedded statsd server. That's because non-containerized processes running in the host are able to reach the agent using UDP, so forwarding it would just duplicate data. A bug like this impacts sysdig open source too, so I launched it, filtered for statsd traffic and asked for container metadata (using -pc command line argument):
\r\r# sysdig -pc proc.name = php-fpm and fd.sport = 8125\r
\r
5021 07:22:37.854474986 1 phpfpmalpine_php_1 (d7bb71f7610b) php-fpm (11641:7) < connect res=0 tuple=127.0.0.1:41816->127.0.0.1:8125\r
5022 07:22:37.854475663 1 phpfpmalpine_php_1 (d7bb71f7610b) php-fpm (11641:7) > fcntl fd=5(<4u>127.0.0.1:41816->127.0.0.1:8125) cmd=5(F_SETFL)\r
5023 07:22:37.854475780 1 phpfpmalpine_php_1 (d7bb71f7610b) php-fpm (11641:7) < fcntl res=0(<3t>:::9000)\r
5024 07:22:37.854478368 1 phpfpmalpine_php_1 (d7bb71f7610b) php-fpm (11641:7) > sendto fd=5(<4u>127.0.0.1:41816->127.0.0.1:8125) size=34 tuple=NULL\r
5025 07:22:37.854499400 1 phpfpmalpine_php_1 (d7bb71f7610b) php-fpm (11641:7) < sendto res=34 data=app.metrics.foo:0.38912133891213|g\r
5032 07:22:37.854586118 1 phpfpmalpine_php_1 (d7bb71f7610b) php-fpm (11641:7) > close fd=5(<4u>127.0.0.1:41816->127.0.0.1:8125)\r
5033 07:22:37.854586634 1 phpfpmalpine_php_1 (d7bb71f7610b) php-fpm (11641:7) < close res=0\r
\r\r
Here's what it looked like after restarting php-fm:
\r\r169694 07:22:43.494058726 3 host (host) php-fpm (11830:7) < connect res=0 tuple=127.0.0.1:40687->127.0.0.1:8125\r
169695 07:22:43.494059466 3 host (host) php-fpm (11830:7) > fcntl fd=5(<4u>127.0.0.1:40687->127.0.0.1:8125) cmd=5(F_SETFL)\r
169696 07:22:43.494059628 3 host (host) php-fpm (11830:7) < fcntl res=0(<6>)\r
169697 07:22:43.494062421 3 host (host) php-fpm (11830:7) > sendto fd=5(<4u>127.0.0.1:40687->127.0.0.1:8125) size=34 tuple=NULL\r
169698 07:22:43.494085960 3 host (host) php-fpm (11830:7) < sendto res=34 data=app.metrics.foo:0.71194379391101|g\r
169705 07:22:43.494119291 3 host (host) php-fpm (11830:7) > close fd=5(<4u>127.0.0.1:40687->127.0.0.1:8125)\r
169706 07:22:43.494119602 3 host (host) php-fpm (11830:7) < close res=0\r
\r\r
So the container info is parsed correctly only when sysdig starts and it reads process metadata from /proc (directory) but not if a process starts while sysdig or the agent is running. This didn't happen on the capture file from the customer because it was taken in the former case.
\r\r
How is a bug like this even possible? It couldn't be hidden for so long, so I dug into the new php-fpm process pid and captured all the events related to it. Here I found something odd: the event that creates the process is not clone but fork:
\r\rsysdig -r php-fpm.scap proc.pid = 11830\r
\r
134079 07:22:41.219236734 3 php-fpm (11830) < fork res=0 exe=php-fpm args= tid=11830(php-fpm) pid=11830(php-fpm) ptid=11801(php-fpm) cwd=/var/www/html fdlimit=1048576 pgft_maj=0 pgft_min=0 vm_size=39816 vm_rss=4796 vm_swap=0 comm=php-fpm cgroups=cpuset=/docker/d7bb71f7610b01172a9b87cd09ac04709d4239f2acc73f6e237adbafc30993... flags=0 uid=0 gid=0 vtid=7 vpid=7\r
\r\r
Why fork? On Linux, clone is the system call used to create new processes. And it's the only system call I'd seen used so far.
\r\r
Doing a bit of research I found this nice answer on stackoverflow stating that actually fork is the old system call used in linux to create new processes that has been superseded by clone.
\r\r
Then I went on the code we use to parse the clone event and I found that actually we were parsing cgroups info only on clone events and not fork or vfork.
\r\r
Putting in a fix to parse fork and vfork made everything work.
\r\r
Conclusion
\r\r
This story reminded me a quote by Justin Cormack I heard at QCon London late last year:
\r\r
**
\r\r
Operating systems are just a kind of technical debt
\r\r
**
\r\r
This is absolutely true: Linus Torvald's mantra is "never break userspace". This makes software compatible for a decade and more, making Linux the reliable operating system we trust and love. The downside is that part of the life of a system software engineer is dealing with traces from the past of Linux history.
\r\r
Side note
\r\r
Why php-fpm was using fork? It wasn't the one to blame for it. Alpine linux uses muslc instead of glibc. Digging deeper I found it uses the fork system call to implement the fork() function instead of clone, as glibc does. It's probably because clone is more complicated to use.