


Falco Feeds extends the power of Falco by giving open source-focused companies access to expert-written rules that are continuously updated as new threats are discovered.

Today we announced the launch of enterprise-grade Prometheus monitoring with Sysdig Monitor 3.0. We've added new Prometheus capabilities like PromQL, a Grafana plugin and new enhancements for our already rich Kubernetes monitoring. If you love Prometheus like we do, and especially if your cloud environment is growing quickly, read on to learn more about what we're doing with Prometheus, Kubernetes and more.
Why embrace Prometheus?
Let's tackle this one right up front. We've embraced Prometheus monitoring for two key reasons:
- Firstly, it helps Sysdig Monitor users take advantage of the rich metrics and capabilities Prometheus brings to monitoring – especially for Kubernetes, Docker and microservices. Prometheus makes Sysdig that much better.
- Secondly, it helps Prometheus customers meet requirements in large, complex production environments. with things like backend scale, broad telemetry and event data, long-term data retention, access control and more. Sysdig makes Prometheus that much better.
Simply put, we love Prometheus! Because of this, we've been doing a lot of work around Prometheus. In fact, I'm happy to report that we've started to contribute to the open source project. This in addition to providing capabilities for enterprise customers means even more love for Prometheus.
New Prometheus monitoring, Kubernetes and usability features
As you transition to full-scale production with Kubernetes, Docker or similar, you'll face new requirements. This includes some you perhaps haven't anticipated around monitoring and security. We've designed Sysdig Monitor 3.0 to help Prometheus, Kubernetes and Docker users meet these needs. This includes:
- Scalability: To scale monitoring with a rapidly growing environment with high-churn, high-volume metrics.
- Long(er)-term retention of data: To analyze service trends and metrics over time.
- Multi-cluster, multi-cloud visibility: To monitor, compare, and correlate services across cluster deployments and clouds.
- Capacity planning: To make informed, intelligent choices about where and when to increase or decrease cluster resources based on factors like oversubscription.
- Kube components health/state monitoring: To ensure the foundation of your orchestrated environment is up and performing well.
- Access control and isolation: To limit environment and data access to specific users, groups and teams.
- High availability: To deliver uptime with redundancy and automatic failover.
With this in mind, what I want to do is give you a rundown of what's new with Sysdig Monitor 3.0.
For Prometheus users: Embracing Prometheus metrics, PromQL, Grafana
Sysdig Monitor automatically collects Prometheus metrics. It offers a powerful way to aggregate, store, alert, visualize – and now query Prometheus data. In essence, Sysdig Monitor 3.0 extends what's possible with Prometheus by adding Prometheus Query Language (PromQL) compatibility. For example, PromQL lets users select and aggregate time series data in real time using expressions that can be displayed in dashboards, graphs or tables.
It's important to point out that Sysdig extends PromQL beyond Prometheus metrics! Now DevOps and IT operations teams are able to calculate advanced metrics to meet the unique needs of their enterprise. And, they can do so using any collected metric or event including Prometheus, JMX, StatsD, application, system and orchestration metrics.
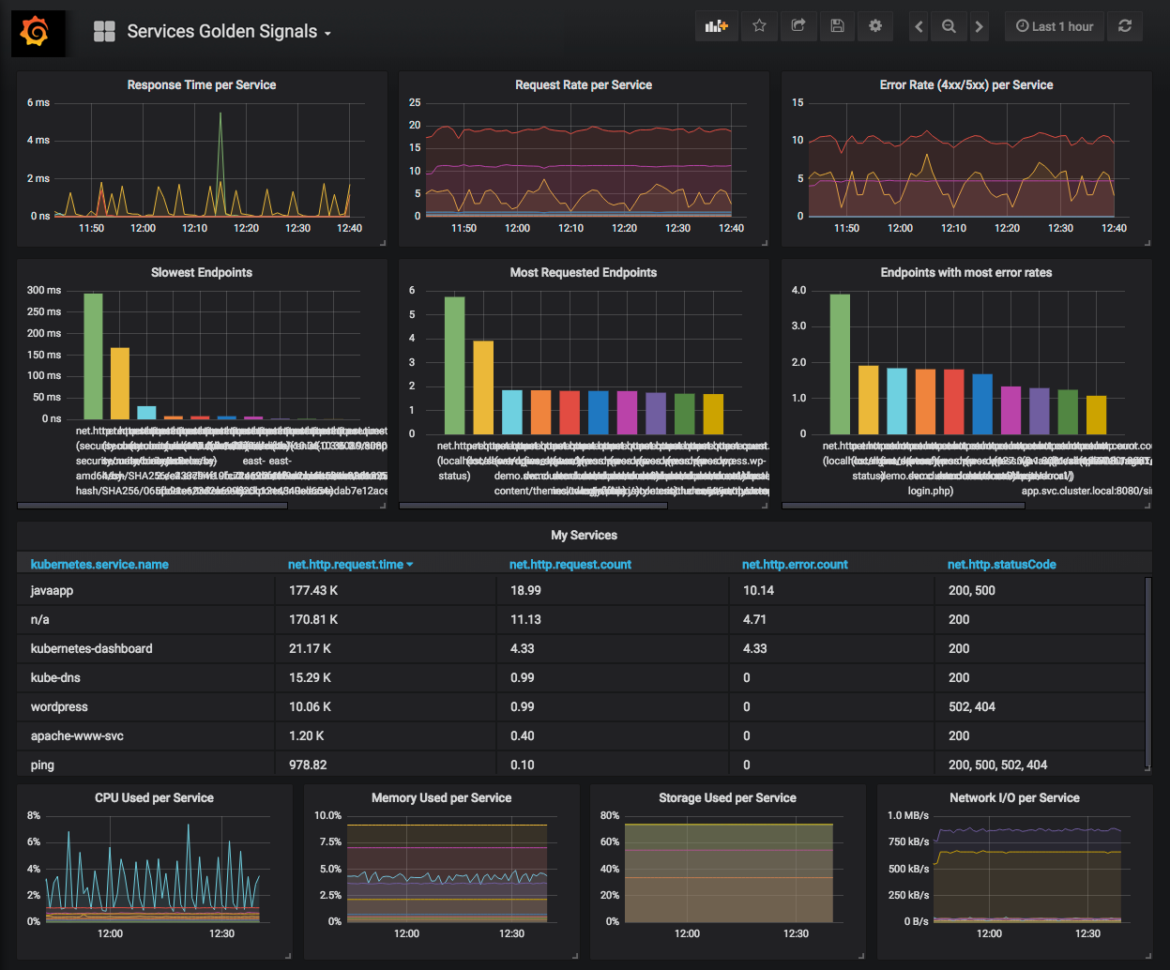
Another feature of Sysdig Monitor 3.0 intended for the Prometheus community is the addition of a Grafana plugin. Now you can add Sysdig as a Grafana data source. This lets you visualize Sysdig Monitor metrics and dashboards in Grafana in the same way you would with pure Prometheus.
Ultimately what we've provided for Prometheus users with Sysdig Monitor 3.0 is a way to solve monitoring challenges at scale. Plus, to do so with minimum disruption to the tools and workflows users know and love.
Here is a resource I recommend reading for a full rundown of Sysdig + Prometheus:
For Kubernetes users: Universal Kubernetes support, cluster management dashboards and StatefulSet metrics
Beyond Prometheus capabilities, Sysdig Monitor 3.0 brings several advancements that will be important no matter which distribution of Kubernetes you use. Not only are we expanding the Kubernetes insights Sysdig Monitor provides, we're also ensuring you can apply those insights across any Kubernetes environment.
Universal Kubernetes support: The popularity and effectiveness of Kubernetes for orchestrating containers has given rise to a number of solutions both for on premises use and in the public cloud. Sysdig Monitor 3.0 brings the concept of "Universal Kubernetes support" from Sysdig. What this means is that we've verified the use of the Sysdig Cloud-Native Visibility and Security Platform with all of the products you can think of including:
- Open source Kubernetes
- Amazon Elastic Container Service for Kubernetes (Amazon EKS)
- Google Kuberntes Engine (GKE)
- Azure Container Service (AKS)
- Red Hat OpenShift
- Kubernetes with Mesosphere DC/OS
- Kubernetes with Docker 2.0
- Pivotal Kubernetes Service (PKS)
- Rancher
- IBM Cloud Kubernetes Service
Without a doubt, this announcement is intended to give users of any of these solutions the confidence that they can use Sysdig. In other words, they can get all of the benefits of Sysdig Monitor 3.0 and previous capabilities we've announced to simplify monitoring Kubernetes.
Cluster Management Dashboards: With more and more services migrating to Kubernetes, monitoring the health and state of your clusters becomes critical to keeping your services up and available. Sysdig Monitor 3.0 delivers new default dashboards to help keep an eye on your Kubernetes platform. For instance, you'll know when it's time to add or change the resources you have in place. We designed our new cluster state, master health, and capacity management dashboards to increase your operational efficiency. If it's your job to ensure the health of your orchestration system, you should check out Sysdig.
StatefulSet Metrics and Dashboards: Are you deploying stateful apps to your Kubernetes cluster? We're seeing it more and more (see Docker usage report for details from earlier this year). New support for Kubernetes StatefulSet metrics and default dashboards with Sysdig Monitor 3.0 helps you monitor for your applications like databases. With the added visibility, our goal is the help you streamline problem identification and resolution for these critical resources.
For all Sysdig Monitor users: Streamlined event feed, dashboard templates and Grafana integration
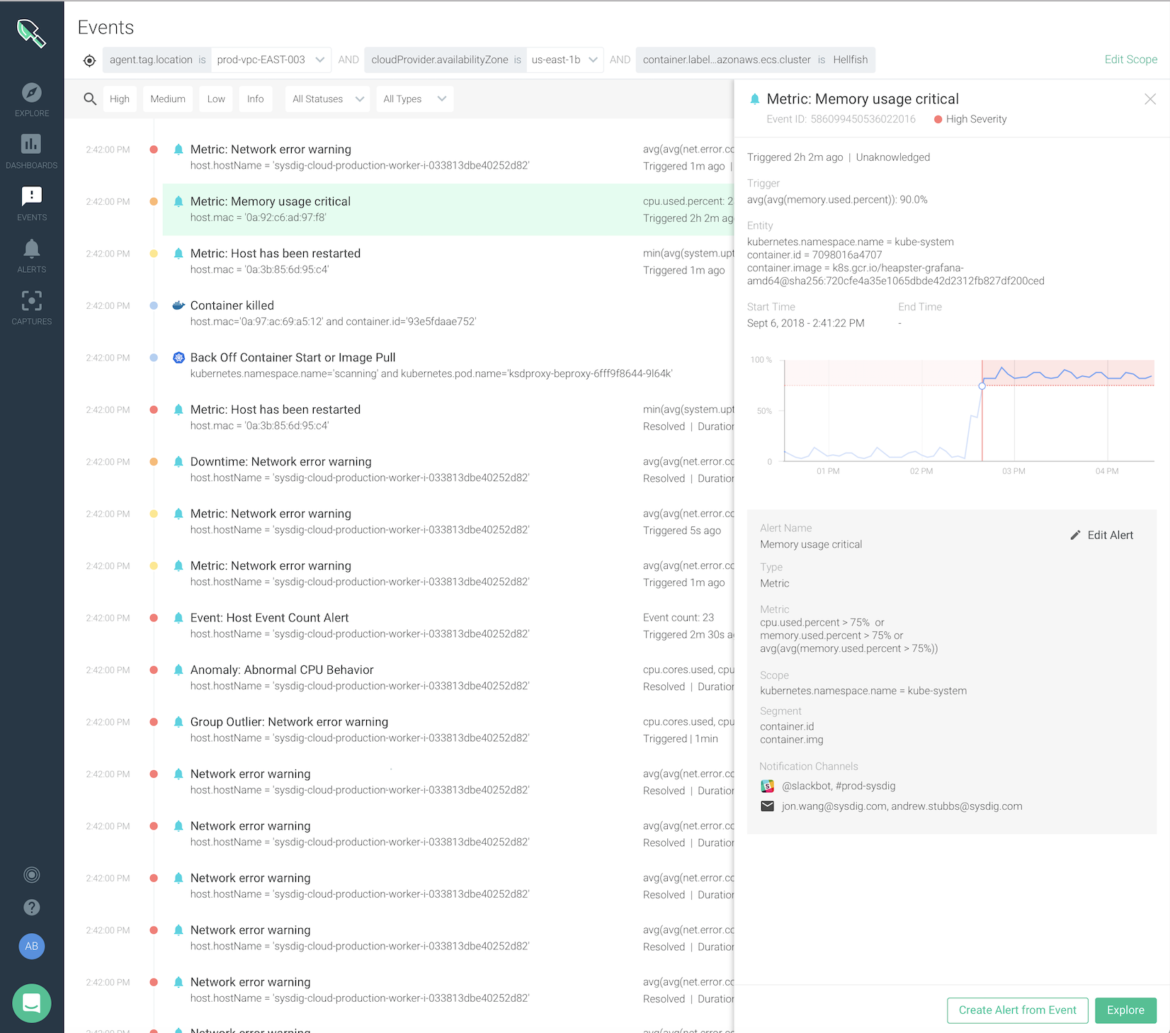
Event feed: As your environment scales to new heights, one of the things you will value is a way to quickly identify the things that deserve your attention. We've been working with our customers to design the best way to display consolidated event details. The result is our new streamlined event feed page. With it you will see at-a-glance, consumable, summarized event details coming from across your apps and infrastructure – from Docker and Kubernetes to your CI/CD build and security incidents. With the new event feed you'll be able to save valuable time and effort when identifying and resolving trouble in the environment.
Dashboard templates: Dashboards are great! Everybody's got one – but one thing we've identified is the need for "templates." Templates help simplify dashboard use across different groups and scopes of a container or cloud environment. To this end, Sysdig Monitor 3.0 introduces a new concept of "dashboard templates" for Sysdig customers. Now that templates are here, Sysdig Monitor administrators will save time for internal users by providing a set of dashboards as a service. Pre-canned dashboards will, for instance, provide best practice views for a given aspect of the environment, and users can customize further by choosing from a set of available scope variables.
Grafana plugin: Yes, I know I mentioned Grafana above – but I want to take credit for it here again as I highlight usability improvements.To emphasize, whether you're using Prometheus or not, if you love the Grafana interface, you can use it with Sysdig Monitor!
Conclusion
Sysdig Monitor 3.0 will be rolled out to all Sysdig customers in this coming quarter. To sum up, our goal is to help enterprise customers see a whole and complete picture of their microservices. As a result, Sysdig will help you find and resolve issues more quickly.
If you're just getting started, you'll discover that successful monitoring of business-critical applications and infrastructure based on cloud-native solutions like Kubernetes and Docker requires a new approach. If you're already there, you know what I'm talking about. To be sure, I expect things like Prometheus to be a part of your journey. As you transition to full-scale production, I think you'll appreciate what Sysdig provides. It will help you deliver efficient, secure applications at enterprise scale and accelerate your time-to-value with Prometheus and Kubernetes.