Falco Feeds extends the power of Falco by giving open source-focused companies access to expert-written rules that are continuously updated as new threats are discovered.

Nowadays many organizations still rely on classic Windows servers and virtual machines (VMs) for their business applications. Although Kubernetes is a trending topic, not everything running in the cloud is a container-based application.
When it comes to monitoring Windows applications and infrastructure, many businesses leverage OSS Prometheus to get Windows metrics via its Prometheus Windows Exporter. Sysdig has had its own Windows integration so far, providing out-of-the-box Windows metrics, dashboards, and alerts.
However, companies that wanted to monitor their Windows infrastructures with OSS Prometheus had to deploy the Prometheus Windows Exporter first, get the key Windows metrics, and later configure Prometheus to either scrape those metrics or push them with remote write to an external Prometheus service.
It's time to go one step further. Sysdig has built a new smooth experience for those companies that need to monitor Windows infrastructures, either in the cloud as VMs or in traditional on-premise environments. Sysdig has come up with a new Windows Prometheus bundle, offering a seamless all-in-one experience where customers will only need to deploy a Windows installer. Start watching Windows metrics and set up your alerts in a few minutes. No additional steps are required!
What is the Sysdig Windows Prometheus Bundle
The Sysdig Windows Prometheus bundle includes a Microsoft Windows installer file which will guide users through the deployment process of the software needed to monitor their Windows servers. Basically, this installer will deploy the following components:
- Prometheus agent: This Prometheus agent is running as a service in the Windows node. Its mission is to pull metrics from the different endpoints exporting metrics in the server. Metrics collected are pushed to the Sysdig endpoint via remote write.
- Windows exporter: A Prometheus Windows exporter responsible for fetching metrics from the Windows server OS. It runs as a service.
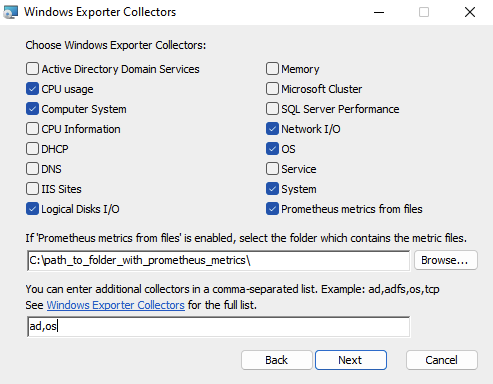
- Windows exporter collectors: Windows users can easily pick which metrics they want to collect by selecting among available collectors, including ISS, MS SQL Server, and others.
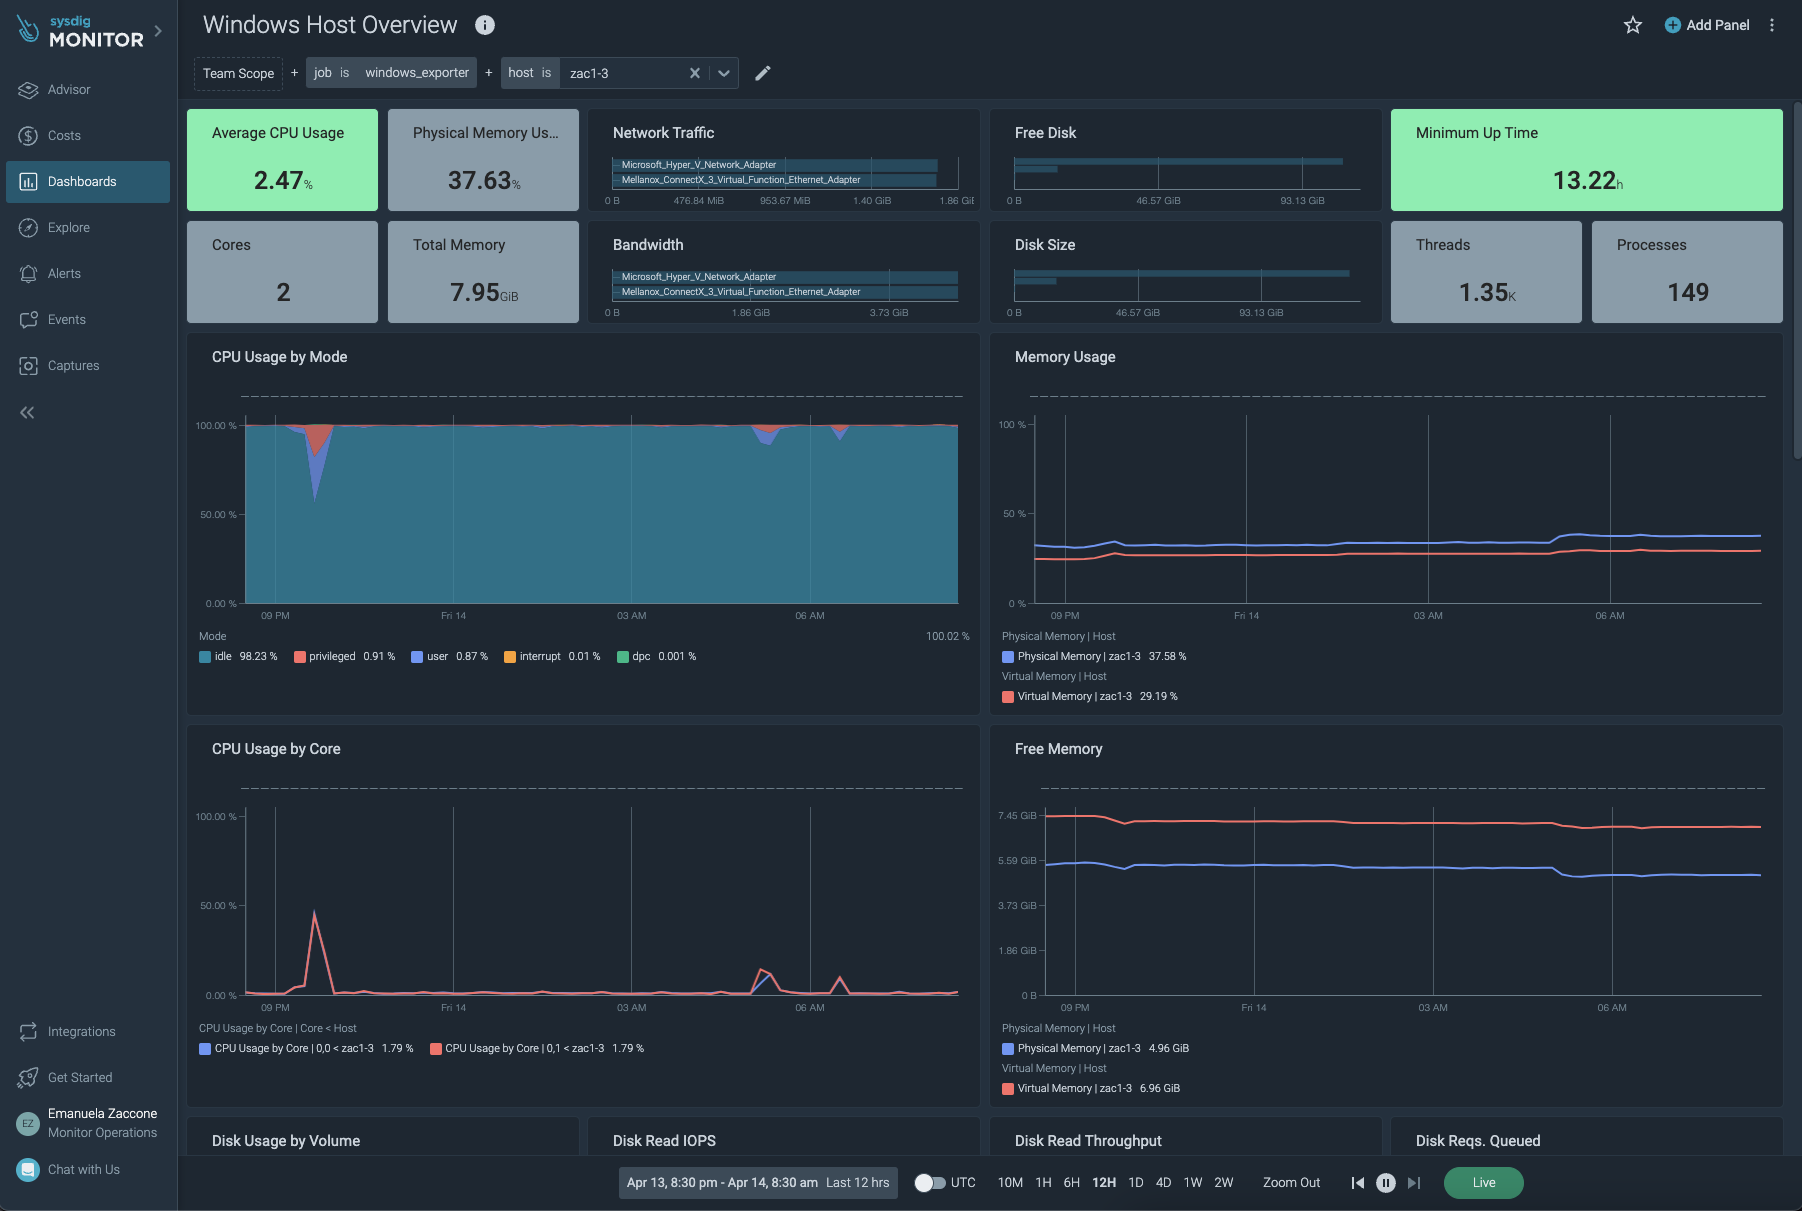
In short, the Prometheus agent will pull the required metrics based on your collectors' preferences. These metrics are automatically pushed to your preferred Sysdig endpoint through remote write. Metrics will be available in your Sysdig Monitor account almost immediately.
What makes it different from the current Windows exporter experience?
Easier installation
Thanks to this new Sysdig Windows Prometheus bundle, users will have a seamless installation experience, regardless of the installation method used. This is an all-in-one package, so users don't need anything else to start monitoring their Windows servers. There are two ways to deploy it:
- Using the wizard: Windows users can just click on the .msi file and follow the instructions provided in the wizard. It's the common way of installing software in Windows: run the installer, choose your preferences, and complete the process.
- Via CLI: System administrators might want to run the installer from the shell. This allows them to automate the installation of the Sysdig Windows Prometheus Bundle across multiple machines using the command line or PowerShell..
Use the following command as an example:
msiexec /i windows_exporter-1.0.0-x64.msi ENABLED_COLLECTORS=cpu,os SYSDIG_URL="https://api.sysdigcloud.com/prometheus/remote/write" SYSDIG_TOKEN="yyyyyyy-zzzz-zzzz-zzzz-xxxxxxxx" /qnIf they want to uninstall, run the following command.
msiexec /x windows_exporter-1.0.0-x64.msi /qnFrom the command line it is also possible to use these options:
- ENABLED_COLLECTORS: Comma separated list of collectors.
- SYSDIG_URL: The Prometheus endpoint of your Sysdig Monitor region in the form of https://api.sysdigcloud.com/prometheus/remote/write. Check the available regions here.
- COMPUTER_NAME (optional): Overrides the label instance in metrics generated by the Windows Exporter.
- TEXTFILE_DIR (only if textfile collector is enabled): The local folder where the textfile collector will look for files.
Metrics enrichment
Similarly to what the Sysdig Agent for Linux does, the Sysdig Windows Prometheus Bundle brings its own metric enrichment capabilities. The "instance" embedded label when collecting metrics with Prometheus is localhost, which prevents the identification of any host in your Windows infrastructure when monitoring and troubleshooting issues with Prometheus. The Sysdig Windows Bundle configures the installation to enrich your metrics, providing further context. Labels for both hostname and domain name are now included in all your Windows metrics.
Installed as services
Both the Windows Exporter and the Prometheus Agent are installed as Windows services just out of the box. This makes them initiate automatically when the Windows machine starts and restart when there is any issue. This way, you will always have metrics available for monitoring and troubleshooting all your Windows servers and VM.
Improved performance
This new release comes with a 30% memory performance improvement for Prometheus agent and Windows exporter.
Full infrastructure visibility
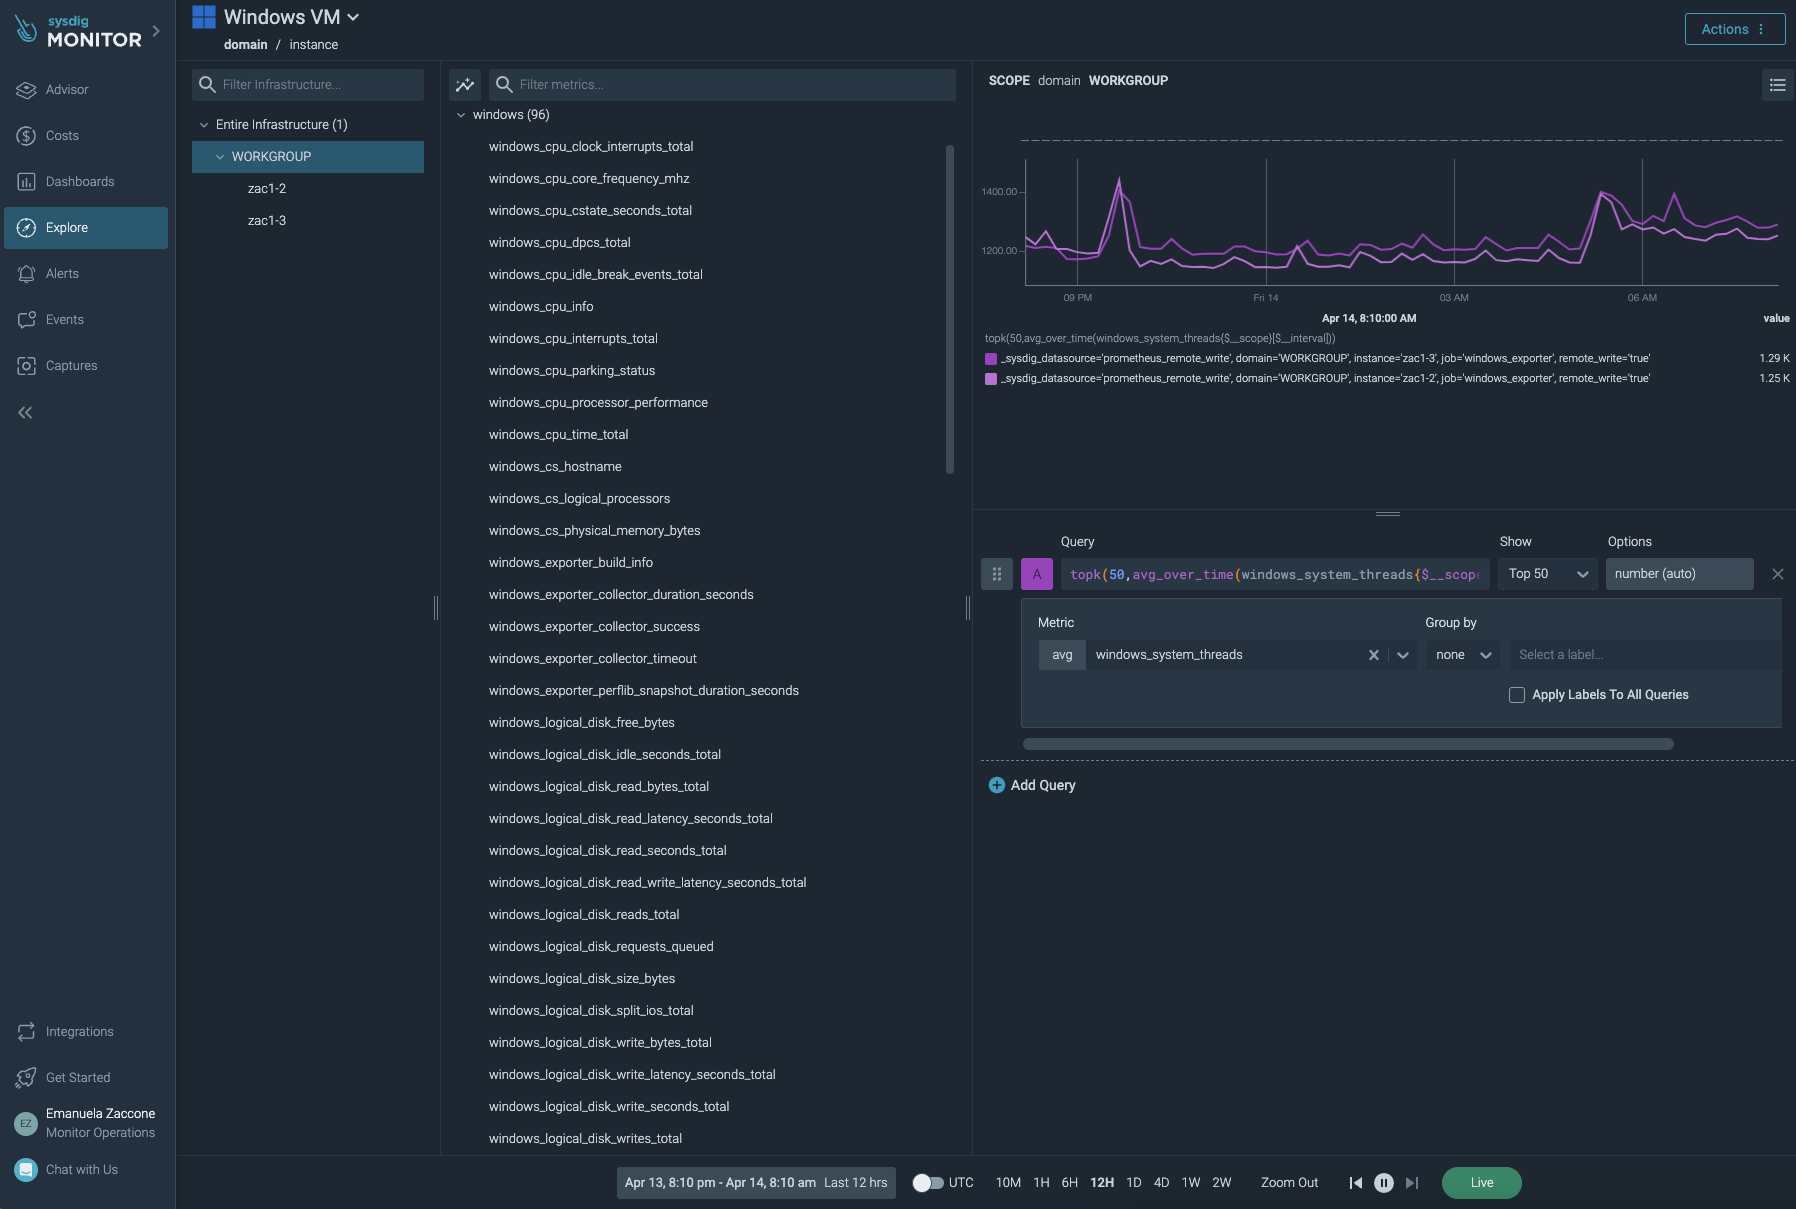
Get control over the Windows infrastructure leveraging Sysdig Explorer and Real Time Groupings feature. Users can already take advantage of it by enabling the Technical Preview in Settings:
Use cases
Let's talk about the different use cases where users will find the Sysdig Windows installer beneficial. Check the following table to learn more about which problems the Sysdig Windows installer address, as well as the personas involved.
How to get started with the Sysdig Windows Prometheus Bundle
As you'll see right away, the installation process is straightforward. Let's take a look!
- Go to the Sysdig documentation page to download the Sysdig Windows installer.
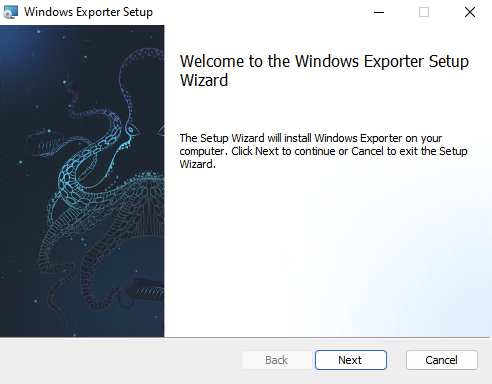
- Execute the .msi file and click "Next."
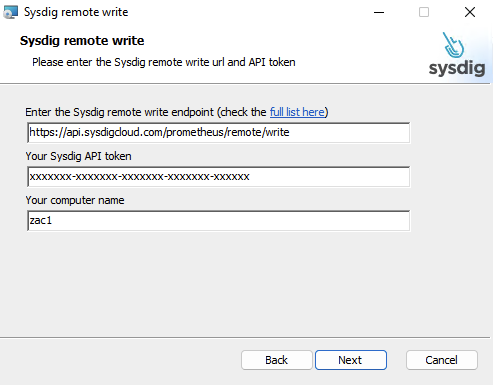
3. Complete the remote write config along with your Sysdig API token and the computer name. Click "Next."
4. Select the Windows exporter collectors you want to get metrics from. Click "Next."
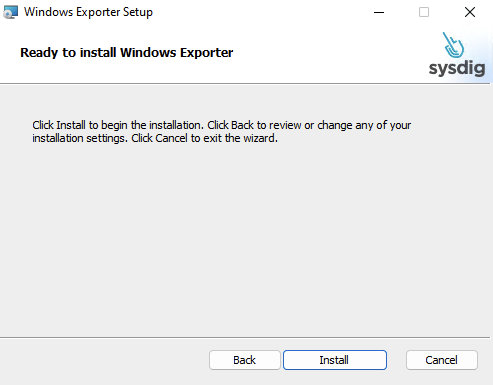
5. Click "Install" and wait until the installation has finished.
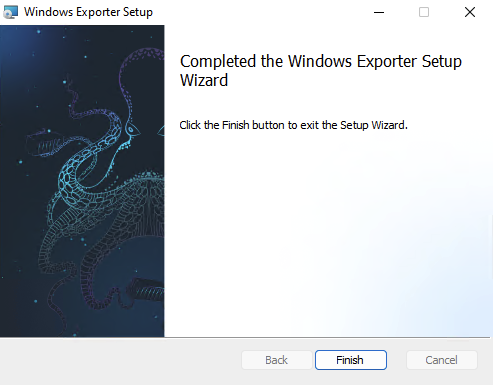
6. Click on "Finish." Your Prometheus agent is now already pulling metrics from your Windows host.
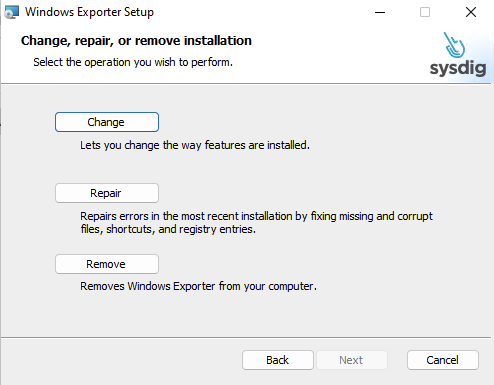
Finally, users can easily change, repair, and uninstall the Windows Prometheus Bundle by relaunching it.
Conclusion
The new Sysdig Windows Prometheus Bundle aims to simplify and improve the installation process. You won't need to worry about which bits you need to start pulling metrics from your Windows servers and VMs. Just deploy the Windows installer in all your Windows servers and VMs, and that's all!
Benefit from all the features and capabilities of Sysdig Monitor. Monitor and troubleshoot issues not only in your Windows servers and VMs, but also in your cloud (AWS, Azure, GCP) and Kubernetes environments. Take control of your whole infrastructure from a single pane of glass with Sysdig Monitor.
If you want to learn more about how Sysdig Monitor can help with VMs and Windows monitoring and troubleshooting, visit the Sysdig Monitor trial page and request a 30-days free account. You will be up and running in minutes!


