


Falco Feeds extends the power of Falco by giving open source-focused companies access to expert-written rules that are continuously updated as new threats are discovered.

Google Cloud provides its own set of metrics for monitoring applications, services, and instances. There are a huge number of metrics – more than 1,500 different ones just for GCP monitoring! While this is great, dealing with such a number can also be overwhelming. Filtering, pulling, exploring, and storing the metrics that you really need can be an enormously time-consuming task, and a big challenge.
GCP offers its own Prometheus managed service, which can be used to collect and explore the GCP Prometheus metrics, as well as some other metrics that you may want to scrape from other exporters. It is a separate product so it has its own pricing model.
Sysdig can help to alleviate this excessive burden.
Today we are happy to announce the general availability of GCP metrics support in Sysdig Monitor. Just connect your GCP account, enable the integration, and benefit from the out-of-the-box GCP monitoring.
Multi-cloud monitoring with Sysdig Monitor
Thanks to its multi-cloud integration model, Sysdig customers can easily monitor AWS, Azure, and GCP workloads and services from a single pane of glass.
You can now correlate your own applications, services, and Prometheus metrics with Kubernetes and cloud context, without any extra effort.
Forget about taking care of exporters or any other service to pull your GCP metrics. Everything is handled by Sysdig Monitor. The same way Sysdig Monitor works with third-party applications and services, it offers a completely smooth experience for GCP integration.
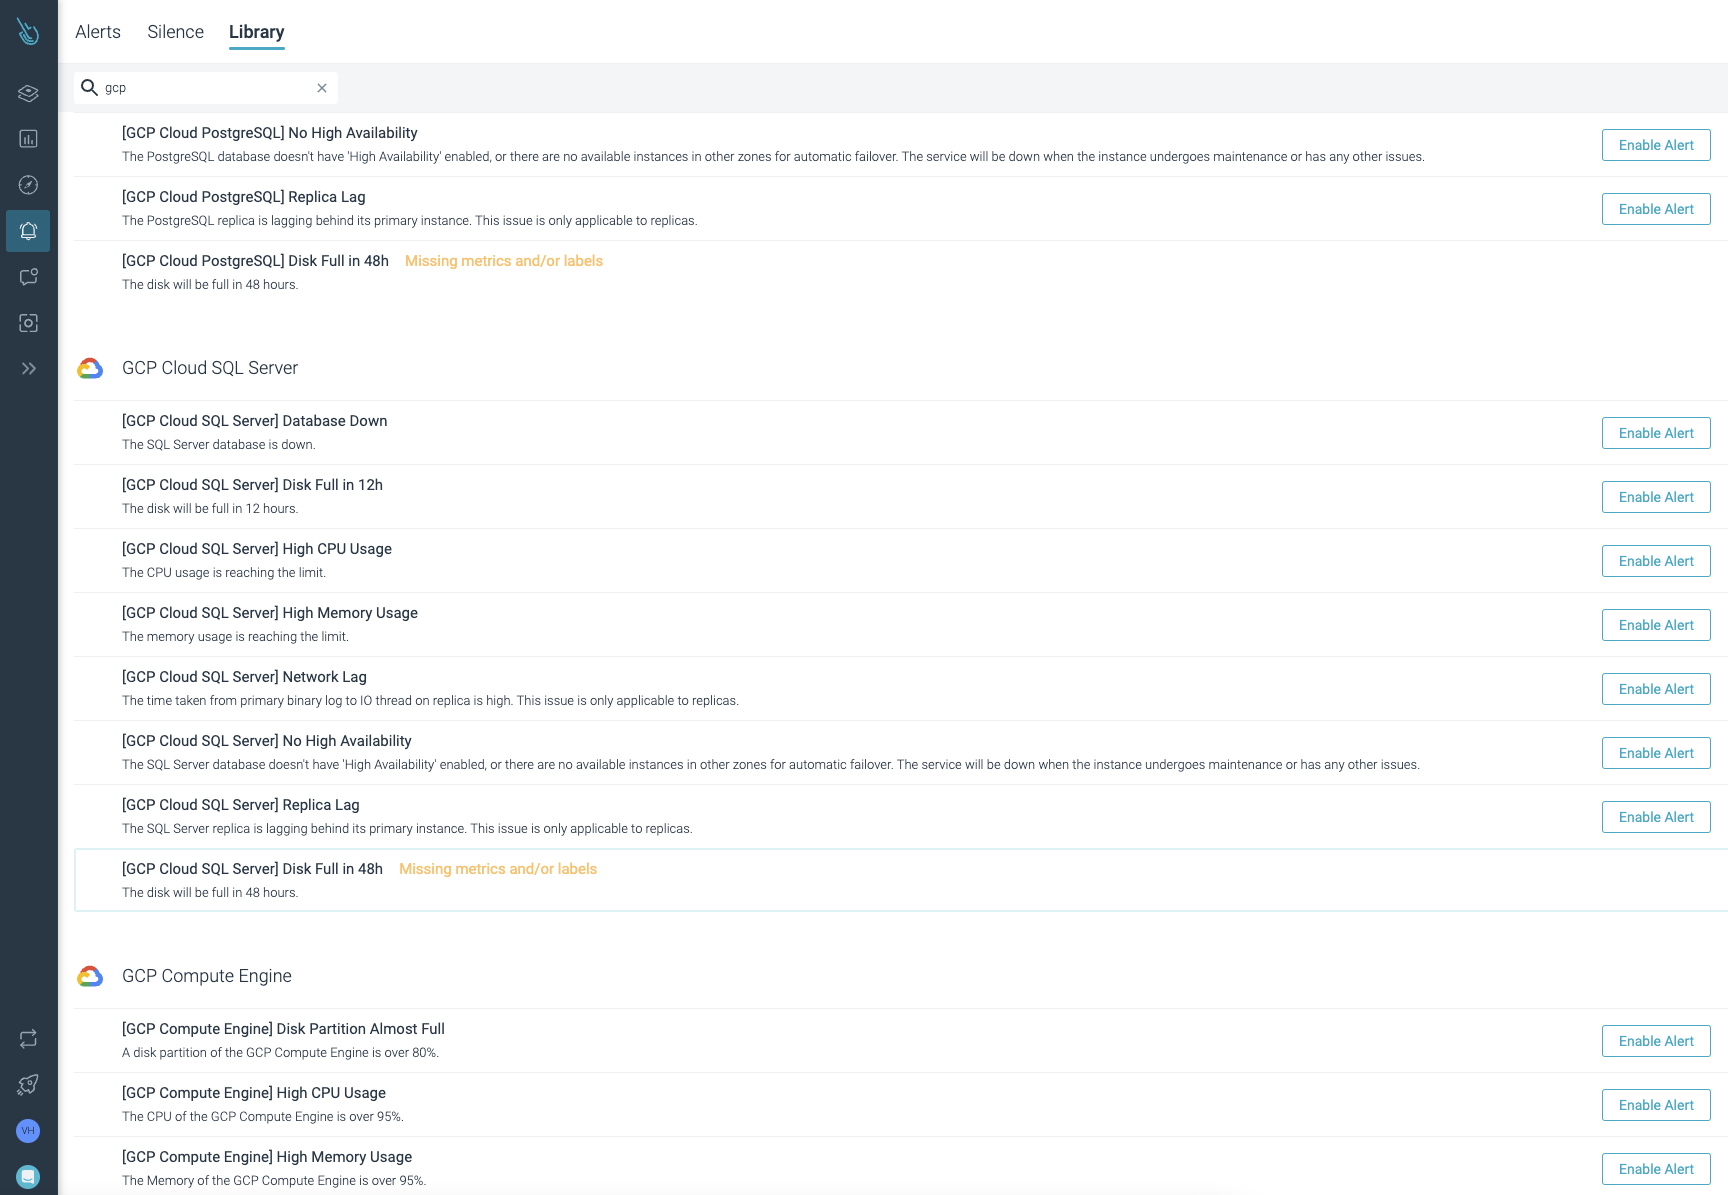
All the steps you need to link your GCP account successfully with Sysdig Monitor are provided through a step-by-step wizard. Tons of predefined alerts, and a bundle of out-of-the-box dashboards to monitor and troubleshoot your GPC services, are some of the benefits of integrating and monitoring GCP with Sysdig Monitor.
These, and other benefits like the Kubernetes and cloud metrics enrichment or the automatic metrics ingestion, are supported and maintained by Sysdig. You don't need to waste time on these things anymore. Rather, use your time for what's most important: your business.
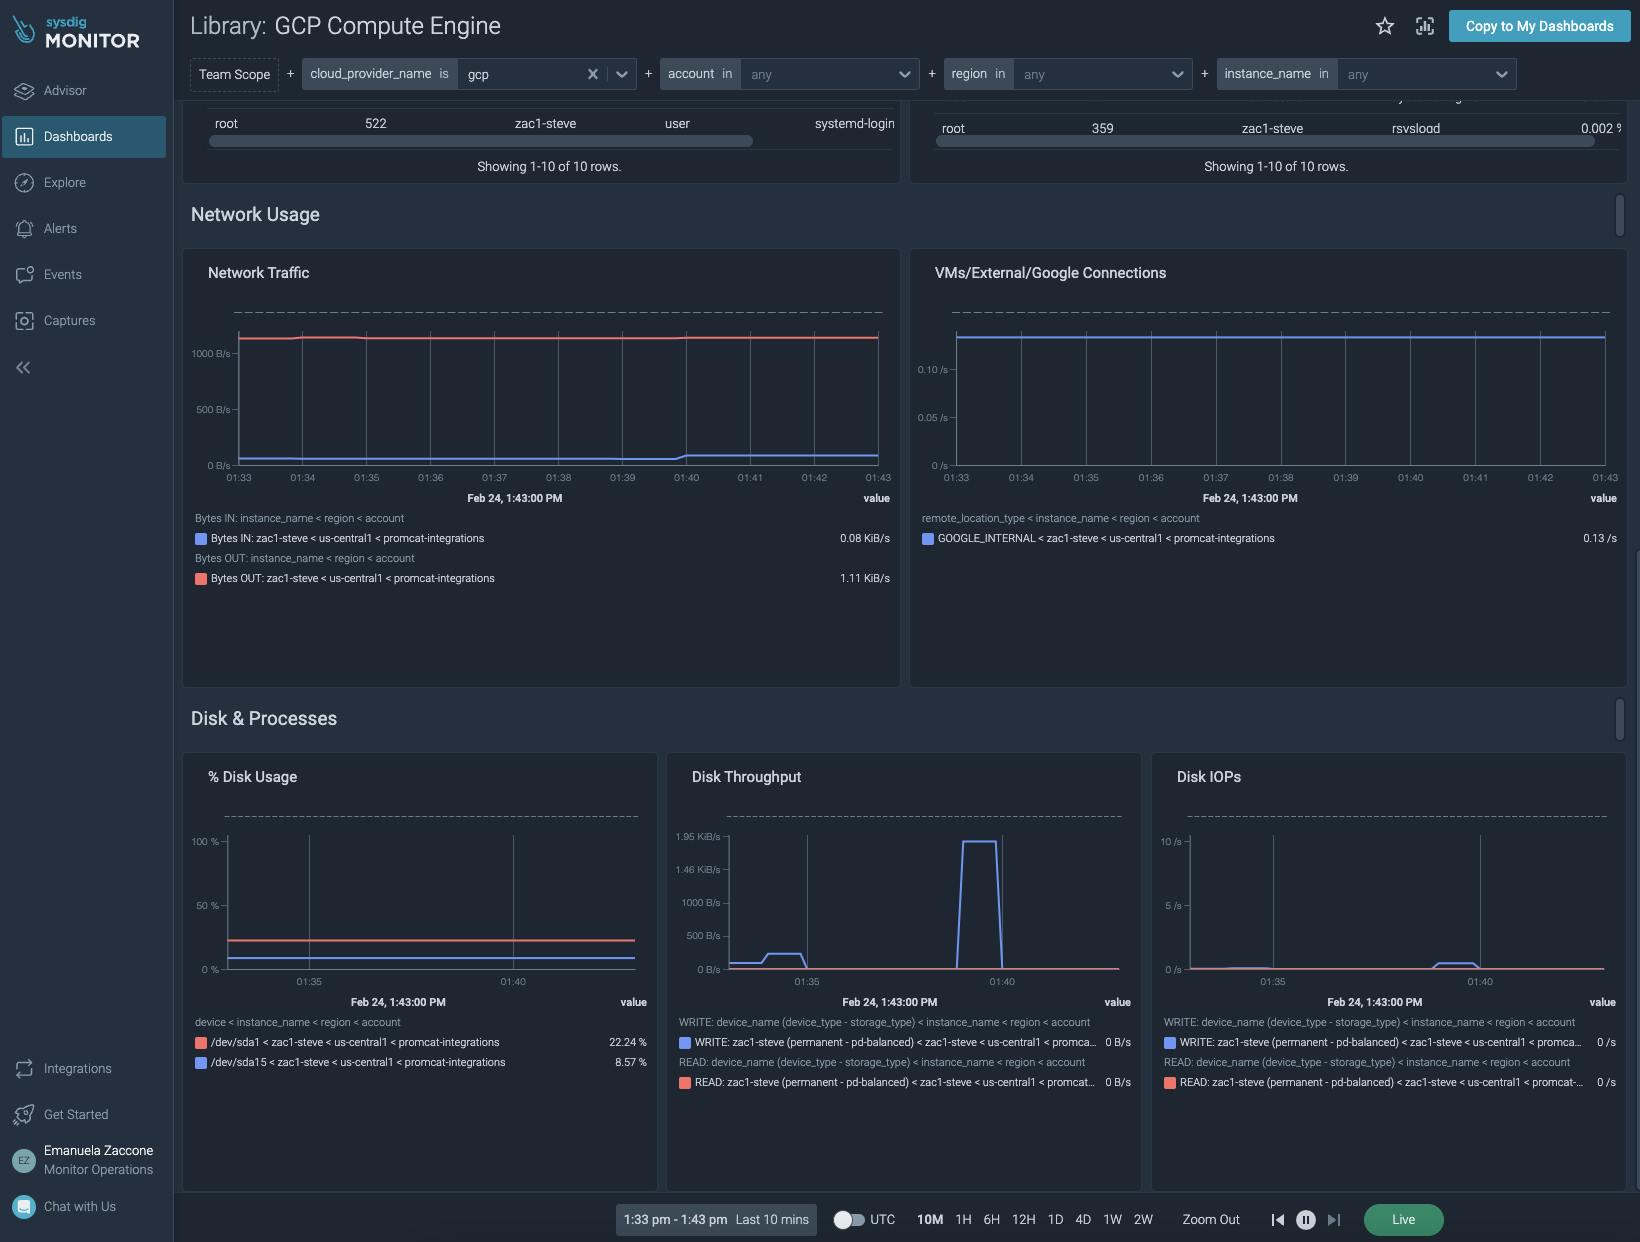
Integrating GCP is easy. After a few minutes, you'll have access to plenty of information from your Cloud instances and services.
How to get started
The GCP monitoring integration is available now! If you want to start pulling your GCP Prometheus metrics, just follow these few steps:
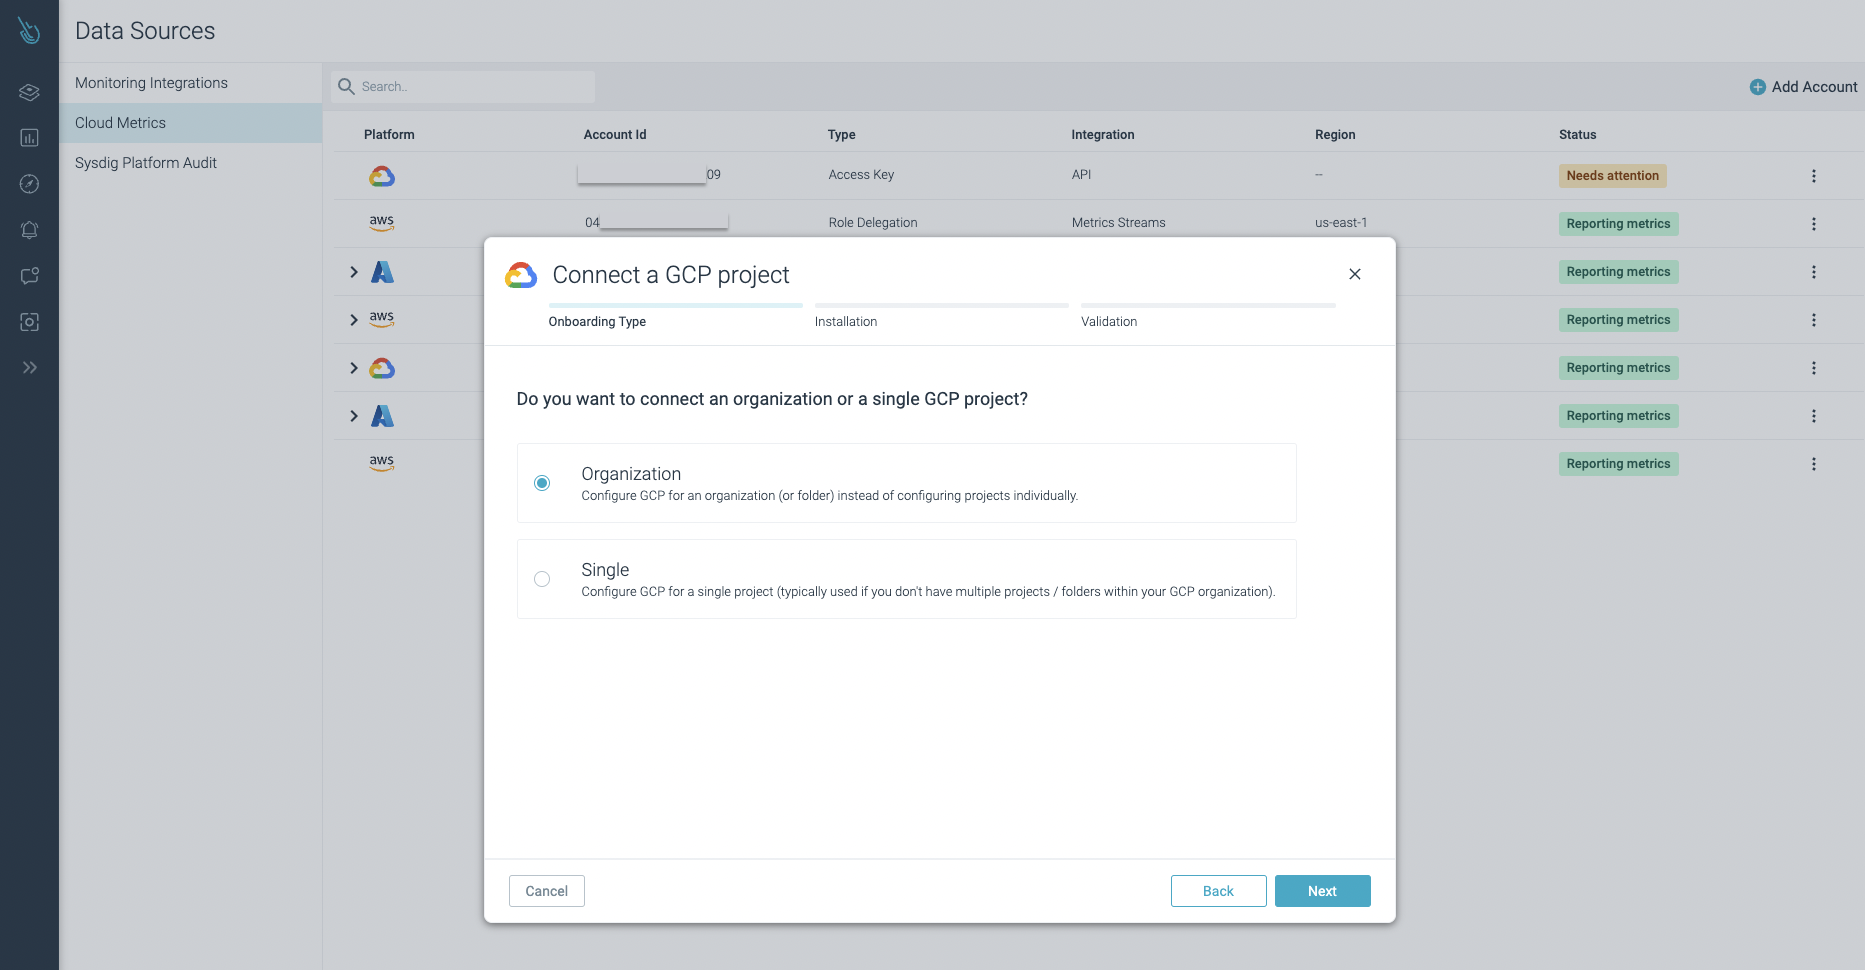
- In the Sysdig Monitor panel, go to Integrations and click on Cloud Metrics.
- Click on Add Account to launch the Cloud integration assistant.
- Select GCP and choose between Organization or Single, depending on whether you want to connect your whole org or a single project.
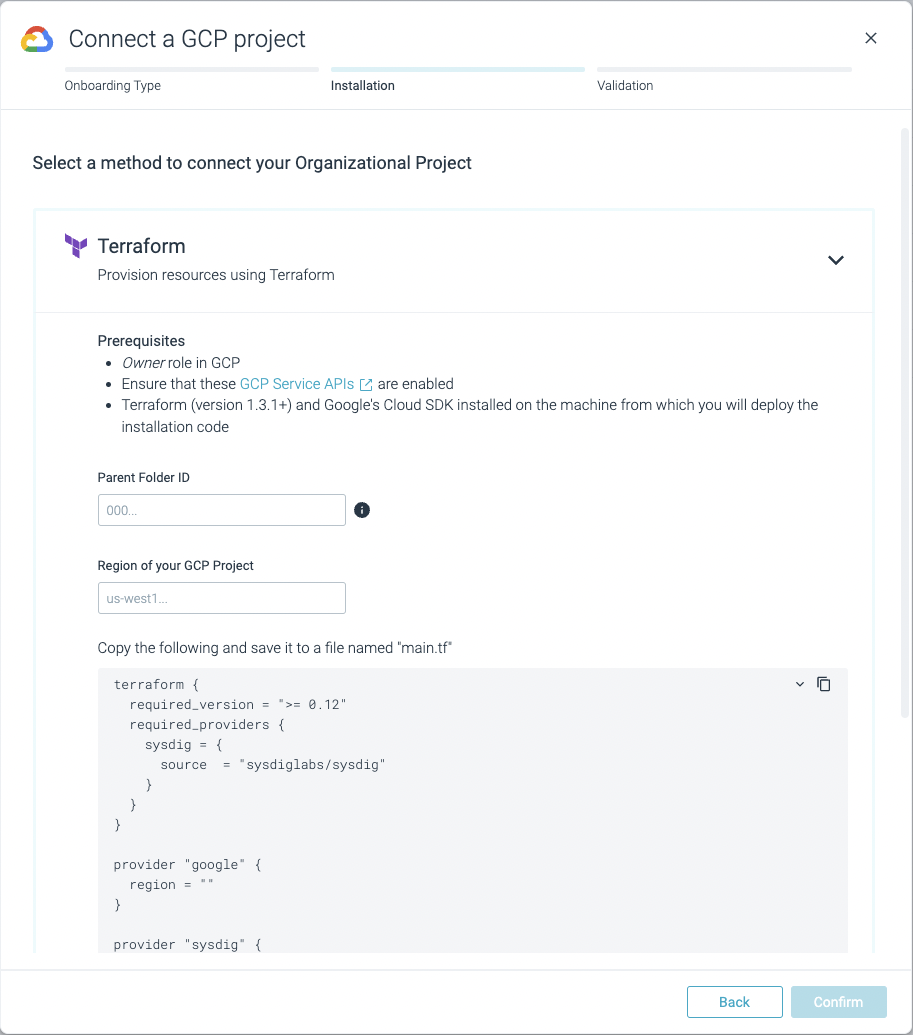
4. Follow the instructions to configure this Cloud integration.
5. Wait a few minutes and look for the new out-of-the-box GCP dashboards.
Dig deeper into GCP with Sysdig integrations
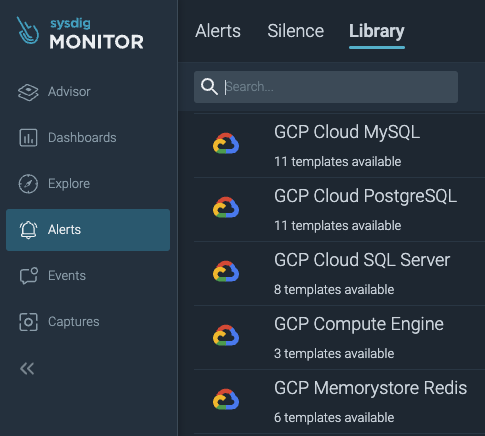
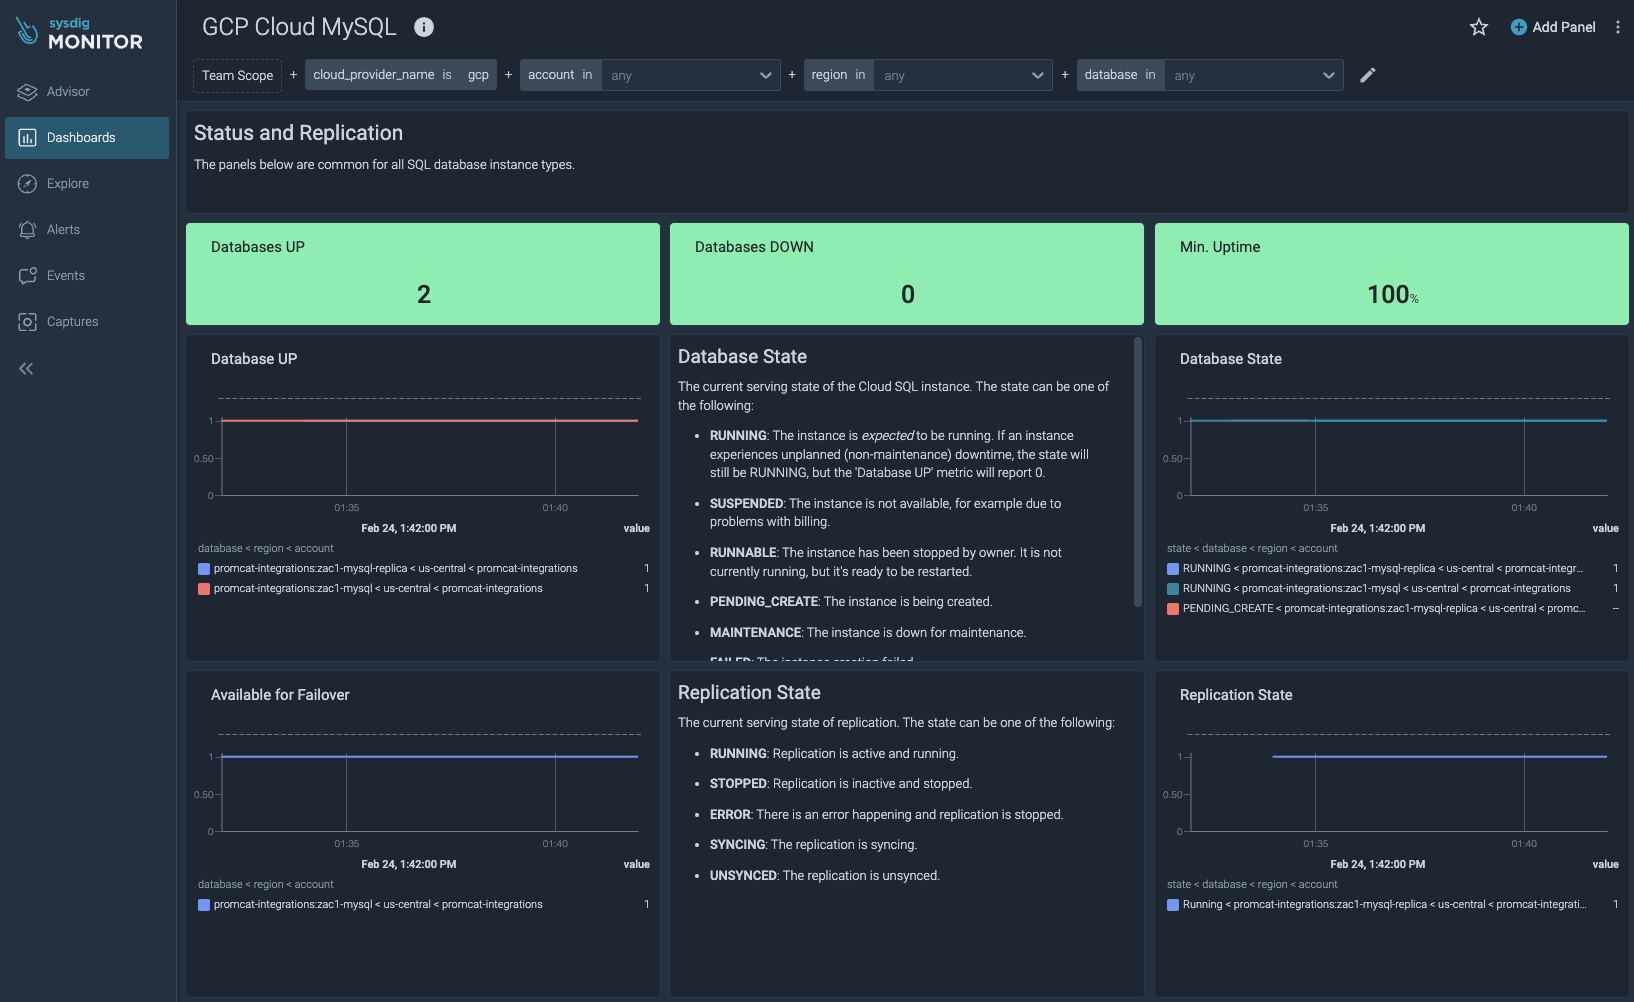
In this new release, Sysdig has prepared a set of new integrations for GCP – from checking the health and performance of your GCP Cloud MySQL, PostgreSQL, or SQL Server instances, to ensuring your GCP compute engine instances are behaving properly. A new bundle of predefined alerts and out-of-the-box dashboards will be automatically shown a few minutes after you configure the GCP integration in the Sysdig Monitor portal.
Conclusion
Integrating GCP with Sysdig Monitor is super simple. Thanks to this new integration, you can now store and explore your own GCP service metrics in a few minutes!
The main public Cloud providers like AWS, Azure, and GCP are integrated into the multi-cloud Sysdig Monitor platform. You can not only monitor and troubleshoot your cloud-native workloads, but also your own cloud provider metrics. In Sysdig Monitor, everything is close by. You can have full control of all your cloud environments from a single place.
Sign up here for a free trial of Sysdig Monitor. While you are there be sure to check out our Kubernetes troubleshooting, managed Prometheus, and cost optimization features.