Gain deep visibility into Kubernetes health and performance.
Sysdig Monitor is Built for Kubernetes
Inspect every aspect of your Kubernetes clusters, from capacity to control plane, in order to see what is really happening and avoid potential problems. If anything goes wrong, Advisor shows you a prioritized list of issues you need to take care of now, with curated remediation steps and live logs to help troubleshoot each issue fast. Our detailed dashboards and alerts are ready to go right out -of -the -box, so you can start optimizing your environment instantly.
Sysdig is our go-to metrics provider for Kubernetes. There is no better choice than Sysdig to meet our monitoring and security needs.
Kubernetes Monitoring
Use Cases
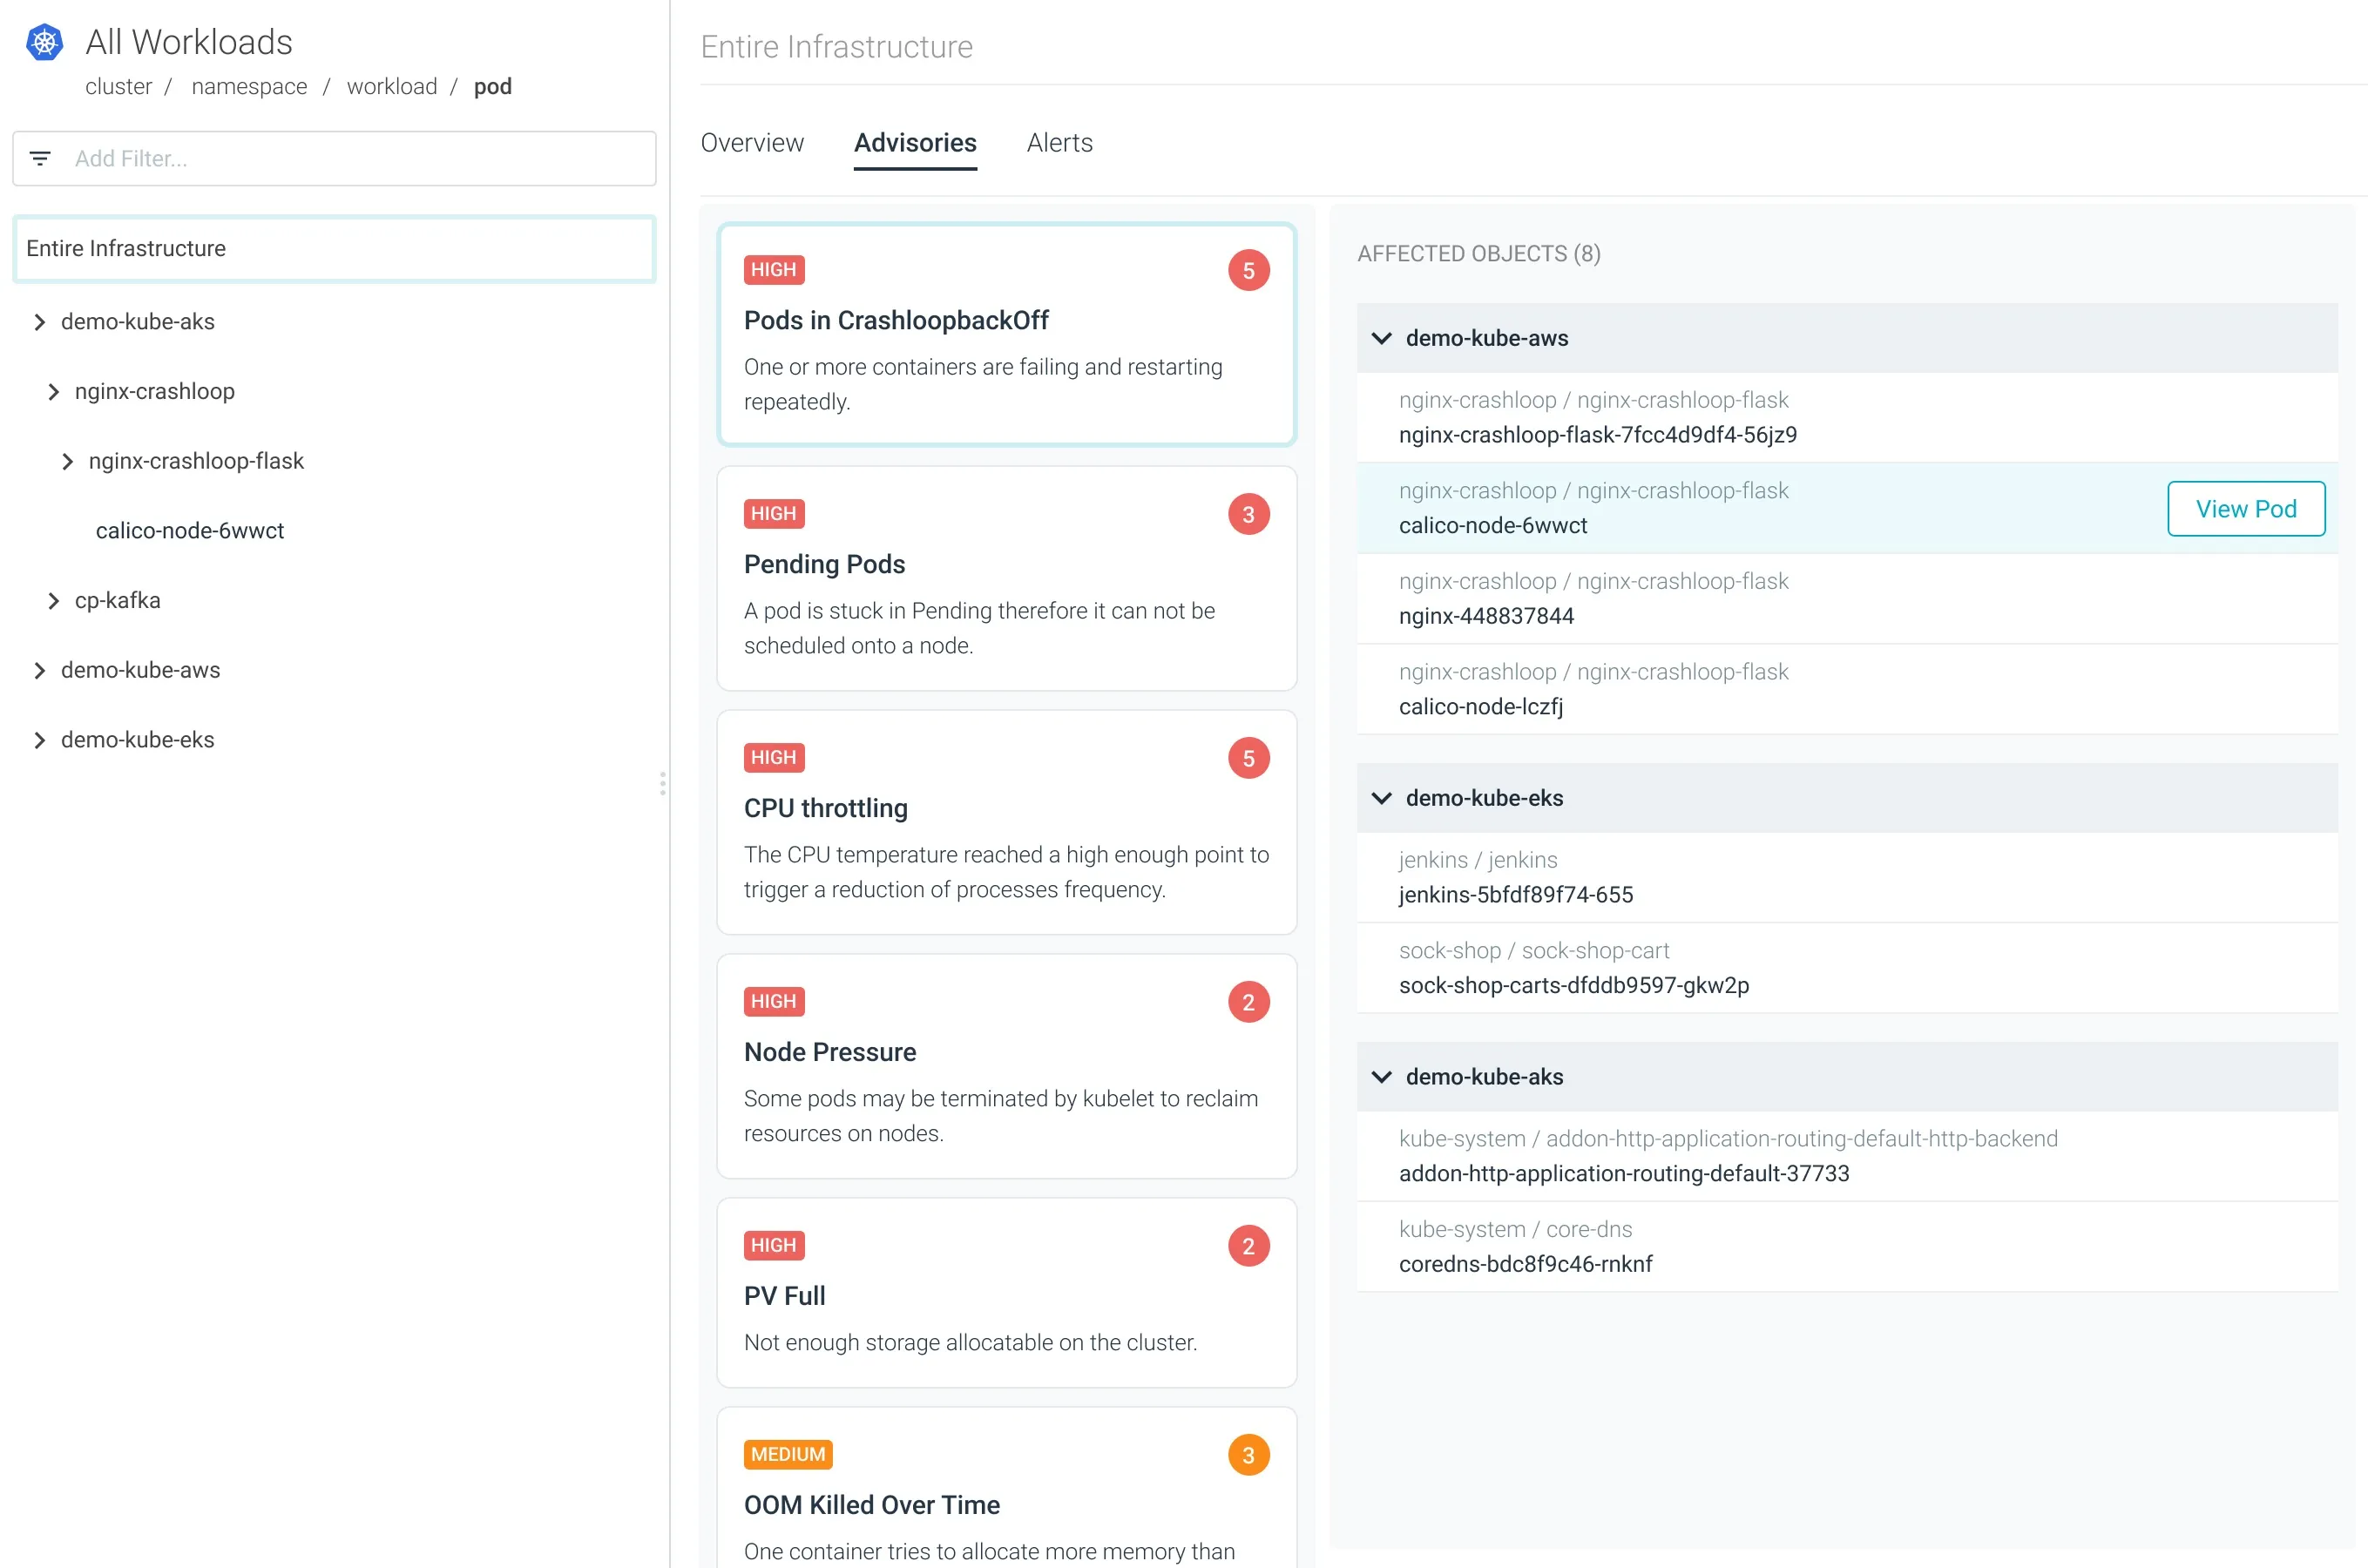
Troubleshooting Kubernetes Errors
Advisor makes it quick and easy to troubleshoot difficult issues such as Crash Loop Back Offs, pod evictions, resource allocation, and limits.
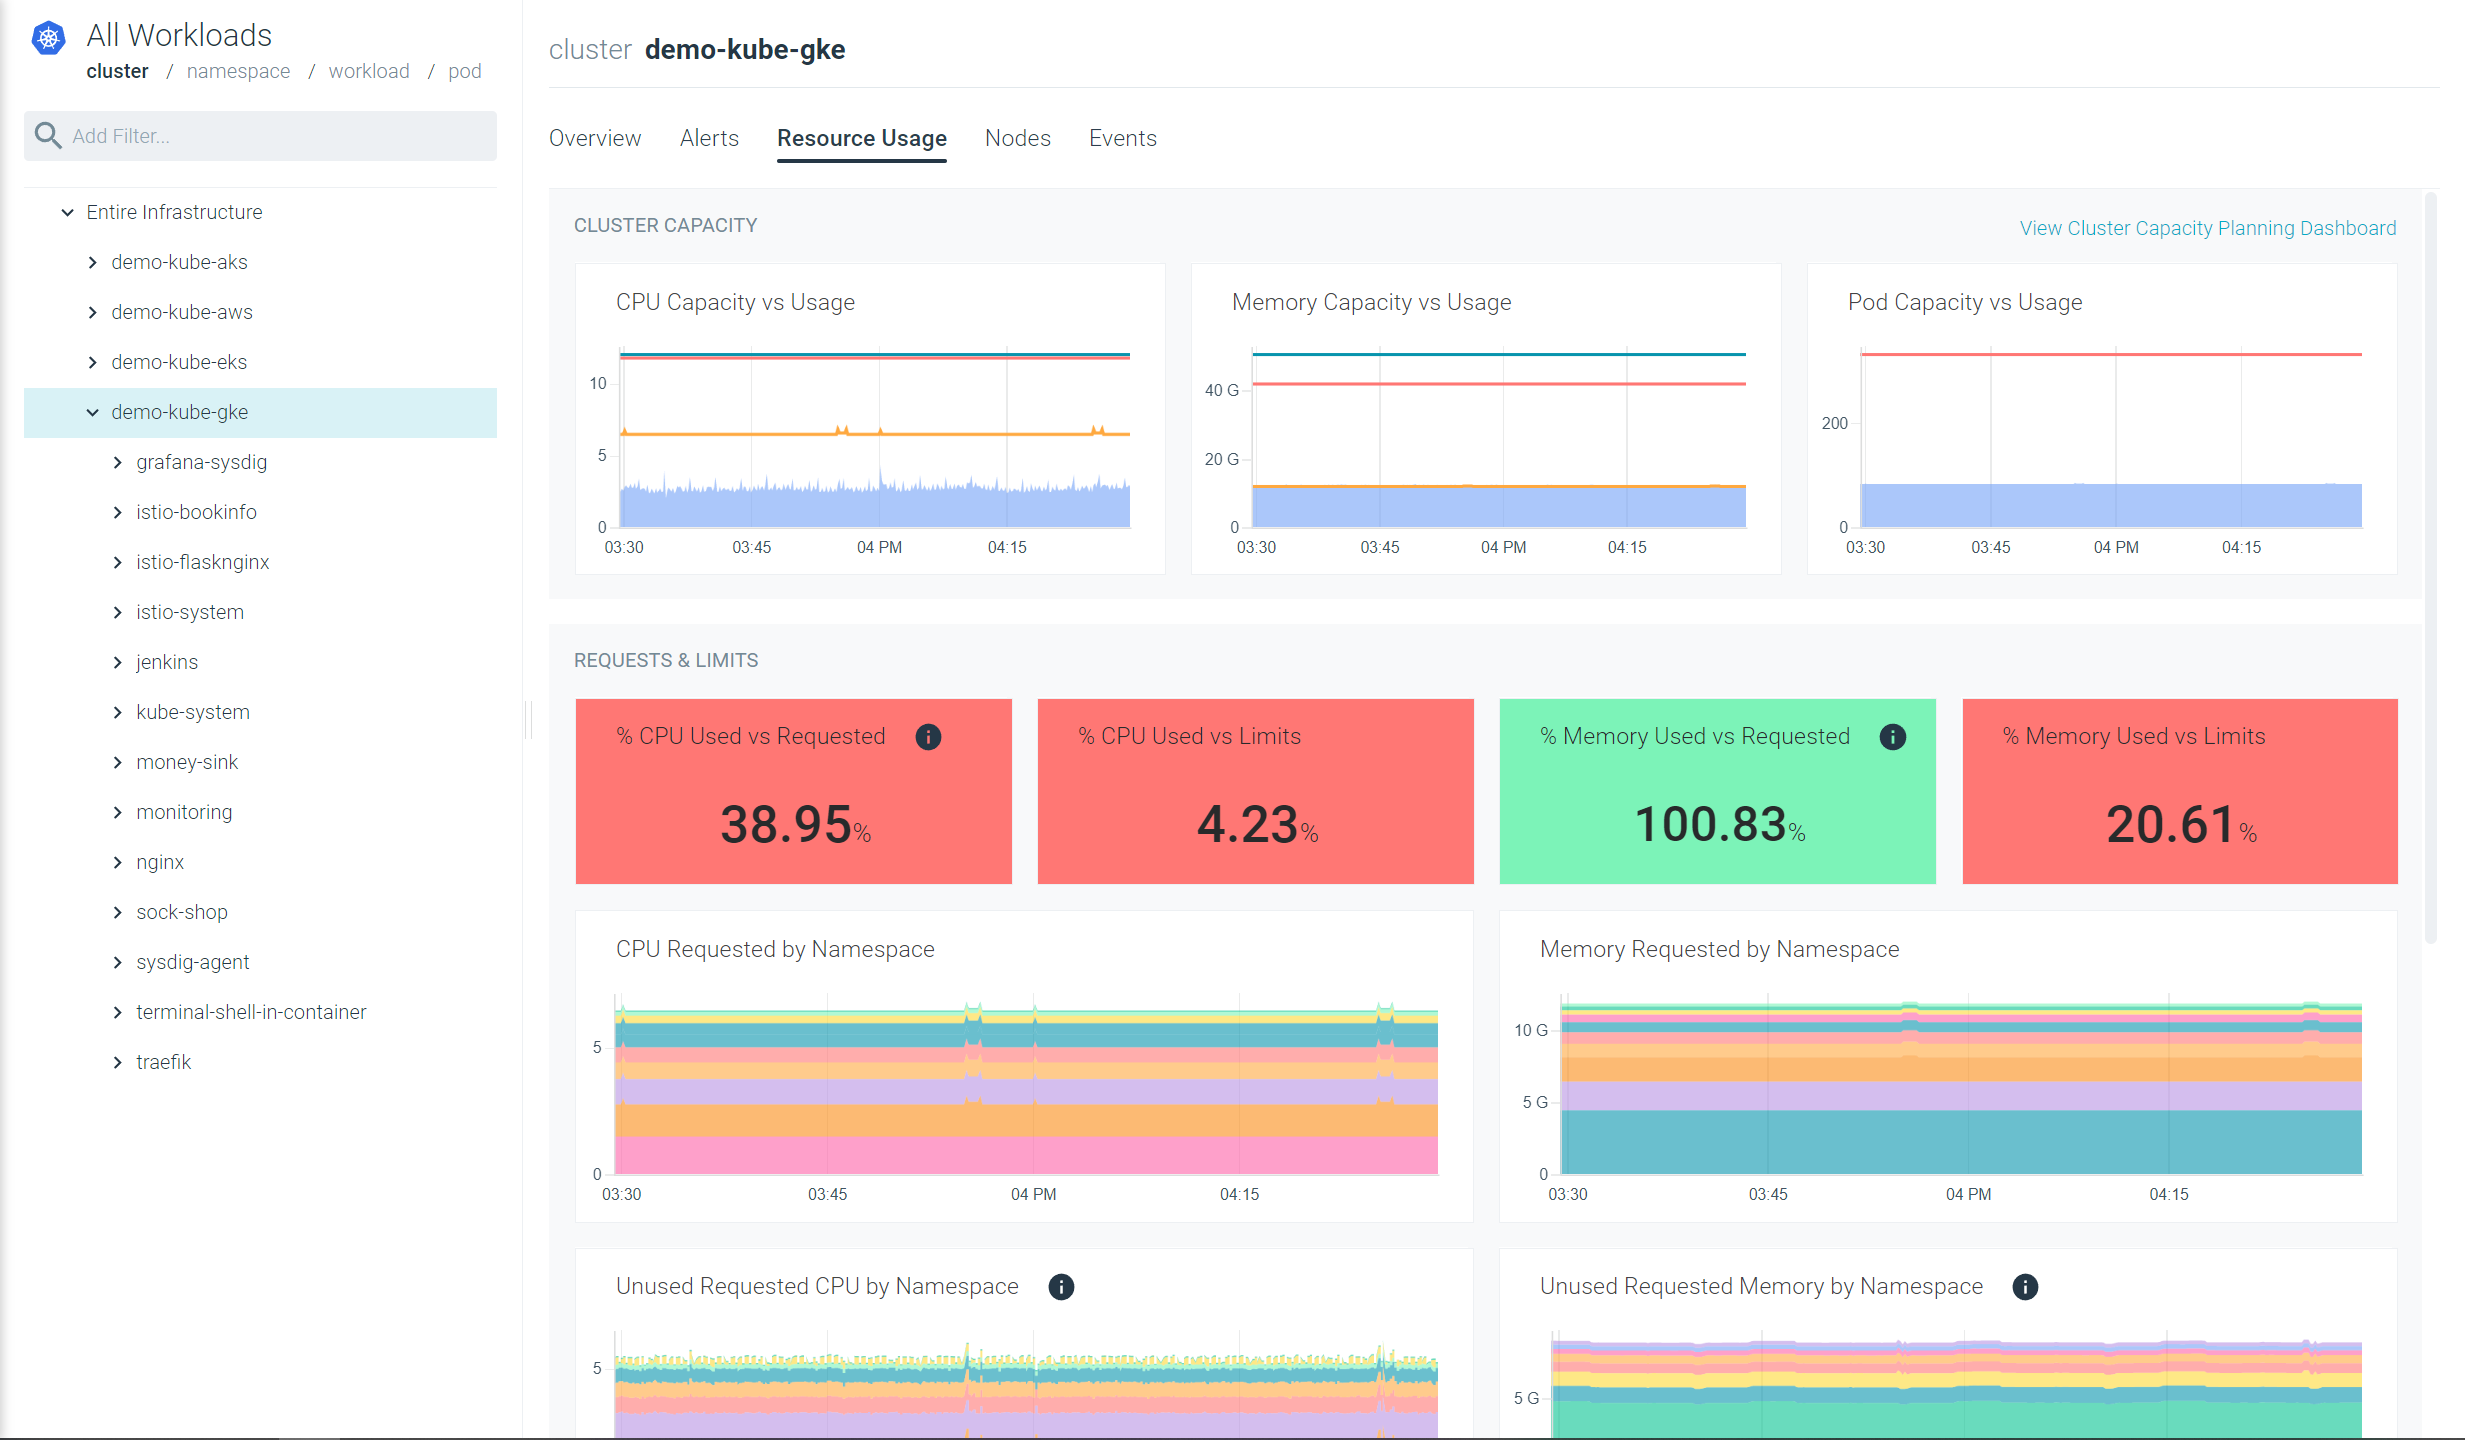
Cluster Availability and Capacity
See the current status of your Kubernetes clusters and where you might be over-allocated or underutilized. Take the guesswork out of your planning process.
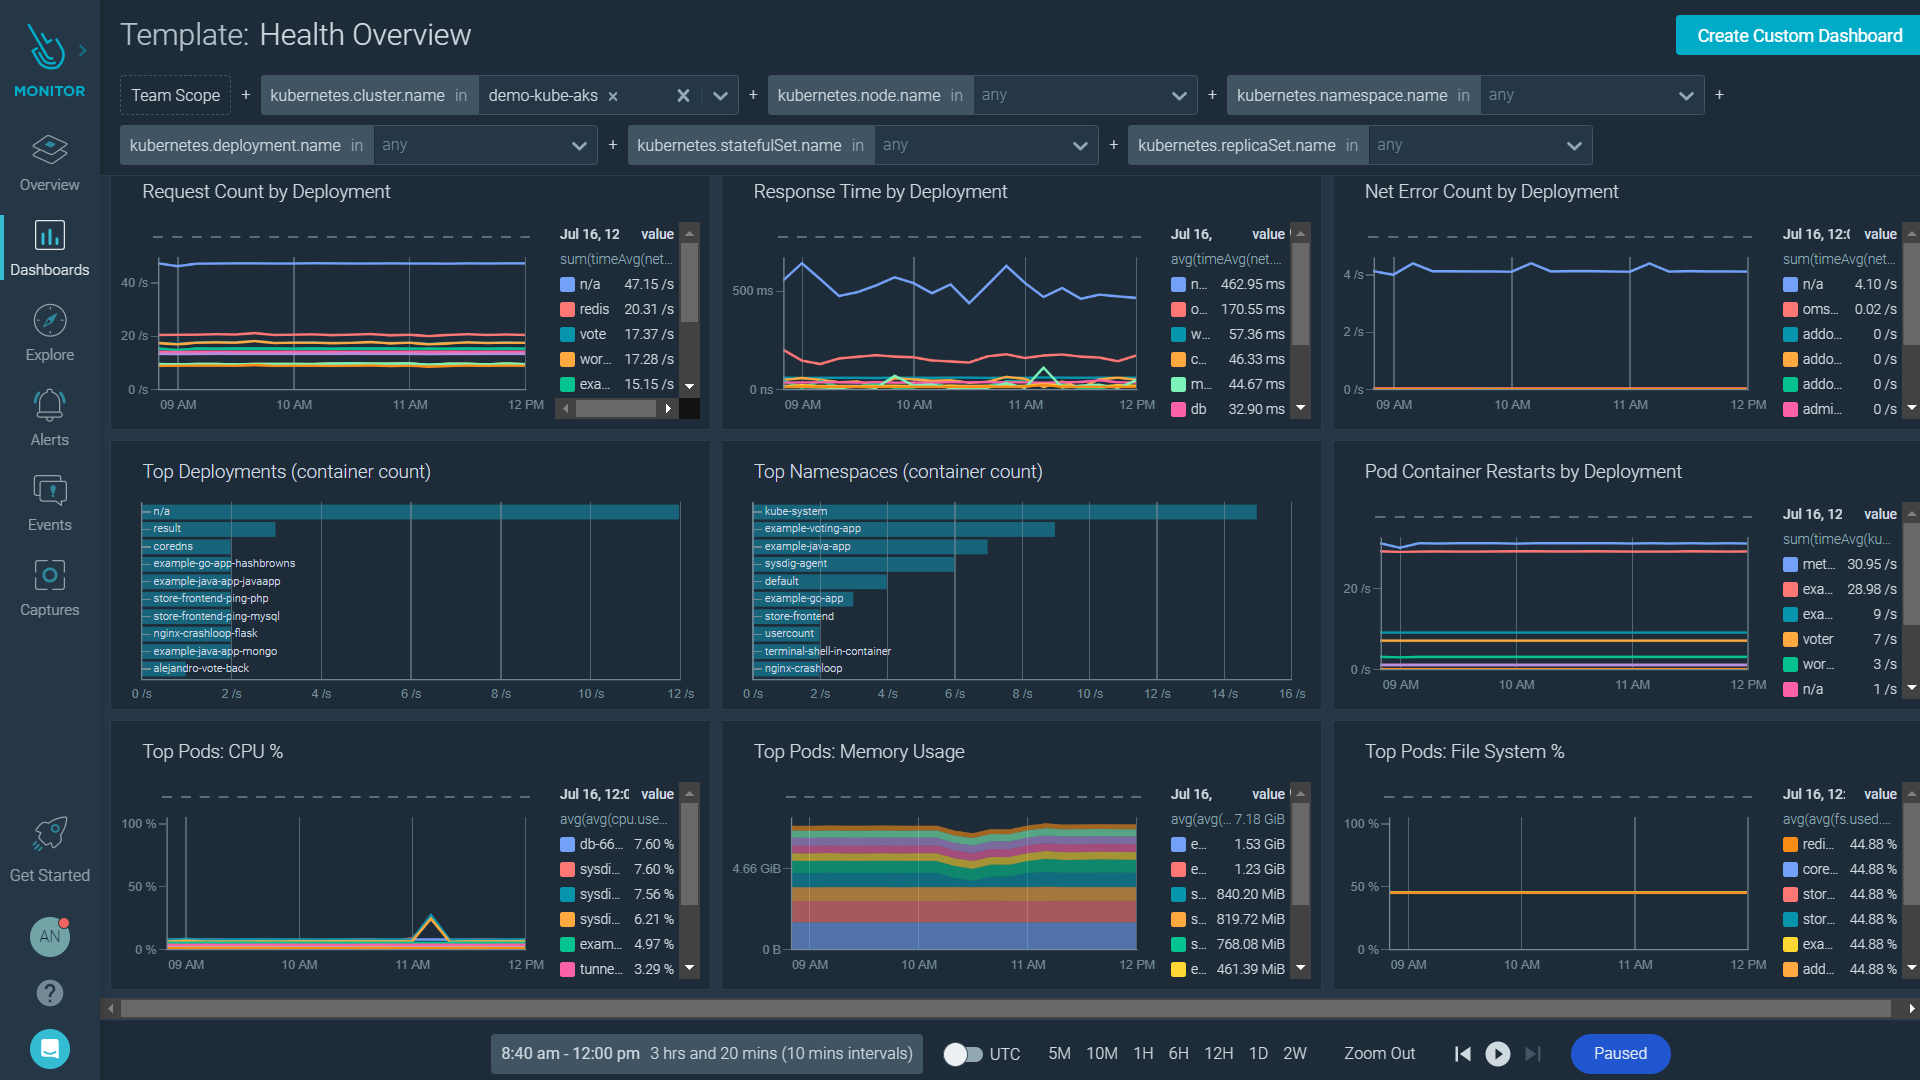
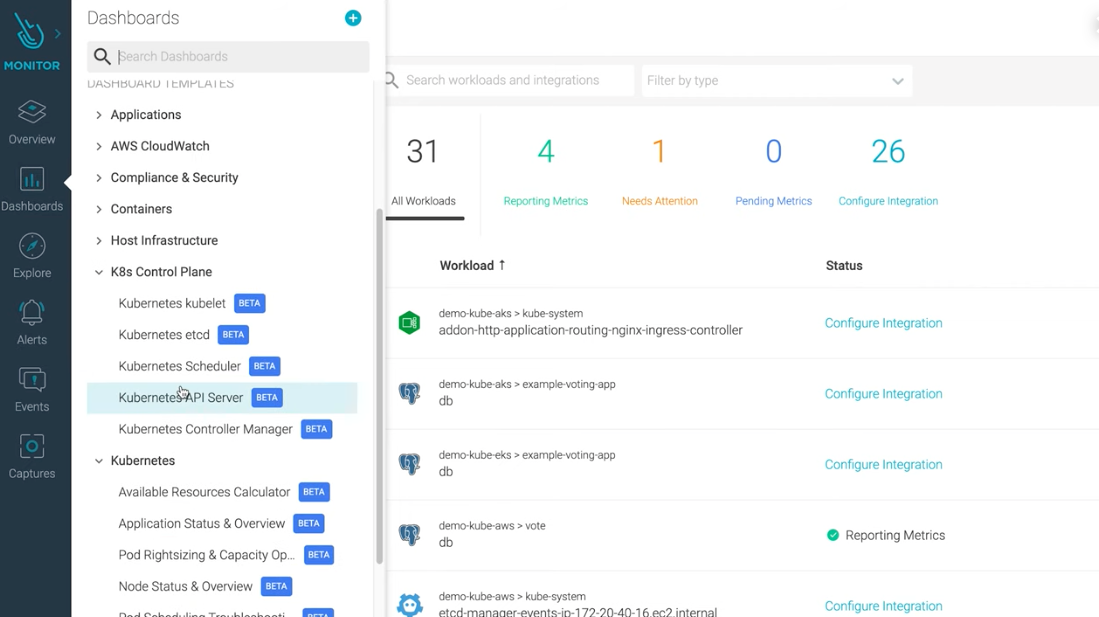
Cluster and Workload Status
Easily identify which workloads are running at any given point in time and which deployments are having problems so you can focus on the areas that need attention.
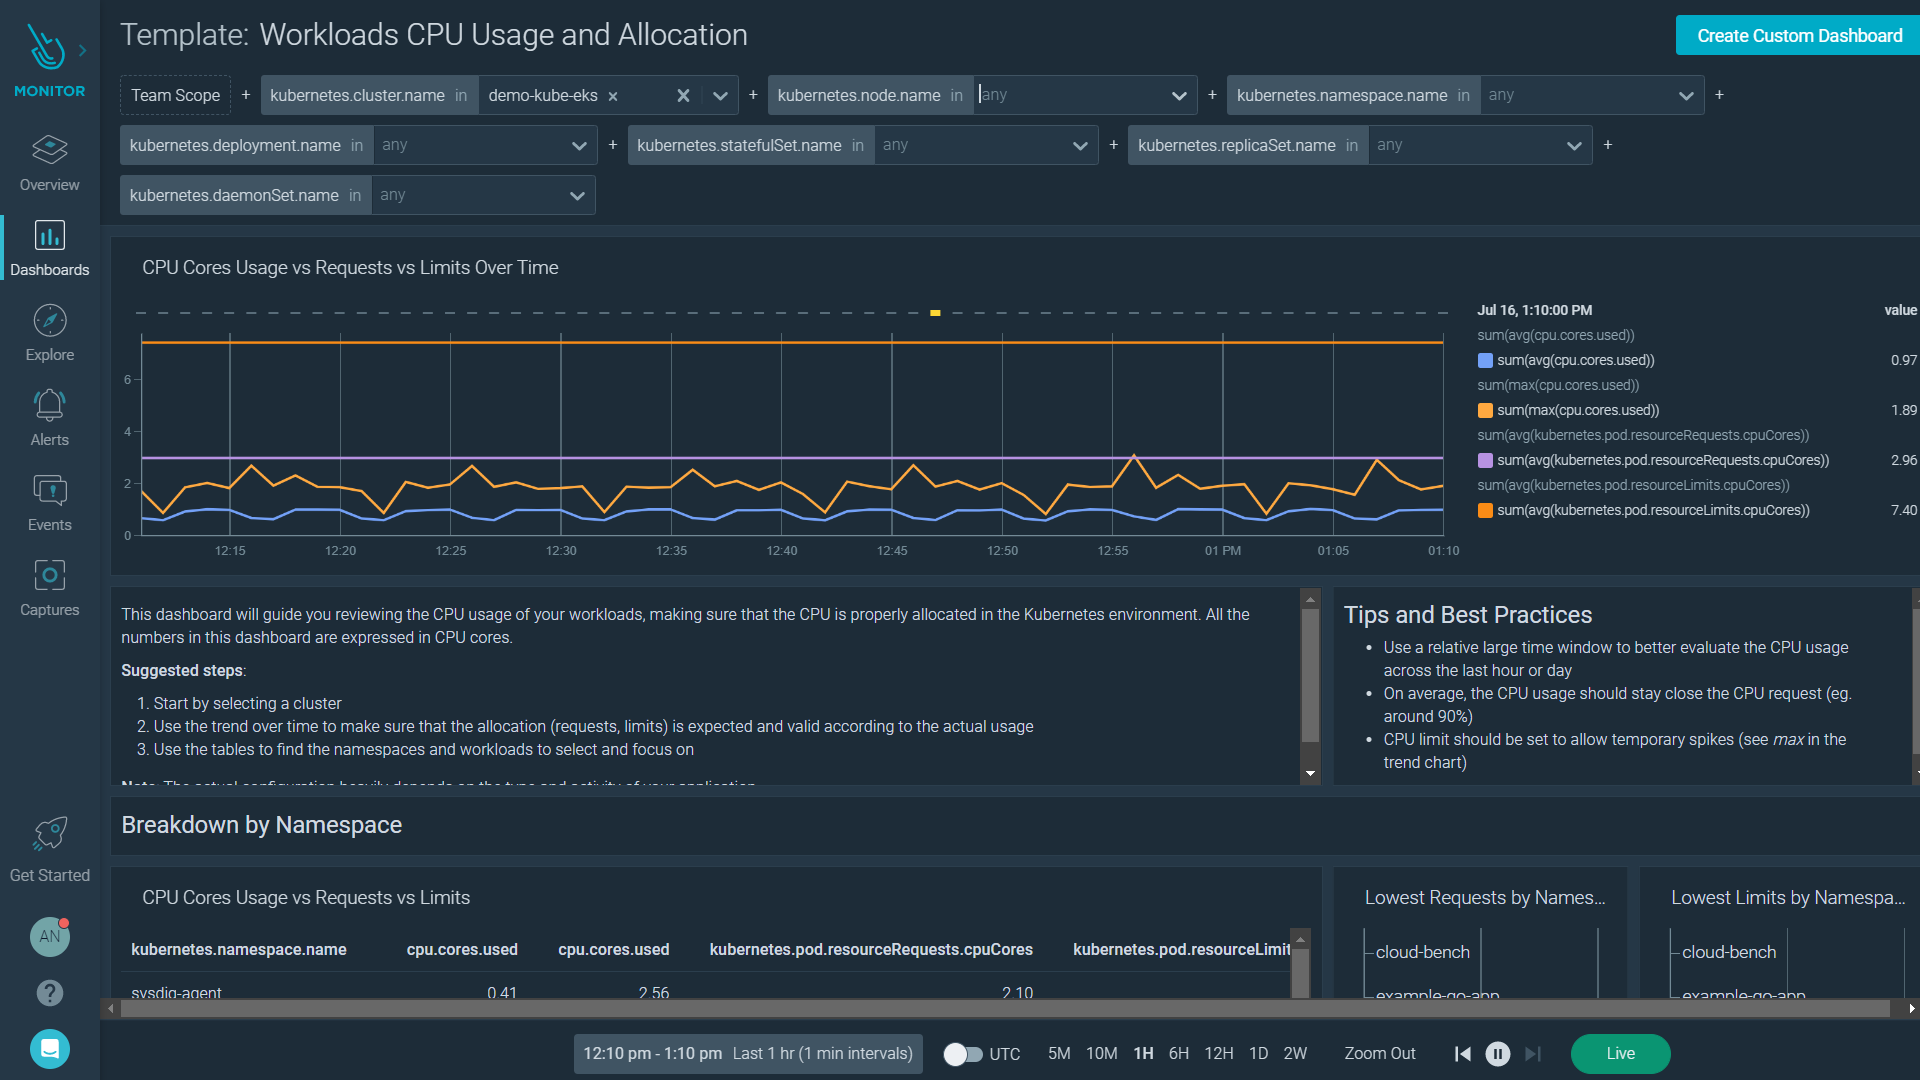
Resources Usage vs. Requests and Limits
View your workloads with an eye on the requests and limits you have set in your environment. Set alerts so that you know when you might need to make changes to avoid slowdowns and performance issues.
How to monitor Openshift with Sysdig Monitor
Announcing AWS Lambda Telemetry API Support for Sysdig Monitor