


Falco Feeds extends the power of Falco by giving open source-focused companies access to expert-written rules that are continuously updated as new threats are discovered.

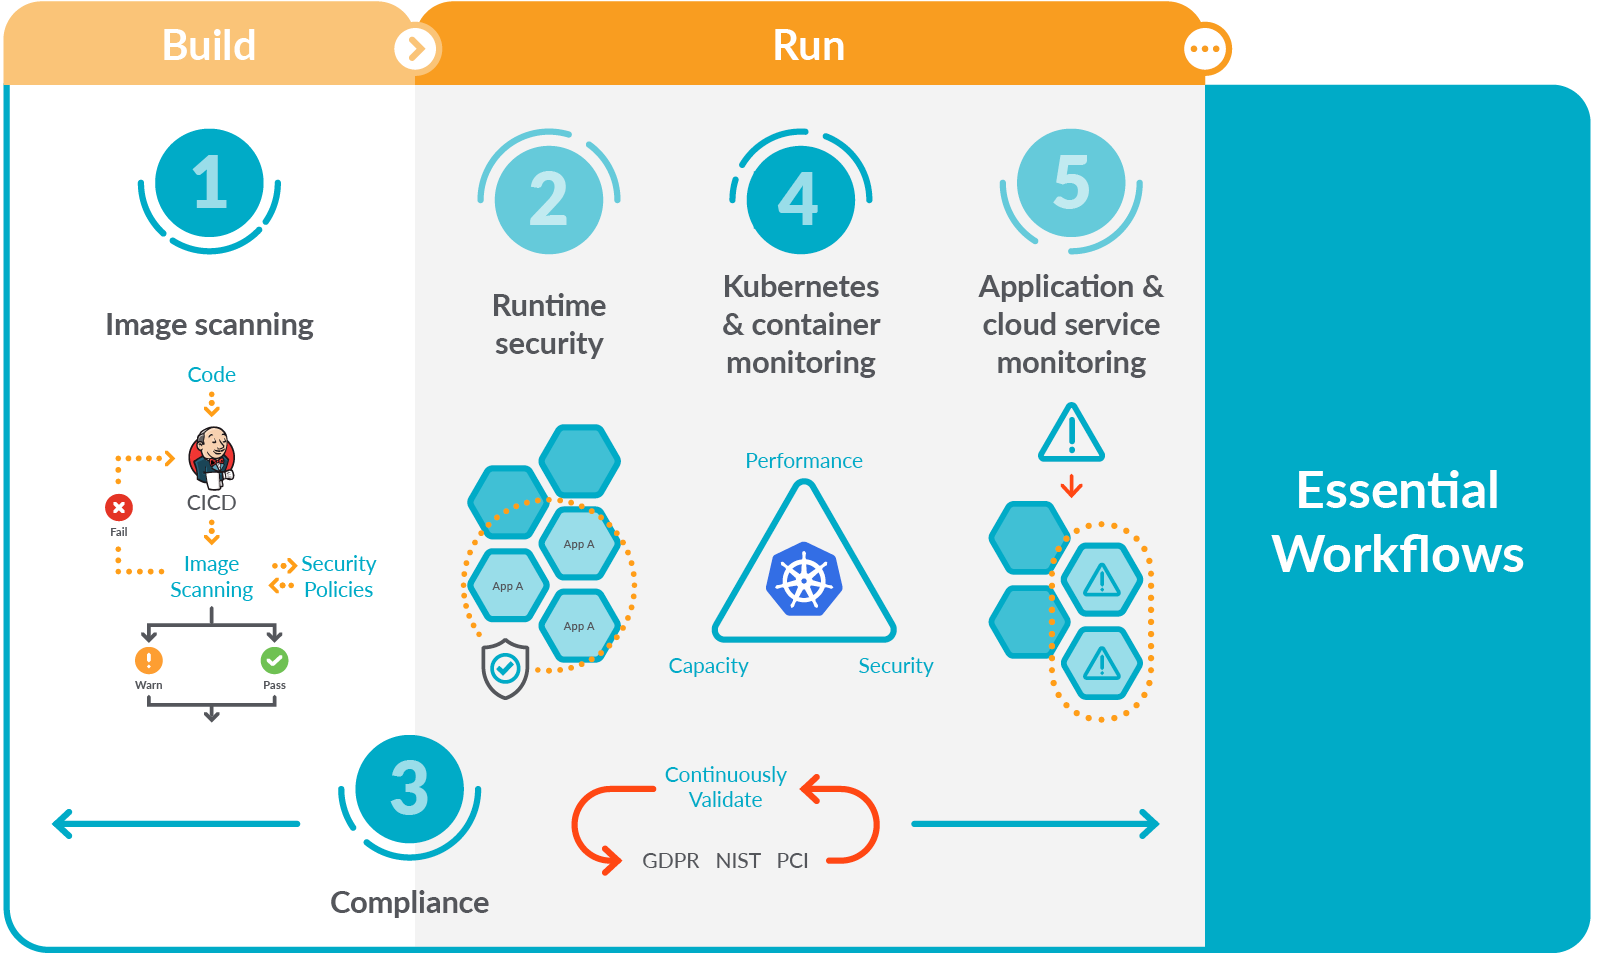
Focusing on these five essential workflows for secure DevOps will help you get started implementing monitoring, security, and compliance for containers and Kubernetes.
You might be starting to adopt DevOps and find that it dramatically simplifies deploying applications in containers and Kubernetes. However, you probably also found that it adds a new set of complexities for managing, securing, and troubleshooting applications.
Organizations often delay addressing monitoring and troubleshooting requirements, as they want to quickly get the basic CI/CD process set up. They compromise on security and compliance requirements, thinking those requirements will slow down development. As a result, teams are unprepared to address issues impacting application performance and availability in production. They may delay production rollout of some apps because they can't pass security and compliance audits.
The solution lies on the basics of DevOps. Automation is one of the pillars that makes DevOps effective, right? The same applies to securing DevOps.
With the right tools and strategies, you can experience how implementing monitoring, security, and compliance won't slow you down; rather, it will give you the confidence you need to run your containers in production.
Want to learn more about secure DevOps?
Download our 5 Keys to a secure DevOps Workflow →
Where to start with secure DevOps?
So, you want to start monitoring and securing your DevOps pipeline.
You might have already read plenty of recommendations and best practices all over the internet, and perhaps you're feeling a bit overwhelmed. That's why we summarized these tips into five essential workflows for secure DevOps, helping you focus on getting results quickly.
Let's introduce each of them.
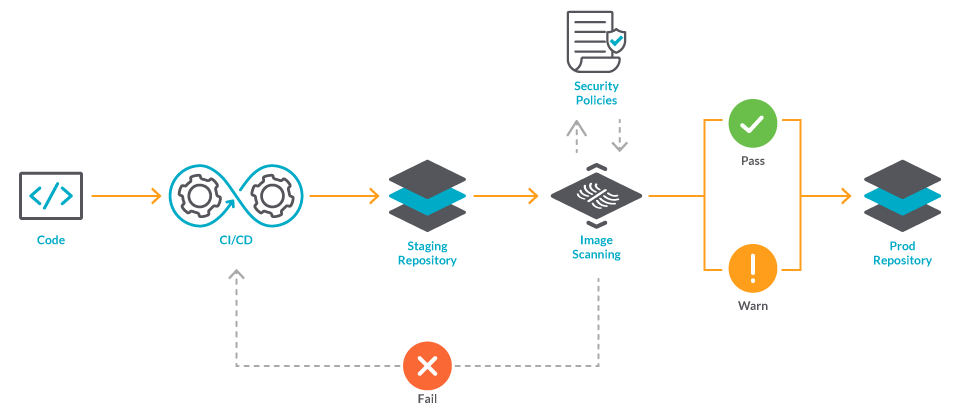
Image scanning
Image scanning refers to the process of analyzing the contents and the build process of a container image in order to detect security issues, vulnerabilities, and bad practices.
Tools typically gather Common Vulnerabilities and Exposures (CVEs) information from multiple feeds (NVD, Alpine, Canonical, etc.) to check if images are vulnerable. Some also provide out-of-the-box scanning rules to look for the most common security issues and bad practices.
Image scanning is a key function to embed into your secure DevOps workflow. As one of your first lines of defense, it can also help you detect and block vulnerabilities before they are exploited. By integrating security analysis and compliance validation into this process, you can address issues earlier and prevent slowing down deployment. This is known as "shifting security left."
For example, you could integrate security analysis and compliance validation in a CI/CD pipeline to block vulnerabilities from ever reaching a registry, in a registry to protect from vulnerabilities in third-party images, or at runtime to protect from newly discovered CVEs.
Fortunately, image scanning is easy to implement and automate. Check out our 12 Container image scanning best practices to adopt in production for tips that will help you adopt an effective container image scanning strategy.
Runtime security
What happens once a container is deployed? Your image scanning can miss undiscovered vulnerabilities or misconfigurations. That's why you need to implement runtime security; after all, your applications spend most of their time running, and it is there when they are most vulnerable.
The main strategy to securing your workloads during production is to adopt a zero trust approach. By granting the minimal permissions and access to your applications, you reduce the possible consequences of a security incident.
Then, as a last line of defense, you should look for abnormal behavior like unexpected use of resources, shell sessions, or network accesses.
Creating policies that can prevent attacks, but don't break the applications, is hard. It requires an understanding of what applications need to do, which services need to communicate with each other, and more.
Some recommendations to implement an effective runtime security are:
Leverage Kubernetes-native controls for runtime protection of cloud-native workloads. Kubernetes already has effective resources that can be extended to work with your security tools, so you don't need to add extra layers of complexity.
For example, Admission Controllers allow or block specific configurations and can determine whether a given container can be run on the cluster.
Additionally, Pod Security Policies (PSPs) can help you enforce those "least privilege" policies by defining what permissions pods receive at runtime. For example, it will define if a container is running in privileged mode, has access to the host network or filesystem, and more.
Leverage tools to automatically build policies since manual policy creation is a tedious process that is hard to maintain over time.
Most runtime security tools offer out-of-the-box policies you can customize and adapt to the specifics of your applications. Falco is the de facto Kubernetes threat detection engine, and its rule format is an approachable way to write and share runtime security policies.
Compliance
Compliance standards, like NIST, PCI, HIPAA, or CIS benchmarks, are collections of checks and best practices that, once followed, ensure that your infrastructure is secure for specific use cases. Sooner or later you will have to implement them, as providers for big organizations and governments are often required to be compliant.
Even if you're not required to, it's a good practice to validate against them. For example, it's recommended to start implementing compliance for container environments by validating the platform and container configuration using CIS benchmarks for Docker and Kubernetes.
One thing to have in mind is that compliance isn't something you check from time to time. Right when you stop looking is where the issues will happen. You need continuous compliance validation across the whole application lifecycle.
Implement compliance during build, mapping container image scanning policies to standards (i.e., most standards will require you to check for containers running as root) or internal compliance policies (blacklisted images, packages, or licenses).
Also, implement compliance at runtime. The best practices you already implemented are the core of compliance standards. Most runtime security tools also have out-of-the-box policies to cover specific recommendations for PCI and NIST. You should additionally deploy runtime policies that detect known attacks using frameworks like MITRE ATT&CK.
Capturing activity audit data for forensics benefits compliance as well. It's important to record configuration and policy changes, including an audit of runtime changes for compliance audits such as SOC2, PCI, ISO and HIPAA.
Kubernetes and container monitoring
Monitoring the dynamic nature of container-based applications is critical for high availability and performance of cloud services.
Containers are short-lived, dynamic, and churn constantly. Once a container dies, everything inside is gone. You cannot SSH or look at logs, and most of the traditional tools used for monolithic applications are of little help when something goes wrong! Containers are great for operations as we can package and isolate applications to consistently deploy them everywhere, but at the same time, this makes them blackboxes which are hard to troubleshoot.
To make things worse, microservice-based applications can be distributed across multiple instances, and containers can move across multi-cloud infrastructure as needed. This makes it harder to correlate events and metrics, which is usually key to finding the causes of performance and availability issues.
Monitoring the Kubernetes orchestration state is crucial to understanding if Kubernetes is keeping all of the service instances up and running. To do so:
Monitor health and performance gathering metrics at all levels – from infrastructure up to the applications – including services and the operational status of your Kubernetes cluster.
Identify pods consuming excessive resources and monitor capacity limits. This will help you reduce cost by optimizing capacity across clusters and clouds.
Finally, monitor auto-scaling behavior to control unexpected billing and application rollouts and rollbacks of deployment.
Application and cloud service monitoring
Latency, Error, Traffic, and Saturation metrics are known as the Golden Signals for monitoring service health. These metrics indicate real health and performance of your application as seen by users interacting with that service. You can save time by looking at what really matters, as well as avoiding traps that could mask the real problems with applications.
Tagging your metrics with Kubernetes and cloud context will also help identify owners so you will be able to resolve issues faster.
Prometheus has become the de-facto standard for visibility in Kubernetes environments. Your teams are probably already using it, so you should leverage their investment by looking for monitoring tools with full Prometheus compatibility (including PromQL & Grafana dashboards).
Get productive faster by using PromCat.io, a resource catalog of Prometheus integrations with curated, documented, and supported monitoring integrations for Kubernetes platforms and cloud-native services.
Try to collect the information for each workflow in one global application. A single source of truth across applications' availability and security, allows teams to resolve issues faster. And this, at the end, increases reliability.
Conclusion
These five essential workflows for secure DevOps will help you get started with security, compliance, and monitoring for your cloud-native environment.
Later on, as your team gains more experience with Kubernetes and containers, they can move on to more advanced workflows that further strengthen security and resilience.
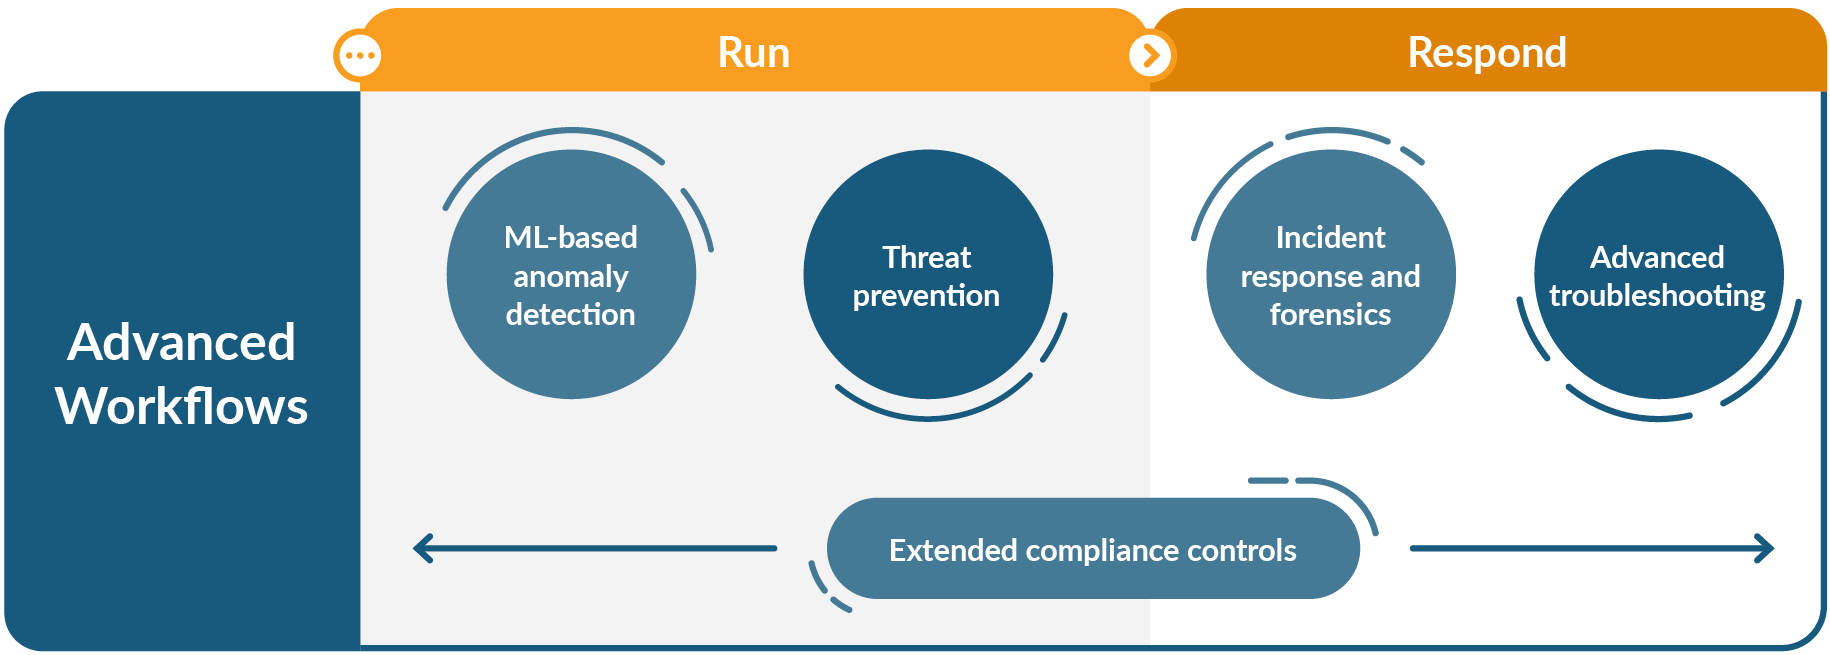
Those are: Advanced troubleshooting, machine learning-based anomaly detection, threat prevention, incident response and forensics, and extended compliance controls. These advanced enterprise workflows include specialized capabilities that yield greater efficiency for DevOps teams.
Want to learn more about secure DevOps? Download our 5 Keys to a secure DevOps Workflow.
Find out how you can ship cloud applications faster! Embed security, validate compliance, and maximize performance and availability with the Sysdig Secure DevOps Platform.
Start your free trial to start delivering on your cloud service performance, availability, and security goals. Try it today!