Falco
The cloud-native solution for threat and anomaly detection, created by Sysdig and contributed to the CNCF.
READ MORE
Sysdig Monitor makes it easy to find detailed information about your Kubernetes environment. Bonus: We are fully Prometheus compatible!
See all Kubernetes details in one place and troubleshoot Kubernetes errors up to 10x faster.
Prometheus made simple with a managed service. Scale quickly with out-of-the-box dashboards, alerts, and integrations.
Reduce wasted spending by 40% on average and save with low-cost custom metrics.
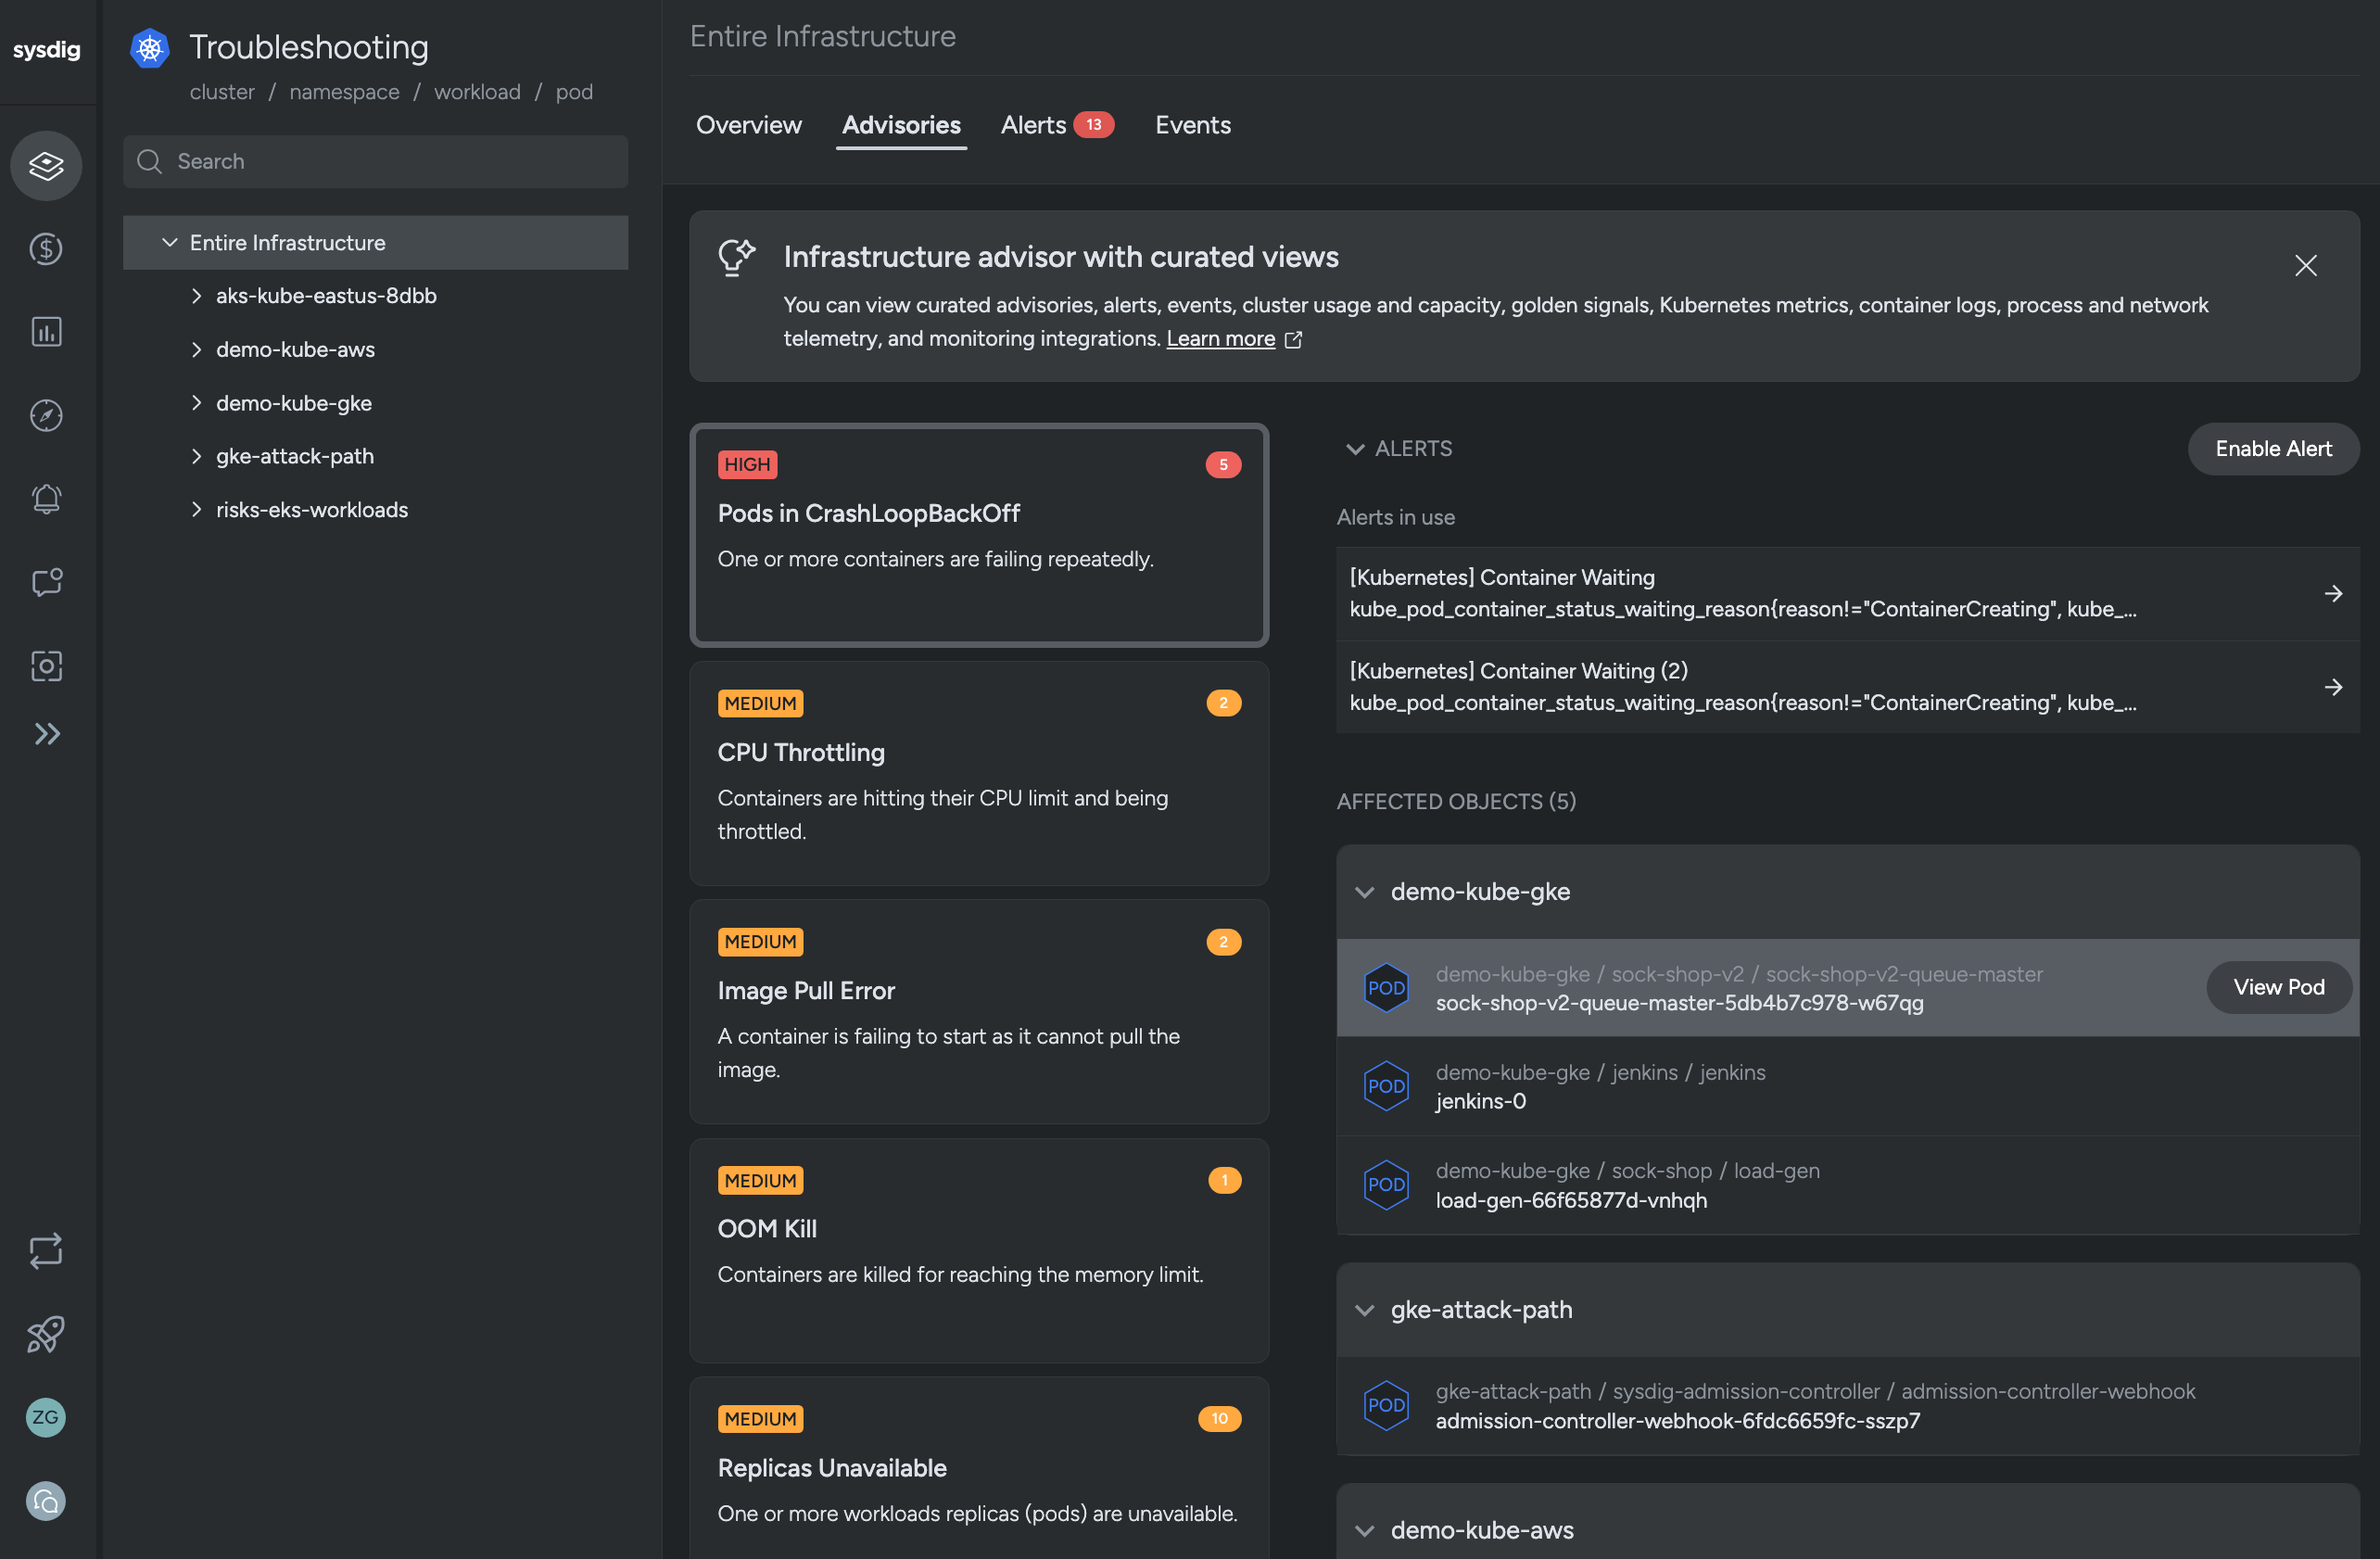
Troubleshoot Kubernetes errors faster with a prioritized list of issues, pod details, live logs, and remediation steps.
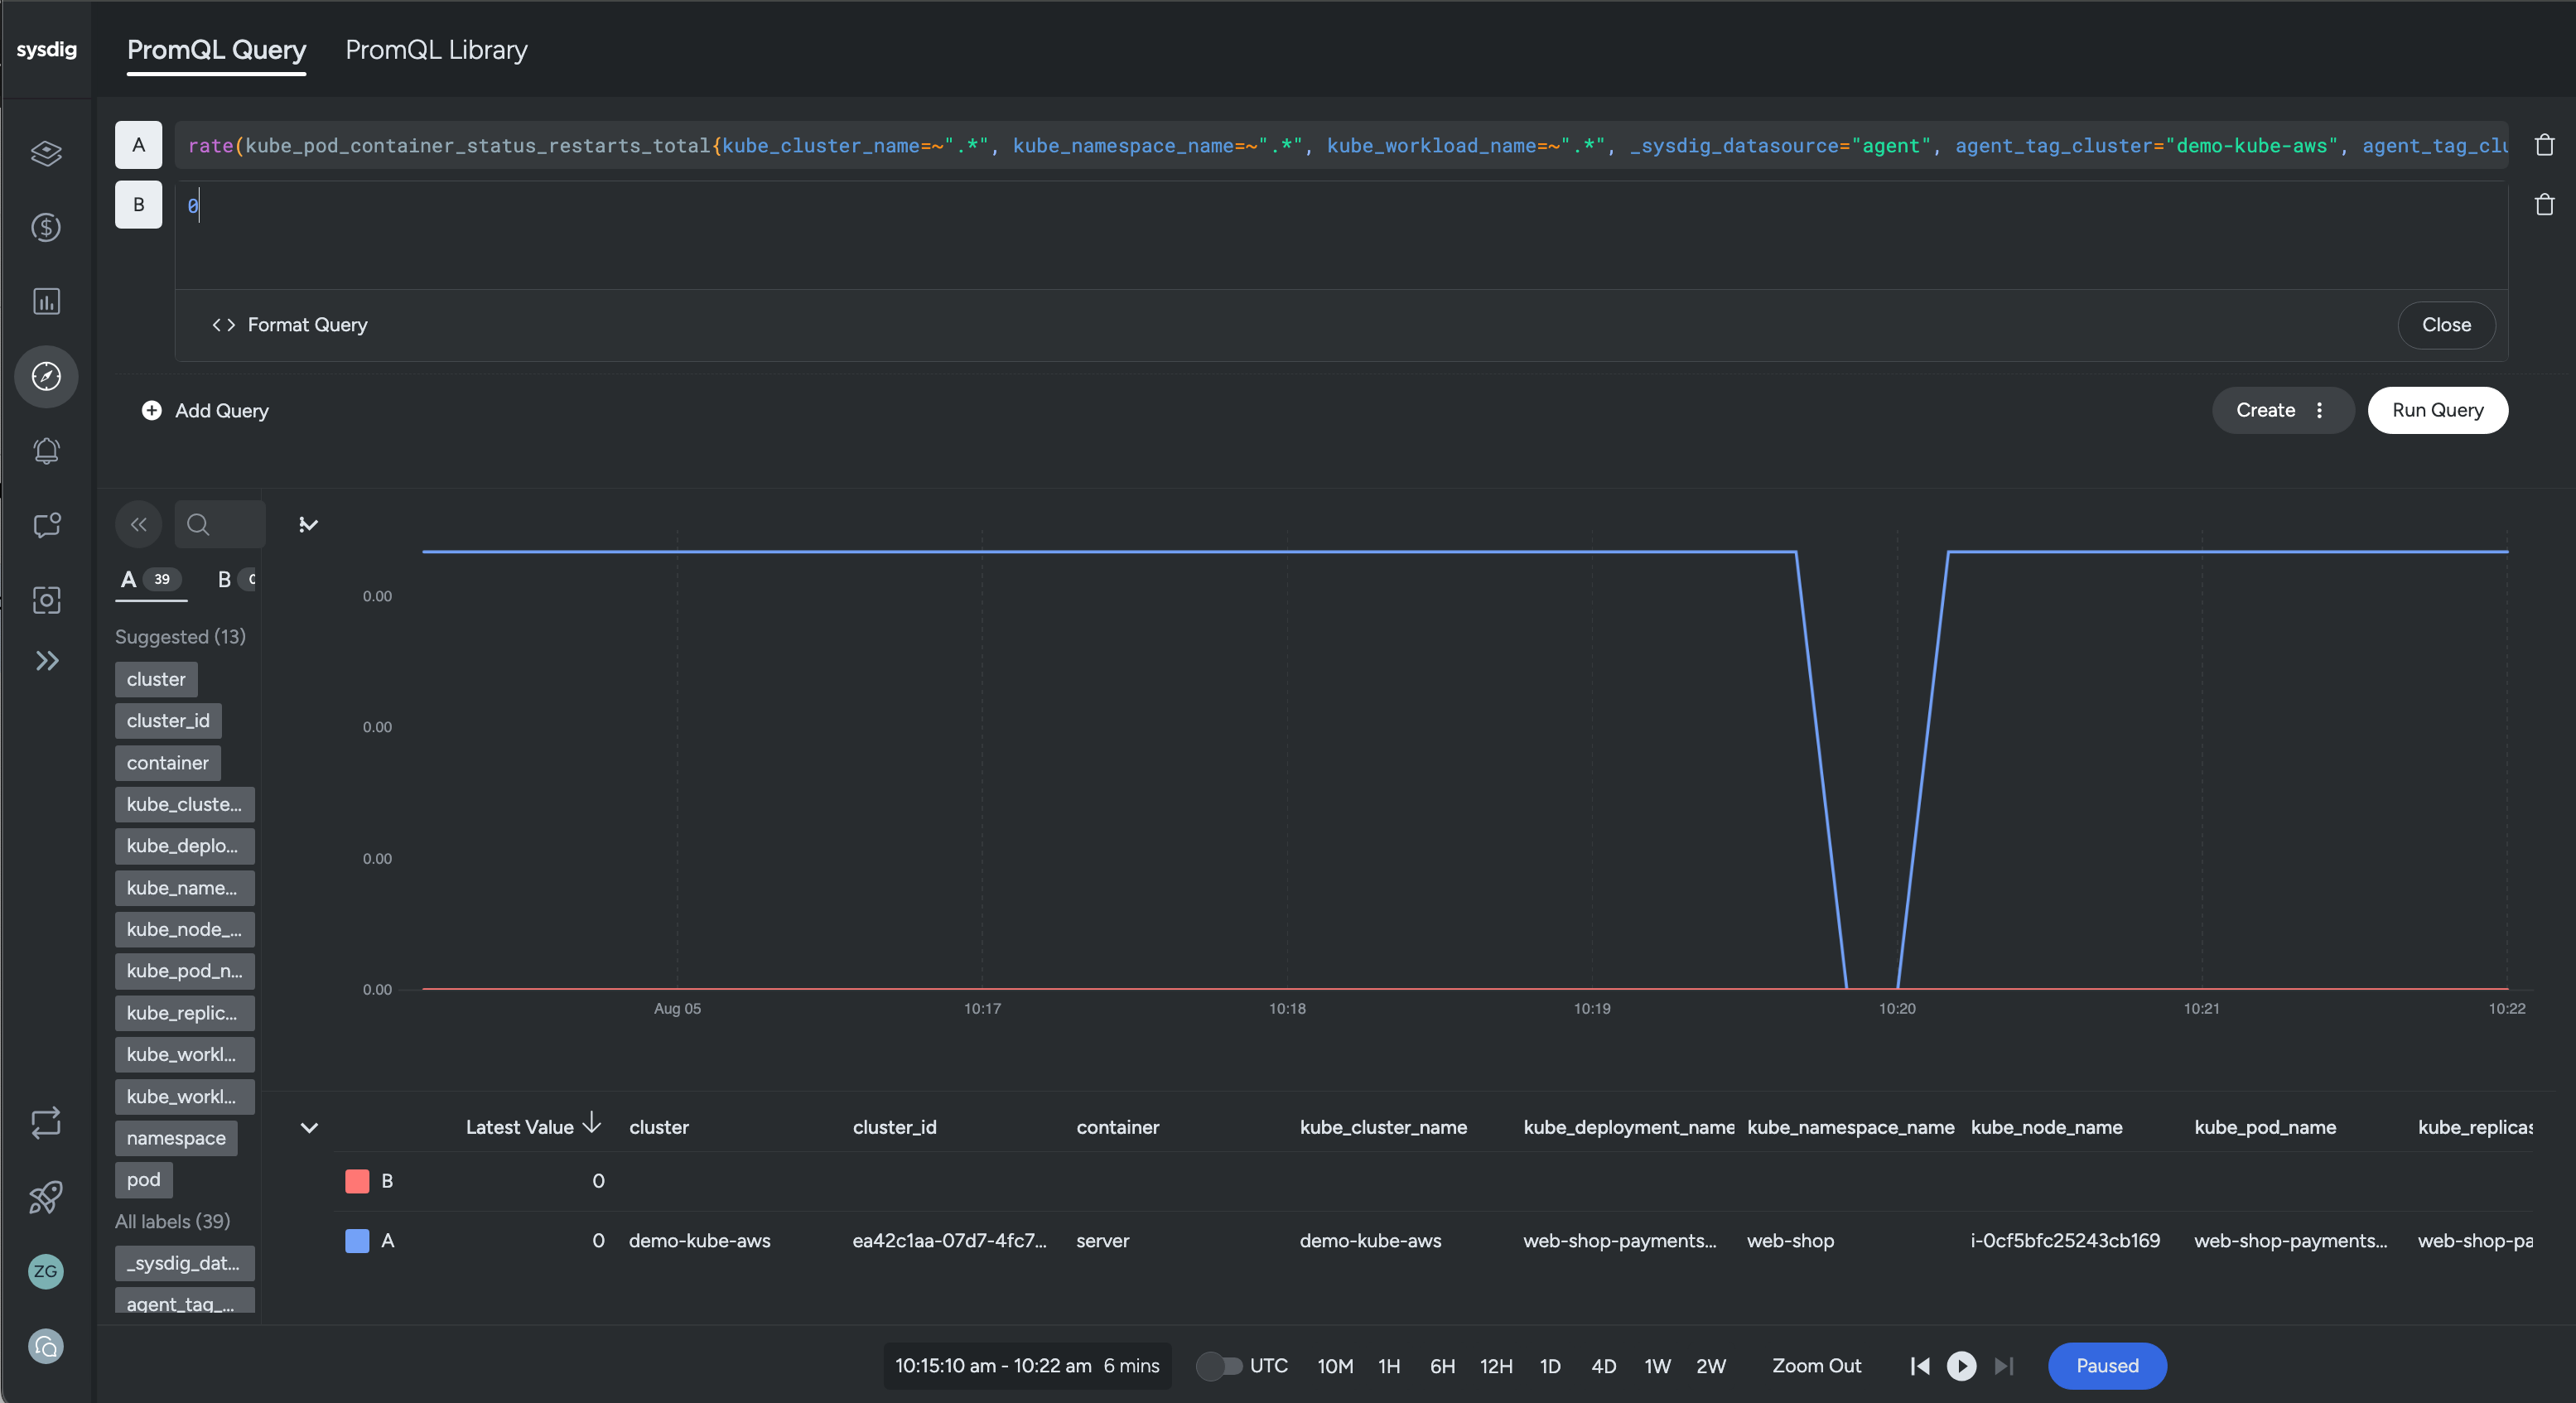
Our managed Prometheus service saves time! Use our scalable data store, automatic service discovery, and assisted integration deployment. Keep your PromQL and Grafana dashboards.
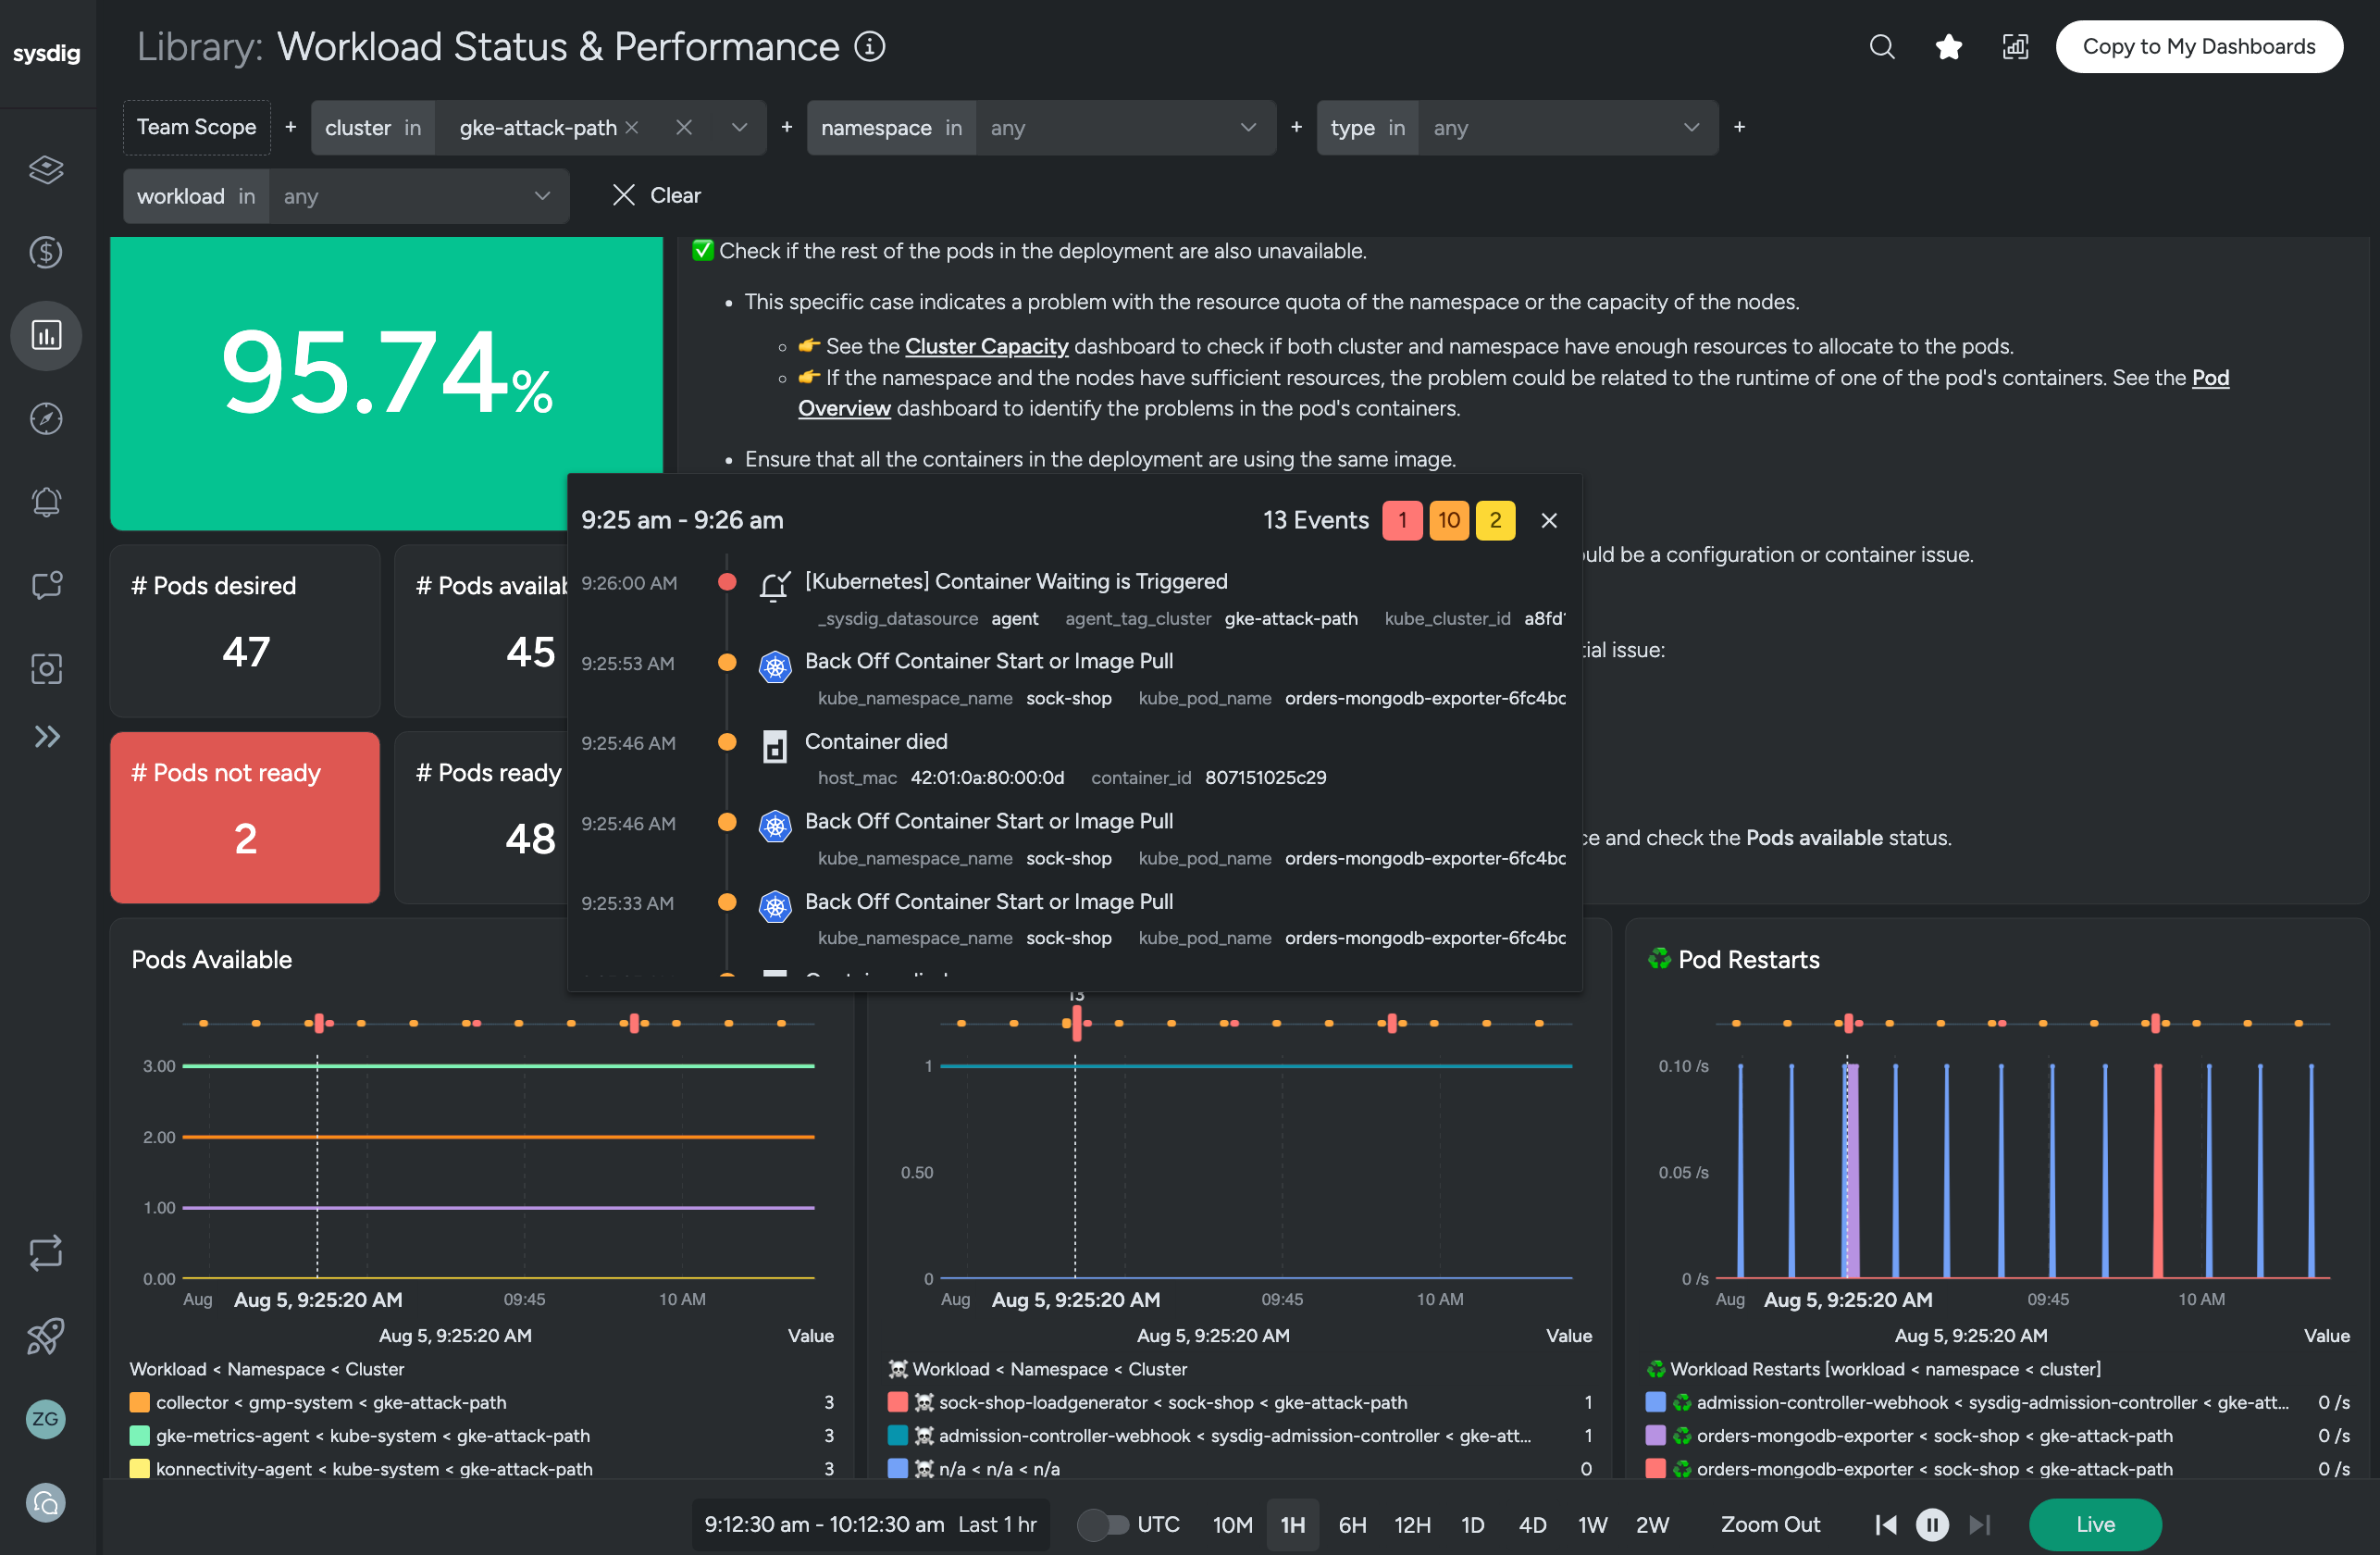
Dashboards are available out of the box and you can customize any dashboard easily. Alerts are highly configurable and ready to integrate into your alert management system.
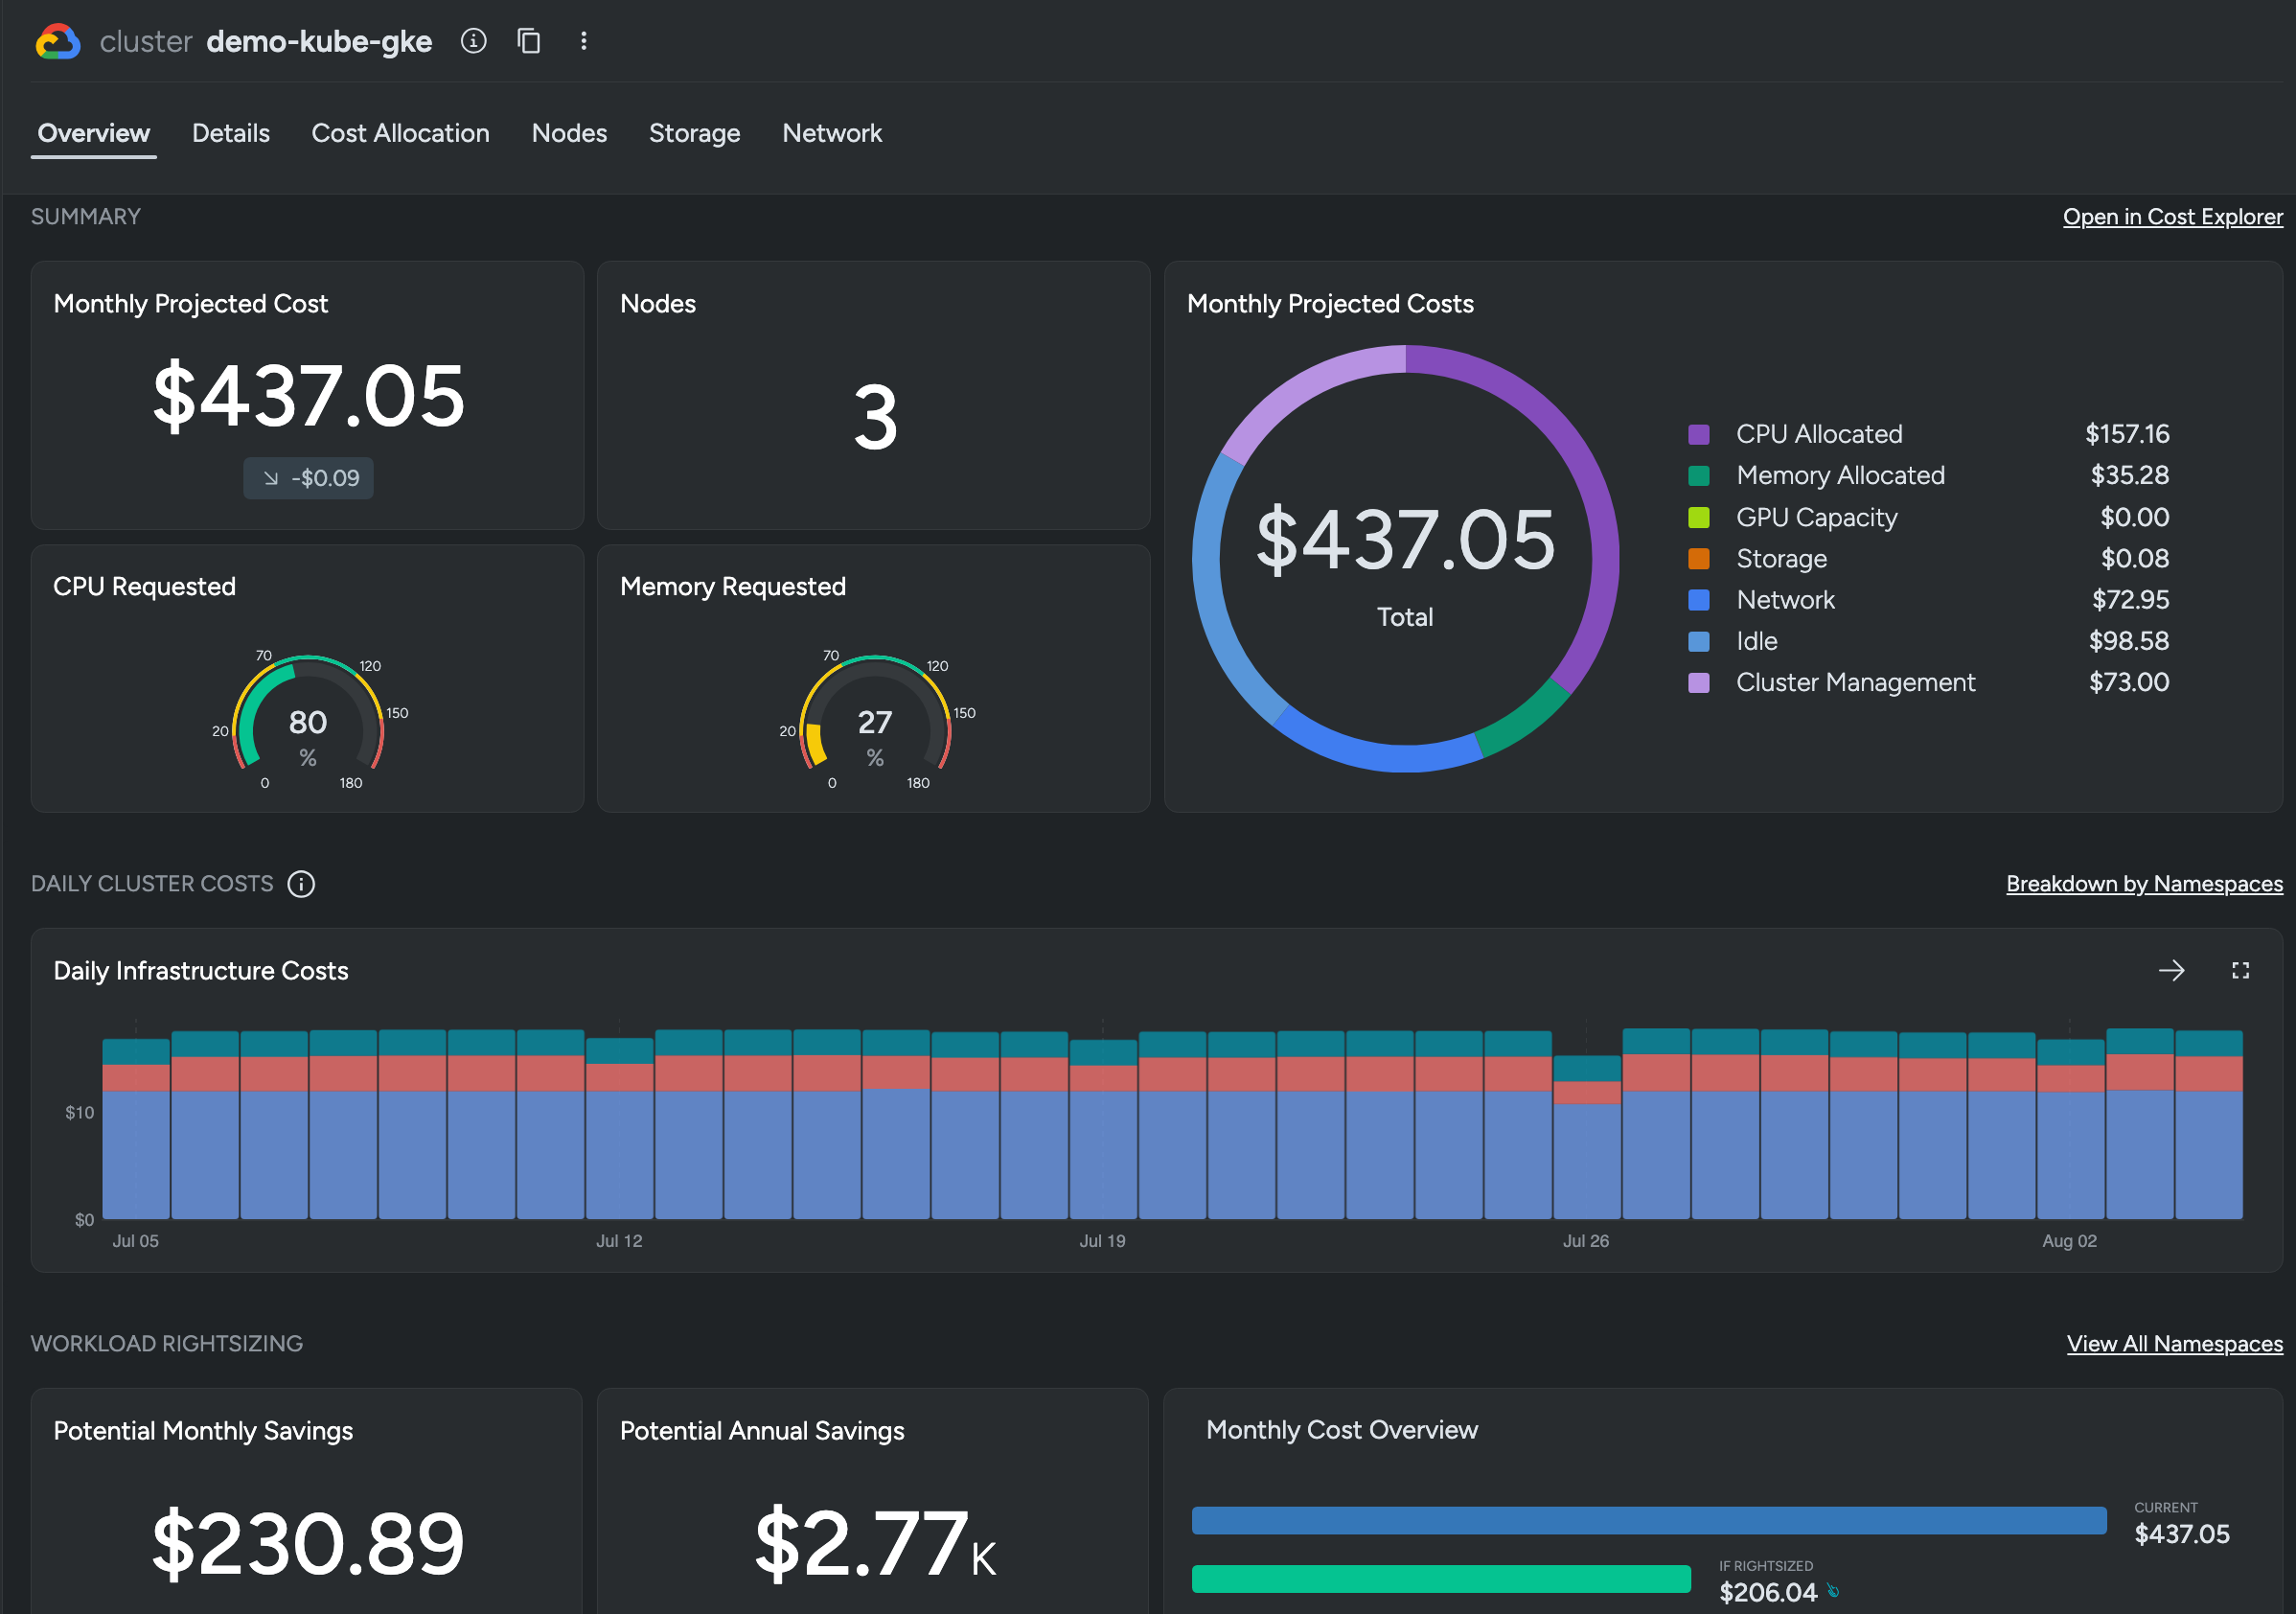
See detailed utilization of your Kubernetes resources to eliminate wasteful spending. Cut costs with our affordable custom metrics and quickly see where those metrics are coming from.
Gain deep visibility into Kubernetes health and performance.
A cloud monitoring tool providing deep visibility.
Monitoring that is radically simple and fully compatible with open source.
Ingest high-volume custom metrics in any format at a low cost.
Predictable cost analysis and savings estimates for Kubernetes.
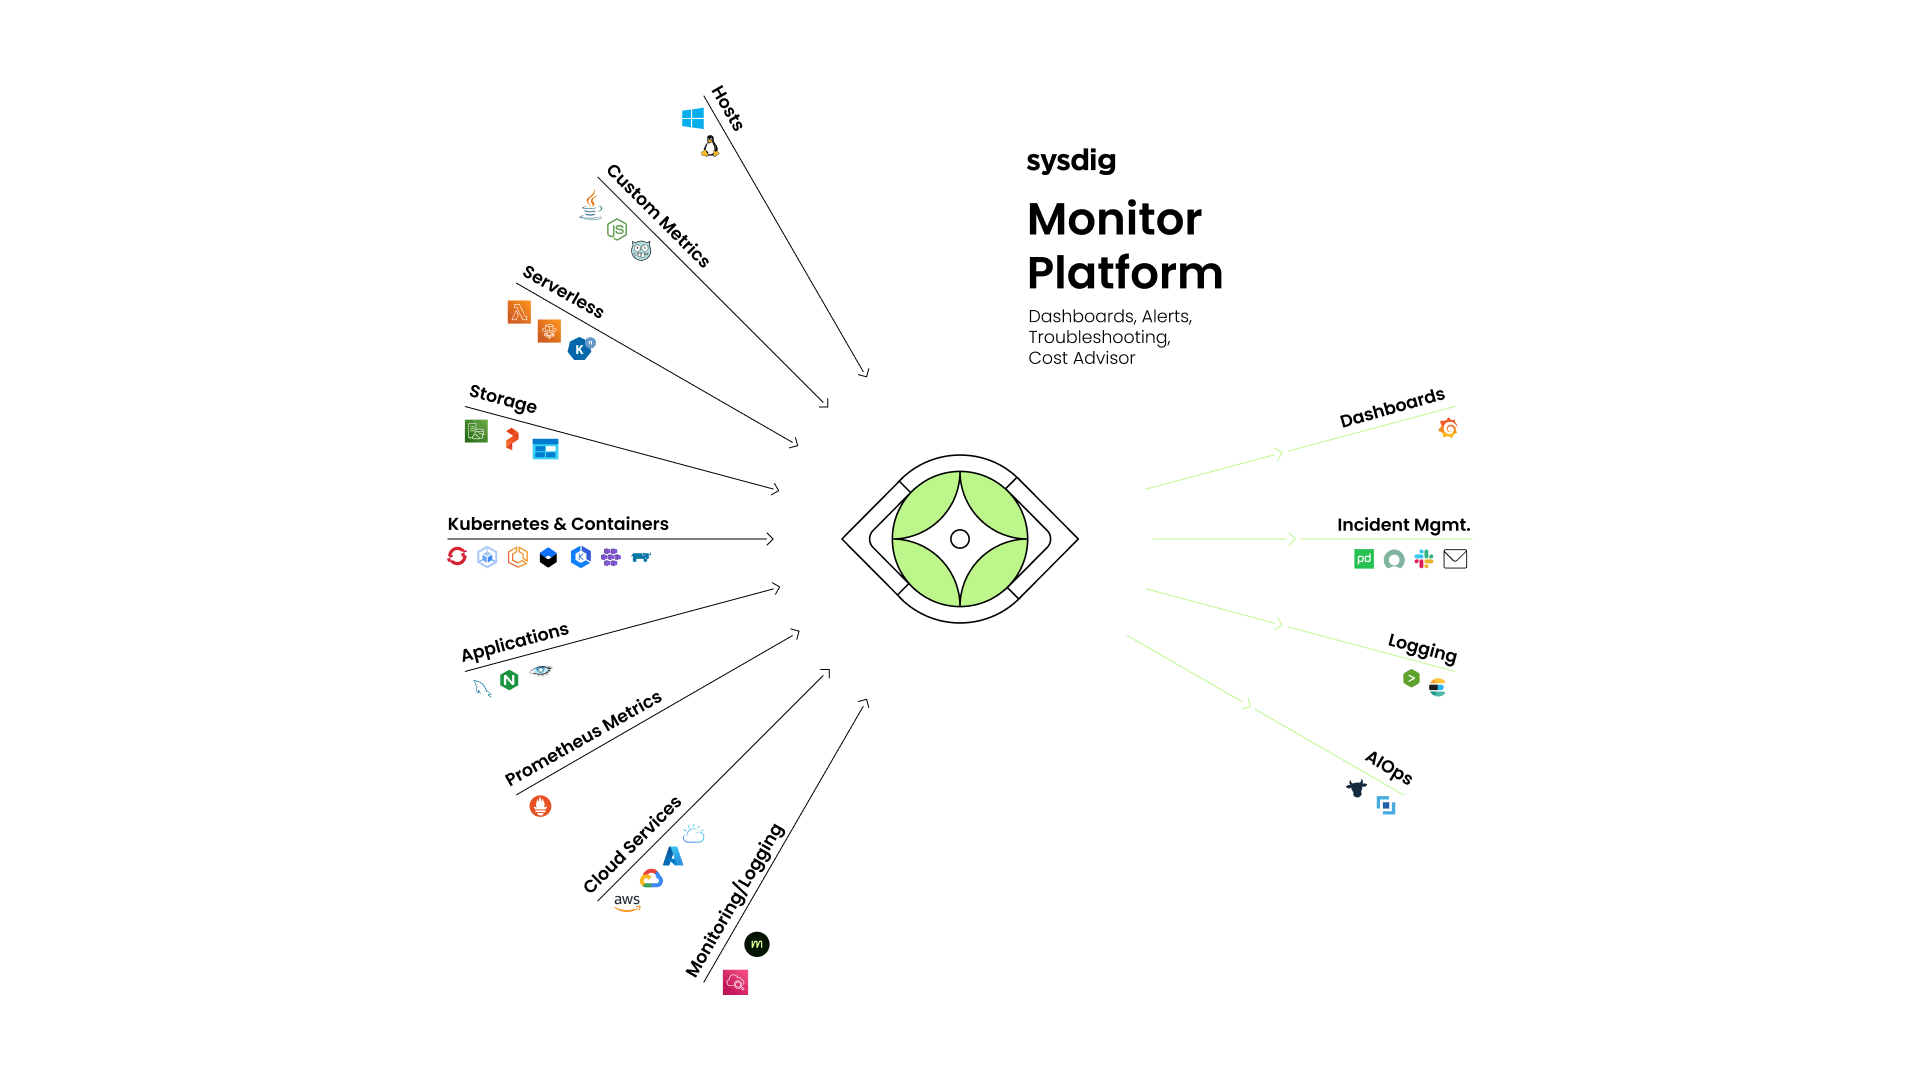
Sysdig Monitor collects metrics about your environment; we then correlate and enrich those metrics so you get application availability, performance, and fast problem resolution.

Sysdig grew out of open source, and we are a big supporter of open standards. Open standards like Falco and Prometheus benefit users by providing a consistent approach to solving problems while avoiding vendor lock-in.