


Falco Feeds extends the power of Falco by giving open source-focused companies access to expert-written rules that are continuously updated as new threats are discovered.

Today Sysdig announced the availability of IBM Cloud's new IBM Cloud service monitoring solution. The new capability – an extension of IBM Cloud Monitoring with Sysdig – provides pre-defined service metrics and dashboards for IBM public cloud services. This means that for IBM developed and operated offerings such as Event Streams, Cloud Databases, Cloud Object Storage, and Cloud Foundry, users can now view detailed metrics from a single monitoring interface to identify and resolve bottlenecks in applications and infrastructure.What's unique about the new Sysdig service is that it enables monitoring of performance for resources where an agent cannot be installed, such as managed offerings like database services or cloud storage. Consequently, users now gain visibility into a broader range of cloud-based capabilities. This is achieved by taking advantage of Sysdig's native Prometheus compatibility and our ability to monitor cloud environments at scale. (See our recent fully compatible Prometheus monitoring announcement).
IBM Cloud and Sysdig introduce service metrics for consolidated monitoring of cloud apps Click to tweet IBM Cloud service owners have pre-defined metrics and instrumented their services based on the Prometheus metric format. As a result, meaningful data insights are now readily available to IBM Cloud customers. You simply tap into the metrics using your Sysdig monitoring instances. In addition, service owners have pre-built dashboards crafted to help you get started quickly and to provide an optimal monitoring experience within the Sysdig user interface for each service.What this means for IBM Cloud users is that they now have a consistent and unified solution for monitoring infrastructure, applications, and services. With this consolidated visibility, developers and DevOps teams can identify, correlate, and resolve issues faster. What's more, teams can use IBM Cloud Monitoring with Sysdig to monitor any environment, including on prem, as well as other cloud deployments. Access to a unified view of everything in one place increases cross‐team collaboration and fosters faster innovation.
Cloud-native monitoring for a broad range of IBM Cloud services
IBM offers service monitoring (aka platform metrics) for the various solutions within its portfolio, including compute infrastructure services, compute Cloud Foundry resources, platform database services, platform integration services, platform storage services, and VPC infrastructure. For each, a specific set of metrics have been defined and custom dashboards built.
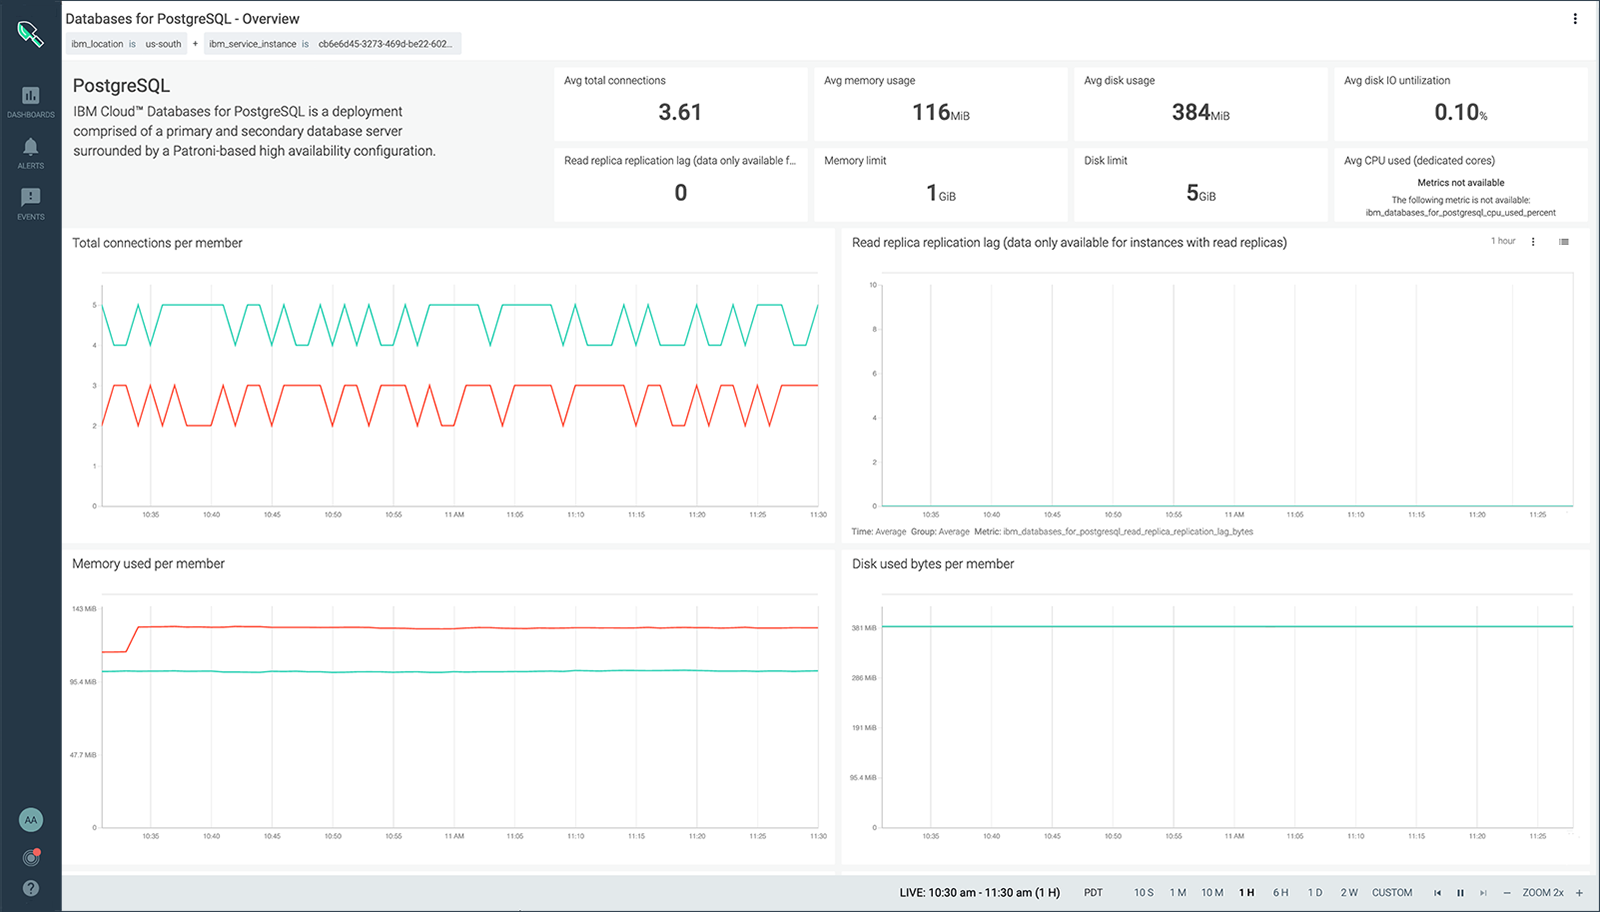
IBM Cloud Service Monitoring DashboardLet's look at some of the solutions IBM Cloud now offers and the types of metrics now available on the IBM Cloud using the Sysdig-powered solution.
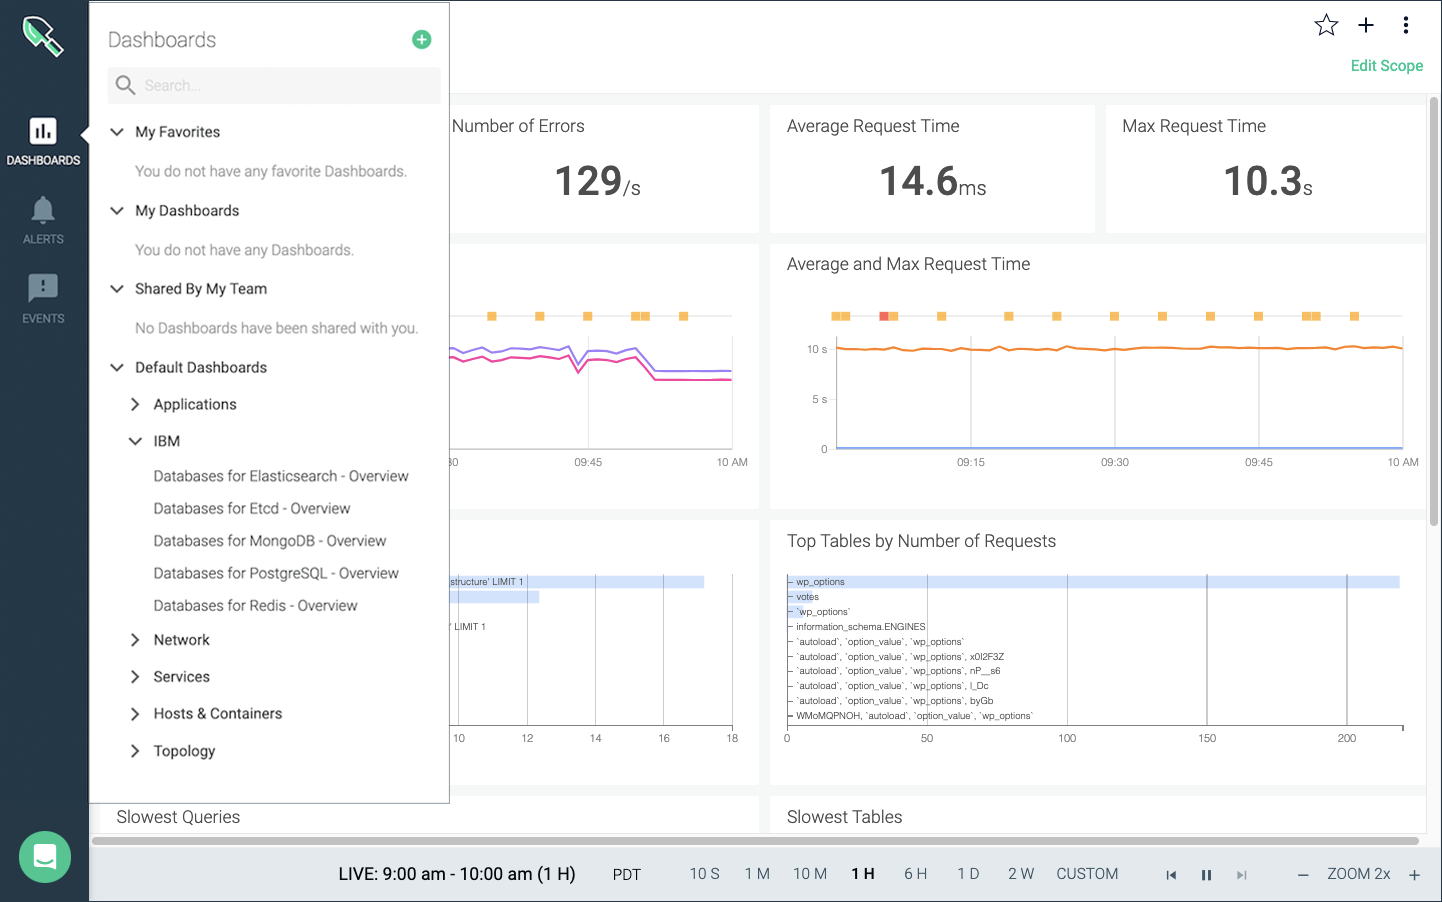
Accessing pre-build database service metrics dashboardsThe IBM Cloud Monitoring with Sysdig and platform metrics capability is available in all six IBM Cloud multi-zone regions, giving users globally an opportunity to take advantage of the service. Developers crafting solutions using a microservices approach can choose any of these IBM Cloud components and simply monitor everything in a single place.Read the IBM blog – Introducing IBM Cloud Platform Metrics – for the IBM Cloud perspective.Using native Sysdig capabilities, DevOps teams can drive even greater efficiency by crafting custom views, setting alerts, and correlating activity within and across services. In addition, Sysdig enables teams to confidently see and manage capacity – a big challenge in dynamic, cloud-native environments – helping to size their platforms and services to meet demand.
How to get started
IBM has enabled IBM Cloud Monitoring with Sysdig as its preferred solution for performance and operational data across its cloud services. Moreover, whether you're using a solution like IBM Kubernetes Service (IKS) or now any of its supported IBM Cloud service offerings you can tap into this resource to help you maximize availability and performance.IBM has made it easy to get started using its services including monitoring with Sysdig. You can create an IBM Cloud account to check out the new services and all their features, free of cost for a limited trial period.