


Falco Feeds extends the power of Falco by giving open source-focused companies access to expert-written rules that are continuously updated as new threats are discovered.

Today at Kubecon we announced the availability of IBM Cloud Monitoring with Sysdig. Together, IBM and Sysdig have launched this new offering to provide a fully managed enterprise-grade monitoring service for cloud-native applications on IBM Cloud. If you build, ship, and run applications on IBM Cloud, you now have direct, integrated access to Sysdig Monitor. As a result, with just a few clicks you get application visibility, alerting, and troubleshooting designed for production at scale. All running within IBM Cloud! We're pretty excited about the new joint solution and what it brings to enterprise development and IT teams. Read on to learn more…
\r\r
Integrated monitoring for cloud-native apps on IBM Cloud
\r\r
Without a doubt, clouds have made it far easier for DevOps and IT teams to provision infrastructure and roll out new applications. However, at the same time, with the dynamic nature of clouds come new challenges. For example, understanding and troubleshooting the activity of ephemeral container-based services complicates monitoring. Will you be able to diagnose and report on an issue with containers that are no longer running? In addition, what if you're using an orchestrator, such as Kubernetes? Will you be able to automatically measure and alert on activity of services that are auto-scheduled and auto-scaled across a cluster of nodes?
\r\r
For these reasons, IBM is partnering with Sysdig – to increase observability and provide IBM Cloud users with a cloud-native monitoring solution that ensures 100% visibility into your cloud services. In fact, IBM recognized Sysdig as a leader in the industry – among the top 10 container startups driving innovation and enterprise-ready solutions for cloud-native applications at scale.
\r\r
Increasing service reliability with deep insights
\r\r
IBM Cloud Monitoring with Sysdig extends well beyond basic host and network metrics. Most importantly, it provides broad and deep insight into containers – and the processes running inside – along with full Kubernetes context. What's more, this makes it far easier for you to understand exactly what your orchestrated microservices are doing and how they interact.
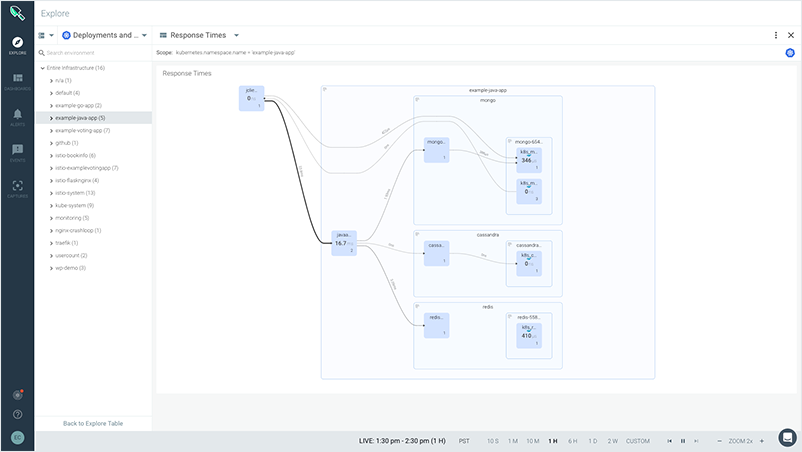
Microservices Topology Map
\r\r
If, for instance, you're deploying services on the IBM Cloud Kubernetes Service (IKS), you'll find that the new offering greatly simplifies observing the health and performance of your containers as well as the state of your Kubernetes resources. Equally important, IBM Cloud Monitoring with Sysdig lets you dig deep when you need to solve a problem. By capturing all events, commands, file system activity and more, you can quickly drill down and correlate activity to find root cause.
\r\r
In its IBM Cloud Monitoring with Sysdig announcement blog, IBM explains the value of Sysdig this way: "Sysdig gives you deep container visibility, service-oriented views, and comprehensive metrics to help you find threats and eliminate problems effectively and efficiently." Further, they go on to list what they see as the key capabilities of Sysdig Monitor:
\r\r
- \r
- Accelerate the diagnosis and resolution of performance incidents \r
- Control the cost of your monitoring infrastructure \r
- Explore and visualize easily your entire environment \r
- Get critical Kubernetes and container insights for dynamic microservice monitoring \r
- Mitigate the impact of abnormal situations with proactive notifications \r
- Manage your users and group them into teams so that you can control access to data \r
- Troubleshoot your applications and infrastructure \r
IBM Cloud Monitoring with Sysdig: How it works
\r\r
With this release, the new IBM Cloud Monitoring service based on Sysdig Monitor is offered to all customers as they provision new servers and manage existing ones. The service is available now, so users can configure and start monitoring today. Sysdig instrumentation is automatically deployed, monitoring capabilities are instantly provisioned, and billing is unified in your IBM Cloud account.
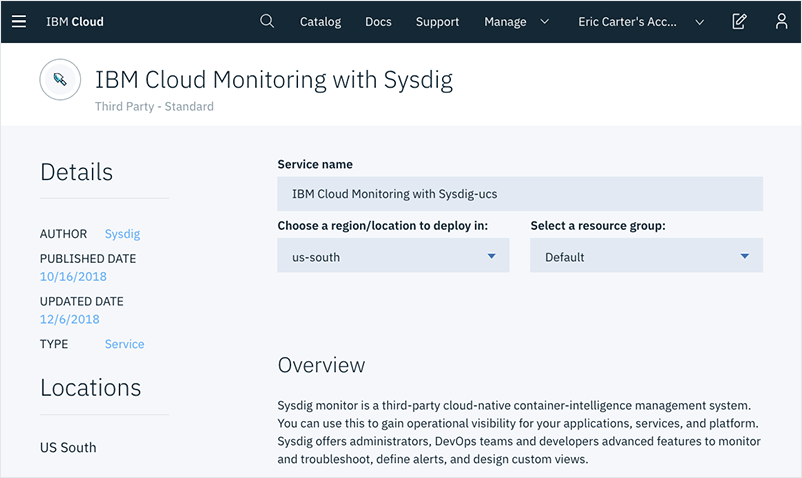
Choosing Sysdig monitoring on IBM Cloud
\r\r
Once you provision a resource instance in the IBM Cloud and deploy a Sysdig agent in a metrics source, collection and forwarding of metrics to the instance is automatic. The IBM Cloud Monitoring with Sysdig agent automatically collects and reports on metrics and events across your cloud instances, containers, orchestration, and more. In fact, this includes the ability to pick up and display any custom metrics, like Prometheus, JMX (java), or StatsD. This is an added bonus, especially if your apps are instrumented with these technologies. It also connects with and collects orchestrator data like kube-state-metrics. Furthermore, you can correlate all these different metrics and events to identify how the interplay of various resources may be impacting performance.
\r\r
How to get started with IBM Cloud Monitoring
\r\r
Now that the service is live, getting started is as easy as creating an IBM Cloud account. You'll find the IBM Cloud Monitoring with Sysdig in the developer tools area of the catalog. In addition, you can navigate to the new observability category within the IBM Cloud console to learn more and access the solution. Just click and add the IBM Cloud Monitoring with Sysdig service. What's more, you can check out the new service and all its features free of cost for 30 days by using the trial service plan.
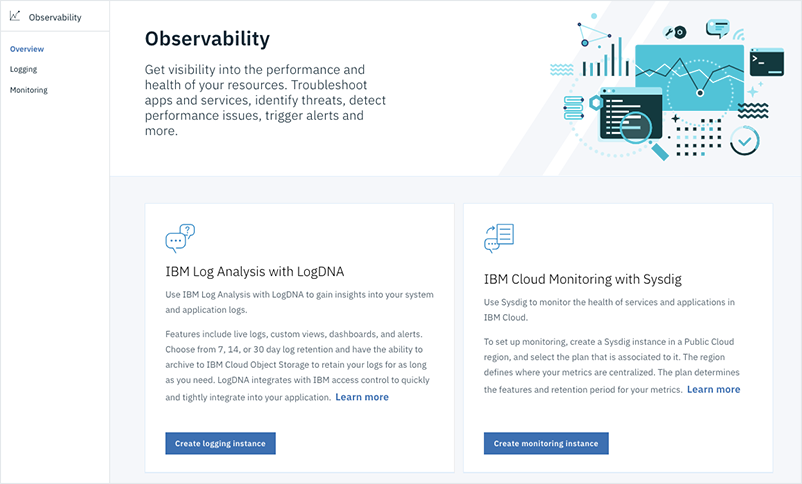
Observability solutions on IBM Cloud
\r\r
Visit the IBM Cloud Monitoring with Sysdig announcement blog on the IBM Cloud site for even more details and links to help you get started!
\r\r
Eager for more?
\r\r
Sign up for your own IBM Cloud account to explore IKS and the new Sysdig service – just click here.