


Falco Feeds extends the power of Falco by giving open source-focused companies access to expert-written rules that are continuously updated as new threats are discovered.

A Prometheus CloudWatch exporter is a key element for anyone wanting to monitor AWS CloudWatch. Exporting CloudWatch metrics to a Prometheus server allows leveraging of the power of PromQL queries, integrating AWS metrics with those from other applications or cloud providers, and creating advanced dashboards for digging down into problems.
But, who watches the watcher? Despite those advantages, using the wrong exporter or an incorrect configuration can have bad consequences in production environments. Throttling the AWS API can block it for operational uses, excess of metrics or queries can cause extra billing costs, and incorrect configurations can lead to missing data in the time series.
Having trouble scaling Prometheus monitoring?
Watch our on-demand webinar, where we share our experience using Prometheus at scale, providing different solutions and highlighting the challenges to solve in each step:
Cloud Native Monitoring: Scaling Prometheus →
On our journey to provide a scalable Prometheus monitoring experience, we realized we needed to provide a production grade Prometheus CloudWatch exporter.
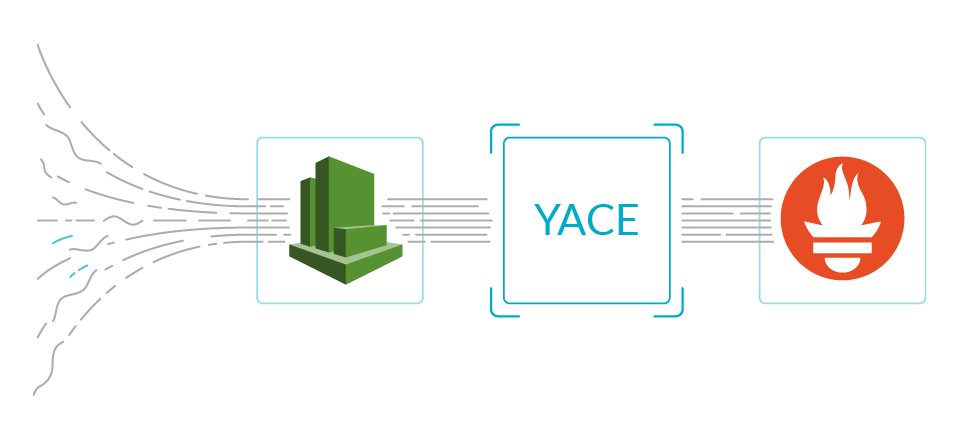
To achieve this, instead of starting from scratch, we chose YACE (Yet Another CloudWatch Exporter) and contributed to this open source project. Key improvements were made to increase its stability, prevent throttling and optimize API calls to reduce the costs of the AWS CloudWatch metrics usage.
Now, this Prometheus CloudWatch exporter, when used with the proper configuration, can be safely deployed in production environments. This way, it's possible to monitor AWS CloudWatch and integrate its metrics in Prometheus servers without affecting the availability of AWS API and controlling the cost of the AWS CloudWatch service.
In this article, you will learn first how Prometheus expands AWS CloudWatch, and what the issues are with the existing exporters. Next, you can dig into the technical details of how we reduced the number of API calls and improved stability. Don't miss our conclusions and related resources at the end.
"These key contributions to the YACE Prometheus CloudWatch exporter improve its stability and optimize API calls to help you reduce costs"
The synergy of CloudWatch and Prometheus
In the journey to the cloud, for many companies, AWS managed services are the preferred option. AWS offers high-value services like Kubernetes clusters, serverless, databases, storage and on demand functions that free organizations from the management of infrastructure, scalability and software or hardware updates. This is a great advantage, especially for startups and newcomers to the cloud, because it allows them to focus their effort and personnel on their core business development.
However, being a managed service doesn't imply it shouldn't be monitored. Performance metrics for cloud-based services and applications are more valuable now that we no longer own the underlying infrastructure. Sometimes this data provides the only window we have into the managed infrastructure for the troubleshooting and optimization of our applications.
But how do we get metrics from those services? As opposed to virtual machines, most of the time you cannot install Prometheus servers and exporters on managed services. This is when AWS CloudWatch comes to the table.
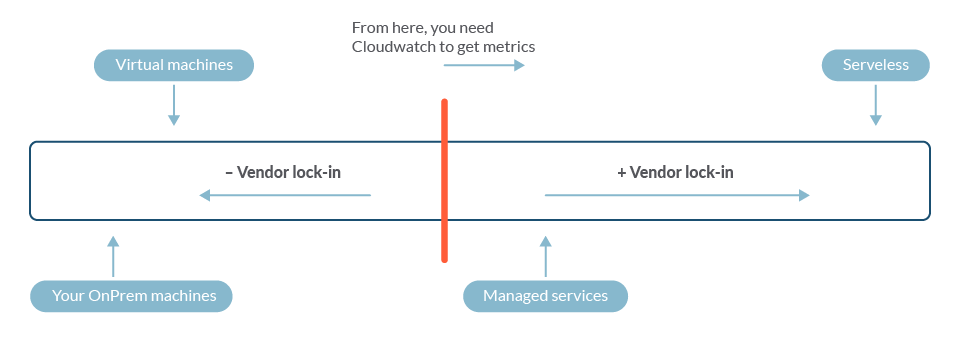
The more managed the service, the more platform dependency.
If you're on the right of the red line, you probably need CloudWatch to get metrics.
At this point, many people wonder if they can use CloudWatch metrics in Prometheus. The question they should ask is 'why not combine both?'
CloudWatch offers a set of highly valuable metrics for AWS managed and serverless services. On the other hand, Prometheus has a powerful querying language (PromQL). With PromQL you can create your own service level indicators, combining and aggregating metrics at will. Prometheus also allows you to instrument other parts of your system and your own code to provide custom metrics.
The relationship between AWS CloudWatch and Prometheus is not a competition, but rather a synergy. Monitoring AWS CloudWatch with Prometheus gives more functionalities and observability than using each of them individually.
Now that we understand the benefits of this union, we find a problem: AWS CloudWatch offers its metrics through an API and in the AWS console UI, but does not expose them in a format that Prometheus can ingest.
The solution is to use a Prometheus CloudWatch exporter. This is an application that can be configured to retrieve CloudWatch metrics through the AWS API, and expose them to an http endpoint in a format compatible with Prometheus. This way, Prometheus can scrape CloudWatch metrics and integrate them with the rest of your metrics from the other services and applications in your system.
The exporter that broke my AWS API
So, you decided to monitor AWS CloudWatch with Prometheus. A quick search points you to the official Prometheus CloudWatch Exporter. Its documentation includes instructions to set up AWS permissions and some examples of configuration files for different services. After cloning the repository, you prepare the IAM, permissions and a config file to start receiving metrics from your EC2 instances.
But when you start up the exporter and launch a Prometheus server to scrape it… something wrong happens.
The exporter starts to get multiple errors with code 400 and ThrottlingException in the description. It seems that the exporter is making too many API calls (maybe because of the number of EC2 instances that you have in that region).
This throttling is not only blocking the calls to the CloudWatch service. The AWS API of this account is blocked, causing various operational scripts to fail in some of their API calls.
How can an inoffensive exporter break the AWS API?
Digging into the code of the exporter, you find out that the function -GetMetricStatistics- makes an API call for each metric of every resource. Once you deploy the exporter, Prometheus scrapes it every minute. This means that, if you have around 200 instances in that AWS region and you configured 10 metrics for each instance, the exporter will try to make 2,000 API calls every 60 seconds (everytime that Prometheus scraps the exporter). That's too many, and this is what provoked the throttling and the eventual blocking of the API.
But that's not all. You start to calculate the costs of all of those metric queries to CloudWatch and realize that it's going to be quite expensive to monitor all of the services and resources that you need with the Prometheus CloudWatch exporter.
Fortunately, there's an alternative to the official Prometheus CloudWatch exporter called Yet Another CloudWatch Exporter (YACE).
This exporter is similar in configuration to the other one, but it uses another API function that allows it to query up to 500 metrics in a single call. This reduces the number of API calls from 2,000 to roughly a dozen, which eliminates the risk of throttling.
The YACE exporter seems like a good candidate, but there were some issues that had to be addressed to make it ready for production.
The first one was the possibility of crashing. Anytime the API was not available, or if it returned an error provoked by throttling, the exporter crashed. This also resulted in continuous restarts of the container where the exporter was deployed.
Another issue that affected performance was the high latency of the exporter. In scenarios with a high amount of resources, the scraping time sometimes exceeded 60 seconds. This caused timeout errors and in some scenarios, new scrapes overlapped with the previous unfinished ones. That increased the number of API calls, and thus, the risk of throttling.
Also, you could find that, for some metrics, CloudWatch may not return anything even though you know there was data available. The scrape appeared to be successful but some of the metrics were missing, which translated into data gaps in the metric graphs.
In the following sections, we'll describe how the contributions made by the Sysdig team to the open source YACE exporter repository addressed these issues.
Controlling CloudWatch calls with a proxy
The YACE exporter makes use of the GetMetricData API call to ask for several metrics in a single request. However, there is still the risk that concurrent or high frequency scraping of the exporter can cause both throttling on the API and extra billing costs for AWS CloudWatch.
High frequency scraping can be caused by a configuration of Prometheus with short scraping intervals, 10 seconds for example, or high availability deployments with more than one Prometheus server making independent scrapes to the exporters.
To avoid these scenarios, we changed the YACE exporter to decouple the serving of metrics and the querying for new data to CloudWatch. This way, the exporter acts as a proxy, asking for new data with a certain frequency, typically 300 seconds. Every time that a Prometheus server scrapes the exporter, it serves the last data recovered without having to query CloudWatch.
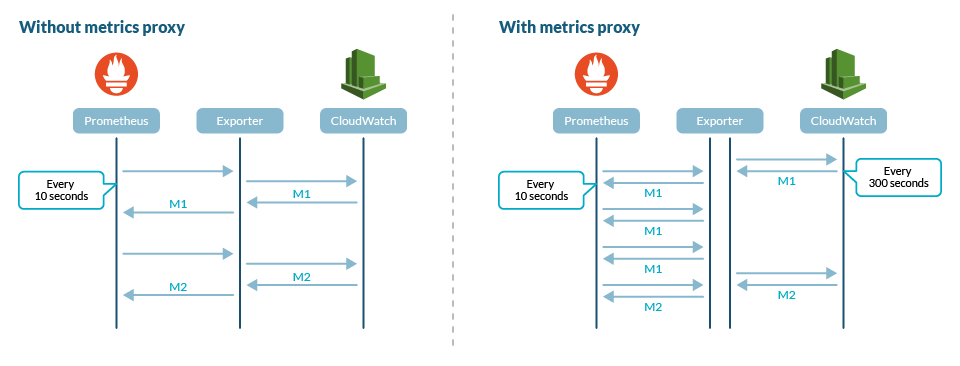
Why use a 300 seconds interval for data refreshing? AWS CloudWatch provides, in its free tier, a fair amount of metrics with 300 seconds granularity and up to 60 seconds granularity in its paid tiers.
If you need a different scraping frequency, you can configure the data refresh interval. You can also disable the decoupling to ask for new metrics in every scrape of the exporter.
One case of use of a different data refresh interval is the daily metrics for S3 buckets. These metrics change only once a day, so it doesn't make sense to ask for them every 5 minutes. Even if these two metrics are offered for free, querying them does account for the billing of AWS CloudWatch service. This can make a huge difference in accounts with a high number of buckets.
Knowing that, we could configure the data refresh interval to four hours. With this configuration in an account with 200 S3 buckets, we would go from 115.200 metrics a day to roughly 2.400, regardless of the scraping interval of our Prometheus server. That's almost 60 times less metrics! Note that without the proxy of metrics configured and with a default scraping time of 60 seconds, the number of AWS CloudWatch metrics per day would rise up to 576.000.
Using a different data refresh interval had also two additional effects on the exporter. The first was the drastic reduction of the scraping time, passing from tens of seconds (sometimes more than 60) to less than a second. Also, by design, it was impossible that two scrapes overlap in time, avoiding multiple concurrent calls to the API.
Reducing AWS API calls to cut costs and avoid throttling
Another optimization made in the YACE exporter is related to the number of API calls made. Not only does the exporter need to ask for AWS CloudWatch metrics, but there are other API calls made to retrieve the list of resources and metrics available. Those API calls are also accounted for in billing.
The YACE exporter has great filtering support by region and tags. You can leverage this feature to gather metrics from production deployments, or from specific resources (tagged as dev, staging, production, etc.).
To make this possible, the exporter has to ask AWS for the resources' metadata in every scrape, filter them, and then ask for the configured metrics for all of them.
And here, as everywhere, the devil is in the details.
First of all, not all of the resources may have all the configured metrics. Let's take back our previous example of the AWS account with 200 S3 buckets. Apart from the two daily metrics offered for free, there are other 16 metrics with 60 seconds seconds frequency. You have to enable those explicitly and they aren't free, so you would enable them only on the most critical buckets, like those where you want to alert when something goes wrong. Let's say 10 of your buckets are important, so you enable the extra metrics only on them.
In this scenario, the YACE exporter would make 3.600 API calls asking for metrics available: 18 metrics by 200 resources. As these are made concurrently, it will provoke throttling in the AWS API server. So all of the following requests asking for more available metrics and data will return an error. Not only that, but these API calls also have an impact in the AWS CloudWatch billing.
This is not a good scenario.
To fix this, we changed the logic in the YACE exporter to ask only once for all of the available resources where the metric is available and their dimensions of a certain metric. With this new behavior, in our example, the exporter will only make 18 API calls (one per metric configured) instead of the 3.600 that it was doing before.
This also makes it possible to ask for metrics of only the resources with data available. Instead of asking for 3.600 metrics in all of the 200 S3 buckets, the exporter will ask for 160 metrics in only the 10 buckets where we enabled those metrics (16 metrics by 10 resources).
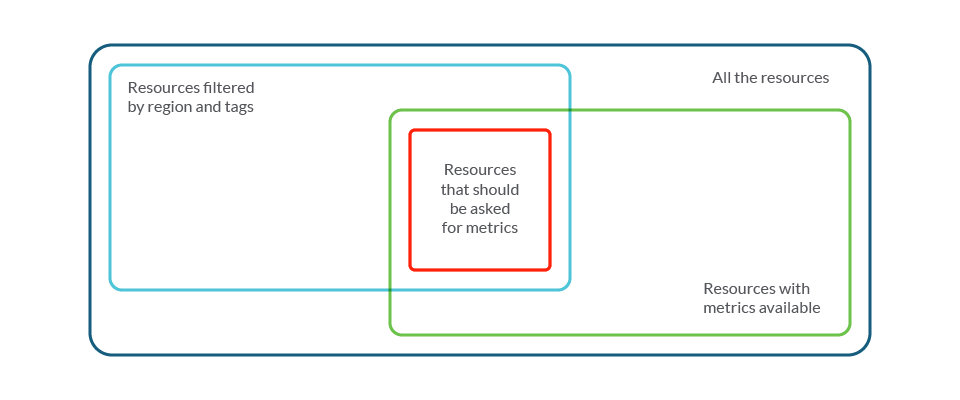
We changed the logic to ask only for those in the red section.
Also, there were two other edge cases that were fixed while working on this optimization.
In the application load balancers from the AWS ALB service, the resources can be either load balancers or target groups. Their metrics vary for load balancers used alone and those combined with target groups. This special case was optimized to avoid making API calls for each possible combination of load balancer and target group.
A bug caused the exporter to ignore the current configuration under certain circumstances, limiting it to asking for the data produced only in the last 120 seconds. This caused some data gaps that were frustrating, as CloudWatch was supposed to have that missing data available for collection. With this fixed, the exporter can now ask for data from longer periods of time (e.g., 600 seconds), eliminating those data gaps.
Other improvements in stability and API calls
During the implementation of these optimizations in the open source repository of the YACE exporter, we also made some contributions to improve its performance and stability.
One contribution directly related to the optimization of the number of API calls is the increase of metrics per GetMetricsData. When the function was first implemented in the exporter, AWS had a limit for this API call of 100 metrics per request. Later, AWS increased that limit to 500 metrics, but this wasn't updated on the exporter code. We didn't just update this, but also made it configurable by a flag, so now the YACE exporter can be quickly adapted if the limits for this API call change again.
Another contribution focused on improving handling of errors from the API. By preventing fatal errors in the exporter, in throttling scenarios or in errors from AWS API due to connection failures, we made it more reliable and ready for production environments.
Last but not least, we contributed in the integration of metrics for AWS Fargate, making them available via the AWS namespace ECS/ContainerInsights. This made possible the creation of resources for AWS Fargate in PromCat.io open source project.
Conclusion
AWS CloudWatch and Prometheus monitoring work in synergy. Monitoring AWS CloudWatch with Prometheus enables you to both use all of the power of promQL, and integrate AWS metrics with those from other applications and clouds.
You'll need a Prometheus CloudWatch exporter to access these metrics, but it must be reliable enough for production environments, and properly configured.
To help you achieve this, the Sysdig team contributed to the YACE CloudWatch exporter, improving its stability and optimizing the usage of AWS API calls and CloudWatch metrics.
In PromCat.io, you can find a collection of curated configurations, dashboards, alerts and recording rules for AWS services that leverage the YACE exporter to extract AWS CloudWatch metrics of different AWS Services. If you're using any of AWS services, try it out! We have prepared ready to go configurations and deployments both for local installations and for Kubernetes.
Ready to learn more? Read the AWS open source blog: Monitor AWS services used by Kubernetes with Prometheus and PromCat.
Also, Sysdig Monitor integrates and scales up to production grade Prometheus metrics, including those provided by the CloudWatch exporter. Try it out, get a free trial!